by Calculated Risk on 1/24/2016 08:51:00 PM
Sunday, January 24, 2016
Sunday Night Futures
From James Hamilton at Econbrowser: Can lower oil prices cause a recession?. An excerpt:
There are thus some reasons why a decrease in oil prices would be a boost to the U.S. economy and other reasons why it could even be a drag. A number of studies have looked at the effects of oil price decreases and concluded that these have little or no net positive effect on U.S. real GDP growth; see for example this survey. The price of oil fell from $30/barrel in November 1985 to $12 by July of 1986. U.S. real GDP continued growing throughout, logging a 2.9% increase overall for 1986, neither significantly faster nor slower than normal.Weekend:
But 1986 was a bad time for Texas and the other oil-producing states. Here’s a graph from some analysis I did with Michael Owyang of the Federal Reserve Bank of St. Louis. We estimated for each state’s employment growth a recession-dating algorithm like the one that Econbrowser updates each quarter for the overall U.S. economy (by the way, a new update will be posted this Friday). In the gif [at Econbrowser] you can watch the energy-producing states and their neighbors develop their own regional recession during the mid-1980’s even while national U.S. employment and GDP continued to grow.
...
[R]egardless of whether it’s oil prices that are moving stock prices or the other way around, folks in Texas and North Dakota have plenty of reason to be concerned.
• Schedule for Week of January 24, 2016
Monday:
• At 10:30 AM, the Dallas Fed Manufacturing Survey for January.
From CNBC: Pre-Market Data and Bloomberg futures: currently S&P futures are down 3 and DOW futures are down 33 (fair value).
Oil prices were up sharply over the last week with WTI futures at $32.24 per barrel and Brent at $32.33 per barrel. A year ago, WTI was at $46, and Brent was at $47 - so prices are down about 30% year-over-year.
Here is a graph from Gasbuddy.com for nationwide gasoline prices. Nationally prices are at $1.82 per gallon (down about $0.20 per gallon from a year ago).
Gasoline Prices and Exurbia
by Calculated Risk on 1/24/2016 10:46:00 AM
Here is a quote from an NPR article this morning: $1.22 A Gallon: Cheap Gas Raises Fears Of Urban Sprawl
"With the fall of gas prices, in a place like Columbus and most Midwestern cities, it really is going to encourage more sprawl," [Cleve Ricksecker, directs two Downtown Columbus Special Improvement Districts] says.Lower gasoline prices make exurbia more attractive (people have short memories), and we might see a shift to people buying homes with longer commutes.
Sprawl can mean more traffic jams and air pollution. But he says only a spike in the price of gas would change the equation when people are making decisions about where to live and work.
In 2008, I wrote a post: Temecula: 15% of homes REO or in Foreclosure. I noted that Temecula was being hit hard by both the housing bust and high gasoline prices:
I remember visiting a friend in Temecula about 3 years ago. We were standing in his front yard, and he started telling me what his neighbors did for a living. "A mortgage broker lives there. A real estate agent there. That guy is in construction. Another mortgage broker there" ... and on and on. Over half of the households on his block were dependent on the housing market in way or another.Here is that map. Now times are good in exurbia. The housing bust is over and gasoline prices are below $2 per gallon:
So it is no surprise that the housing bust is hitting Temecula hard.
But look at Temecula on this map. San Diego is far to the south - living in Escondido is a tough enough commute to work in San Diego. And Orange County is an even more difficult drive to the west. Imagine what $5 gasoline will do.
View Larger Map
Saturday, January 23, 2016
Schedule for Week of January 24, 2016
by Calculated Risk on 1/23/2016 08:11:00 AM
The key reports this week are the first estimate of Q4 GDP, December New Home sales, and the Case-Shiller House Price Index for November.
The FOMC is meeting on Tuesday and Wednesday, and no change in policy is expected at this meeting.
10:30 AM: Dallas Fed Manufacturing Survey for January.
9:00 AM: FHFA House Price Index for November 2015. This was originally a GSE only repeat sales, however there is also an expanded index. The consensus is for a 0.5% month-to-month increase for this index.
 9:00 AM: S&P/Case-Shiller House Price Index for November. Although this is the November report, it is really a 3 month average of September, October and November prices.
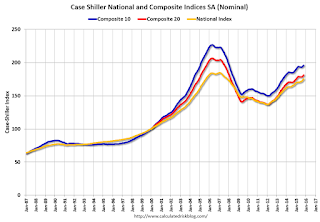
This graph shows the nominal seasonally adjusted National Index, Composite 10 and Composite 20 indexes through the October 2015 report (the Composite 20 was started in January 2000).
The consensus is for a 5.7% year-over-year increase in the Comp 20 index for November. The Zillow forecast is for the National Index to increase 5.3% year-over-year in November.
10:00 AM: Richmond Fed Survey of Manufacturing Activity for January.
10:00 AM ET: Regional and State Employment and Unemployment for December.
7:00 AM ET: The Mortgage Bankers Association (MBA) will release the results for the mortgage purchase applications index.
 10:00 AM: New Home Sales for December from the Census Bureau.
 This graph shows New Home Sales since 1963. The dashed line is the November sales rate.
The consensus is for a increase in sales to 500 thousand Seasonally Adjusted Annual Rate (SAAR) in December from 490 thousand in November.
2:00 PM: FOMC Meeting Announcement. The FOMC is expected to make no change to policy at this meeting.
8:30 AM: The initial weekly unemployment claims report will be released. The consensus is for 285 thousand initial claims, down from 293 thousand the previous week.
8:30 AM: Durable Goods Orders for December from the Census Bureau. The consensus is for a 0.2% increase in durable goods orders.
10:00 AM: Pending Home Sales Index for December. The consensus is for a 0.8% increase in the index.
10:00 AM: the Q4 Housing Vacancies and Homeownership from the Census Bureau.
11:00 AM: the Kansas City Fed manufacturing survey for January.
8:30 AM ET: Gross Domestic Product, 4th quarter 2015 (Advance estimate). The consensus is that real GDP increased 0.9% annualized in Q4.
9:45 AM: Chicago Purchasing Managers Index for January. The consensus is for a reading of 45.5, up from 42.9 in December.
10:00 AM: University of Michigan's Consumer sentiment index (final for January). The consensus is for a reading of 93.0, down from the preliminary reading 93.3.
Friday, January 22, 2016
DOT: Vehicle Miles Driven increased 4.3% year-over-year in November
by Calculated Risk on 1/22/2016 04:57:00 PM
With lower gasoline prices, driving has really picked up!
The Department of Transportation (DOT) reported today:
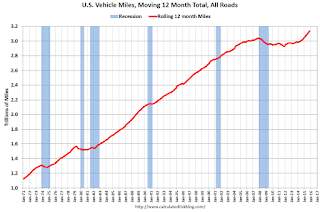
Travel on all roads and streets changed by 4.3% (10.4 billion vehicle miles) for November 2015 as compared with November 2014.The following graph shows the rolling 12 month total vehicle miles driven to remove the seasonal factors.
Travel for the month is estimated to be 253.2 billion vehicle miles.
The seasonally adjusted vehicle miles traveled for November 2015 is 264.0 billion miles, a 3.4% (8.8 billion vehicle miles) increase over November 2014. It also represents less than a 0.1% increase (13 million vehicle miles) compared with October 2015.
The rolling 12 month total is moving up - mostly due to lower gasoline prices - after moving sideways for several years.
 Click on graph for larger image.
In the early '80s, miles driven (rolling 12 months) stayed below the previous peak for 39 months.
Miles driven (rolling 12) had been below the previous peak for 85 months - an all time record - before reaching a new high for miles driven in January.
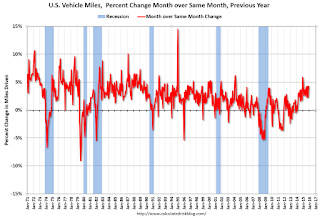
The second graph shows the year-over-year change from the same month in the previous year.
 In November 2015, gasoline averaged $2.26 per gallon according to the EIA. That was down significantly from November 2014 when prices averaged $3.00 per gallon. Gasoline prices have continued to decline, and vehicle miles will probably up sharply year-over-year in December and January.
Gasoline prices aren't the only factor - demographics are also important. However, with lower gasoline prices, miles driven - on a rolling 12 month basis - is setting new highs each month.
Black Knight's First Look at December Mortgage Data
by Calculated Risk on 1/22/2016 03:11:00 PM
From Black Knight: Black Knight Financial Services’ “First Look” at December 2015 Mortgage Data, 2015 Ends with 22 Percent Improvement in Foreclosure Inventory, 15 Percent Decline in Delinquencies
According to Black Knight's First Look report for December, the percent of loans delinquent decreased 3% in December compared to November, and declined 15% year-over-year.
The percent of loans in the foreclosure process declined 1% in December and were down 22% over the last year.
Black Knight reported the U.S. mortgage delinquency rate (loans 30 or more days past due, but not in foreclosure) was 4.78% in December, down from 4.92% in November.
The percent of loans in the foreclosure process declined in December to 1.37%.
The number of delinquent properties, but not in foreclosure, is down 425,000 properties year-over-year, and the number of properties in the foreclosure process is down 192,000 properties year-over-year.
Black Knight will release the complete mortgage monitor for December in early February.
| Black Knight: Percent Loans Delinquent and in Foreclosure Process | ||||
|---|---|---|---|---|
| Dec 2015 | Nov 2015 | Dec 2014 | Dec 2013 | |
| Delinquent | 4.78% | 4.92% | 5.62% | 6.45% |
| In Foreclosure | 1.37% | 1.38% | 1.75% | 2.52% |
| Number of properties: | ||||
| Number of properties that are delinquent, but not in foreclosure: | 2,408,000 | 2,491,000 | 2,833,000 | 3,252,000 |
| Number of properties in foreclosure pre-sale inventory: | 689,000 | 698,000 | 881,000 | 1,269,000 |
| Total Properties | 3,097,000 | 3,189,000 | 3,715,000 | 4,533,000 |
A Few Random Comments on December Existing Home Sales
by Calculated Risk on 1/22/2016 12:21:00 PM
Everyone expected a rebound in existing home sales in December. The key reason for the decline in November was the new TILA-RESPA Integrated Disclosure (TRID). In early October, this new disclosure rule pushed down mortgage applications sharply, however applications bounced back - and so did home sales in December. No surprise. Note: TILA: Truth in Lending Act, and RESPA: the Real Estate Settlement Procedures Act of 1974.
However, most analysts underestimated the strength of the rebound. (Not CR readers who expected an above consensus report).
As I've noted before, there are some economic reasons to expect some softness in existing home sales in 2016. Low inventory is probably holding down sales in many areas, and there will be weakness in some oil producing areas (see: Houston has a problem).
Earlier: Existing Home Sales increased in December to 5.46 million SAAR
I expected some increase in inventory in 2015, but that didn't happened. Inventory is still very low and falling year-over-year (down 3.8% year-over-year in December). More inventory would probably mean smaller price increases and slightly higher sales, and less inventory means lower sales and somewhat larger price increases.
The following graph shows existing home sales Not Seasonally Adjusted (NSA).

Sales NSA in December (red column) were the highest since December 2006 (NSA).
Existing Home Sales increased in December to 5.46 million SAAR
by Calculated Risk on 1/22/2016 10:11:00 AM
From the NAR: Existing-Home Sales Surge Back in December
Existing-home sales snapped back solidly in December as more buyers reached the market before the end of the year, and the delayed closings resulting from the rollout of the Know Before You Owe initiative pushed a portion of November's would-be transactions into last month's figure, according to the National Association of Realtors®. ...
Total existing-home sales, which are completed transactions that include single-family homes, townhomes, condominiums and co-ops, ascended 14.7 percent to a seasonally adjusted annual rate of 5.46 million in December from 4.76 million in November. After last month's turnaround (the largest monthly increase ever recorded), sales are now 7.7 percent above a year ago. ...
Total housing inventory at the end of December dropped 12.3 percent to 1.79 million existing homes available for sale, and is now 3.8 percent lower than a year ago (1.86 million). Unsold inventory is at a 3.9-month supply at the current sales pace, down from 5.1 months in November and the lowest since January 2005 (3.6 months).
 Click on graph for larger image.
This graph shows existing home sales, on a Seasonally Adjusted Annual Rate (SAAR) basis since 1993.
Sales in December (5.46 million SAAR) were 14.7% higher than last month, and were 7.7% above the December 2014 rate.
The second graph shows nationwide inventory for existing homes.
 According to the NAR, inventory decreased to 1.79 million in December from 2.04 million in November. Headline inventory is not seasonally adjusted, and inventory usually decreases to the seasonal lows in December and January, and peaks in mid-to-late summer.
The third graph shows the year-over-year (YoY) change in reported existing home inventory and months-of-supply. Since inventory is not seasonally adjusted, it really helps to look at the YoY change. Note: Months-of-supply is based on the seasonally adjusted sales and not seasonally adjusted inventory.
 Inventory decreased 3.8% year-over-year in December compared to December 2014.
 Months of supply was at 3.9 months in December.
This was above consensus expectations of sales of 5.19 million (but not a surprise for CR readers). For existing home sales, a key number is inventory - and inventory is still low. I'll have more later ...
Chicago Fed: "Index shows economic growth below average in December"
by Calculated Risk on 1/22/2016 08:36:00 AM
The Chicago Fed released the national activity index (a composite index of other indicators): Index shows economic growth below average in December
The Chicago Fed National Activity Index (CFNAI) moved up to –0.22 in December from –0.36 in November. Two of the four broad categories of indicators that make up the index increased from November, but three of the four categories made negative contributions to the index in December.This graph shows the Chicago Fed National Activity Index (three month moving average) since 1967.
The index’s three-month moving average, CFNAI-MA3, decreased to –0.24 in December from –0.19 in November. December’s CFNAI-MA3 suggests that growth in national economic activity was somewhat below its historical trend. The economic growth reflected in this level of the CFNAI-MA3 suggests subdued inflationary pressure from economic activity over the coming year.
emphasis added
 Click on graph for larger image.
This suggests economic activity was somewhat below the historical trend in December (using the three-month average).
According to the Chicago Fed:
What is the National Activity Index? The index is a weighted average of 85 indicators of national economic activity drawn from four broad categories of data: 1) production and income; 2) employment, unemployment, and hours; 3) personal consumption and housing; and 4) sales, orders, and inventories.
A zero value for the index indicates that the national economy is expanding at its historical trend rate of growth; negative values indicate below-average growth; and positive values indicate above-average growth.
Thursday, January 21, 2016
Friday: Existing Home Sales
by Calculated Risk on 1/21/2016 05:27:00 PM
Housing economist Tom Lawler estimates the NAR will report December sales of 5.36 million on a seasonally adjusted annual rate (SAAR) basis, up from 4.76 million SAAR in November.
Based on Lawler's estimate, I'd take the "over" tomorrow. Note: Lawler is not always right on, but he is usually pretty close. See this post for a review of Lawler's track record.
Friday:
• At 8:30 AM, the Chicago Fed National Activity Index for December. This is a composite index of other data.
• At 10:00 AM, Existing Home Sales for December from the National Association of Realtors (NAR). The consensus is for 5.19 million SAAR, up from 4.76 million in November.
Private Investment and the Business Cycle
by Calculated Risk on 1/21/2016 03:20:00 PM
The following is an update to a few graphs and analysis that I started posting in 2005. In 2005 I was bearish on residential investment, and I used these graphs to argue that the then coming housing bust would lead the economy into a recession. Now this analysis is suggesting more growth ... (note: Some of this discussion is updated from previous posts).
Discussions of the business cycle frequently focus on consumer spending (PCE: Personal consumption expenditures), but the key is to watch private domestic investment, especially residential investment. Even though private investment usually only accounts for around 15% of GDP, the swings for private investment are significantly larger than for PCE during the business cycle, so private investment has an outsized impact on GDP at transitions in the business cycle.
The first graph shows the real annualized change in GDP and private investment since 1976 through Q3 2016 (this is a 3 quarter centered average to smooth the graph).
GDP has fairly small annualized changes compared to the huge swings in investment, especially during and just following a recession. This is why investment is one of the keys to the business cycle.

Note that during the recent recession, the largest decline for GDP was in Q4 2008 (a 8.2% annualized rate of decline). On a three quarter center averaged basis (as presented on graph), the largest decline was 5.2% annualized.
However the largest decline for private investment was a 39% annualized rate! On a three quarter average basis (on graph), private investment declined at a 31% annualized rate.
The second graph shows the contribution to GDP from the five categories of private investment: residential investment, equipment and software, nonresidential structures, intellectual property and "Change in private inventories". Note: this is a 3 quarter centered average of the contribution to GDP.
This is important to follow because residential investment tends to lead the economy, equipment and software is generally coincident, and nonresidential structure investment lags the business cycle. Red is residential, green is equipment and software, and blue is investment in non-residential structures. The usual pattern - both into and out of recessions is - red, green, and blue.

The key leading sector - residential investment - lagged the recent recovery because of the huge overhang of existing inventory. Usually residential investment is a strong contributor to GDP growth and employment in the early stages of a recovery, but not this time - and that weakness was a key reason why the recovery was sluggish.
Residential investment turned positive in 2011, and made a positive contribution to GDP through 2015.

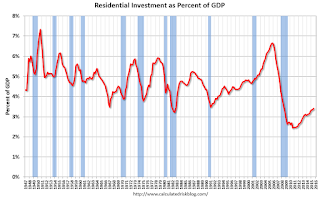
The third graph shows residential investment as a percent of GDP. Residential investment as a percent of GDP is still very low, and it seems likely that residential investment as a percent of GDP will increase further in 2016.
Nothing is perfect, but residential investment suggests further growth. Add in the improvement in household balance sheets, some contribution from Federal, state and local governments, and a further increase in non-residential structures in 2016 (ex-energy) - and the economy should continue to grow.


