 RSS Feed
 by Calculated Risk on 12/08/2015 10:15:00 AM
Tuesday, December 08, 2015
BLS: Jobs Openings "little changed" in October
From the BLS: Job Openings and Labor Turnover Summary
The number of job openings was little changed at 5.4 million on the last business day of October, the U.S. Bureau of Labor Statistics reported today. Hires and separations were little changed at 5.1 million and 4.9 million, respectively. Within separations, the quits rate was 1.9 percent for the seventh consecutive month, and the layoffs and discharges rate was 1.2 percent. ...The following graph shows job openings (yellow line), hires (dark blue), Layoff, Discharges and other (red column), and Quits (light blue column) from the JOLTS.
...
Quits are generally voluntary separations initiated by the employee. Therefore, the quits rate can serve as a measure of workers’ willingness or ability to leave jobs. ... There were 2.8 million quits in October, little changed from September. The number of quits has held between 2.7 million and 2.8 million for the past 14 months. The quits rate remained unchanged in October, measuring 1.9 percent for the seventh consecutive month
emphasis added
This series started in December 2000.
Note: The difference between JOLTS hires and separations is similar to the CES (payroll survey) net jobs headline numbers. This report is for October, the most recent employment report was for November.
 Click on graph for larger image.
Note that hires (dark blue) and total separations (red and light blue columns stacked) are pretty close each month. This is a measure of labor market turnover. When the blue line is above the two stacked columns, the economy is adding net jobs - when it is below the columns, the economy is losing jobs.
Jobs openings decreased in October to 5.383 million from 5.534 million in September.
The number of job openings (yellow) are up 11% year-over-year compared to October 2014.
Quits are up slightly year-over-year. These are voluntary separations. (see light blue columns at bottom of graph for trend for "quits").
This is a solid report. Job openings are close to the record high set in July, although Quits have leveled off.
NFIB: Small Business Optimism Index declined in November
by Calculated Risk on 12/08/2015 09:01:00 AM
From the National Federation of Independent Business (NFIB): Small Business Optimism Collapses in November After Three Stagnant Months
The Index of Small Business Optimism was fell 1.3 points in November, dropping the Index to 94.8, this after three months of no change of any significance. ...
A seasonally adjusted net 11 percent plan to create new jobs, unchanged. A seasonally adjusted net 23 percent of owners reported raising worker compensation, up 2 points and at an expansion high. ...
emphasis added
 Click on graph for larger image.
This graph shows the small business optimism index since 1986.
The index declined to 94.8 in November.
Hiring plans are solid, and it appears there is growing wage pressure.
Monday, December 07, 2015
Tuesday: Job Openings
by Calculated Risk on 12/07/2015 08:59:00 PM
From the WSJ: Oil Plunges to Near Seven-Year Lows
Oil prices plunged to near seven-year lows Monday on expectations that producers around the world will continue pumping crude at near-record levels in an already oversupplied market.Average gasoline prices are at $2.03 per gallon, and will probably be below $2.00 soon. When oil prices declined in 2008, it was due to a collapse in demand. This time supply is a huge factor in the price decline (there is some global weakness too).
...
Light, sweet crude for January delivery settled down $2.32, or 5.8%, to $37.65 a barrel on the New York Mercantile Exchange. ... Brent, the global benchmark, fell $2.27, or 5.3%, to $40.73 a barrel on ICE Futures Europe.
Both benchmarks posted their lowest settlement prices since Feb. 18, 2009, during the depths of the financial crisis.
Tuesday:
• At 9:00 AM ET, NFIB Small Business Optimism Index for November.
• At 10:00 AM, the Job Openings and Labor Turnover Survey for October from the BLS. Jobs openings increased in September to 5.526 million from 5.377 million in August. The number of job openings were up 18% year-over-year in September, and Quits were unchanged year-over-year.
Duy's Fed Watch: "And That's A Wrap"
by Calculated Risk on 12/07/2015 06:07:00 PM
A few excerpts from a piece by Tim Duy: And That's A Wrap
If you had any doubt about the outcome of next week's FOMC meeting, Friday's employment report set you straight. When I try to think about what could stay the Fed's hand at this point, I am down to zombie apocalypse or act of God. I am not betting on either. By next week, we will be wrapping up our coverage of ZIRP, quietly filing away everything we learned for the next recession. That we return to ZIRP in the future remains my long-run view. But that is a concern for a future date.CR Note: The FOMC meets next week, and it appears the FOMC raise rates on December 16th.
...
Bottom Line: Rate hike coming. This round of ZIRP is nearly wrapped up. But that end is really just a new beginning. Arguably, the end of ZIRP raises more questions than it answers. The pace of subsequent tightening, the normalization - or not - of the balance sheet, and the countdown to the next easing are all issues now on the table.
Phoenix Real Estate in November: Sales up 6%, Inventory down 9%
by Calculated Risk on 12/07/2015 02:26:00 PM
This is a key distressed market to follow since Phoenix saw a large bubble / bust followed by strong investor buying.
For the twelfth consecutive month, inventory was down year-over-year in Phoenix. This is a significant change from last year.
The Arizona Regional Multiple Listing Service (ARMLS) reports (table below):
1) Overall sales in November were up 6.5% year-over-year.
2) Cash Sales (frequently investors) were up slightly at 29.1% of total sales.
3) Active inventory is now down 8.8% year-over-year.
More inventory (a theme in 2014) - and less investor buying - suggested price increases would slow sharply in 2014. And prices increases did slow in 2014, only increasing 2.4% according to Case-Shiller.
Now, with falling inventory, prices are increasing a little faster in 2015 (something to watch if inventory continues to decline). Prices are already up 4.0% through September (about double the pace for 2014).
| November Residential Sales and Inventory, Greater Phoenix Area, ARMLS | ||||||
|---|---|---|---|---|---|---|
| Sales | YoY Change Sales | Cash Sales | Percent Cash | Active Inventory | YoY Change Inventory | |
| Nov-08 | 4,417 | --- | 1,217 | 27.6% | 56,2271 | --- |
| Nov-09 | 7,494 | 69.7% | 2,572 | 34.3% | 40,372 | -28.2% |
| Nov-10 | 6,789 | -9.4% | 2,966 | 43.7% | 45,353 | 12.3% |
| Nov-11 | 7,147 | 5.3% | 3,245 | 45.4% | 26,798 | -40.9% |
| Nov-12 | 6,810 | -4.7% | 2,945 | 43.2% | 23,232 | -13.3% |
| Nov-13 | 5,181 | -23.9% | 1,761 | 34.0% | 26,762 | 15.2% |
| Nov-14 | 4,986 | -3.8% | 1,396 | 28.0% | 27,426 | 2.5% |
| Nov-15 | 5,308 | 6.5% | 1,542 | 29.1% | 25,022 | -8.8% |
| 1 November 2008 probably includes pending listings | ||||||
Las Vegas Real Estate in November: Sales Decreased Slightly, Inventory Down YoY
by Calculated Risk on 12/07/2015 11:11:00 AM
This is a key distressed market to follow since Las Vegas has seen the largest price decline of any of the Case-Shiller composite 20 cities.
The Greater Las Vegas Association of Realtors reported GLVAR Reports Local Home Prices Buck Cooling Trend and Hold Steady
According to GLVAR, the total number of existing local homes, condominiums and townhomes sold in November was 2,476, down slightly from 2,483 one year ago. Compared to November 2014, 2.9 percent fewer homes but 11.3 percent more condos and townhomes sold this November. Local home sales so far this year remain ahead of last year’s pace, Lynam said.1) Overall sales were down slightly year-over-year. This is a change since sales have been up year-over-year recently.
As for other local housing trends, GLVAR has been reporting fewer distressed sales and more traditional home sales, where lenders are not controlling the transaction. In November, 7.1 percent of all local sales were short sales – which occur when lenders allow borrowers to sell a home for less than what they owe on the mortgage. That’s down from 9.6 percent one year ago. Another 6.7 percent of all November sales were bank-owned, down from 8.7 percent one year ago.
...
By the end of November, GLVAR reported 7,772 single-family homes listed without any sort of offer. That’s down 5.2 percent from one year ago. For condos and townhomes, the 2,282 properties listed without offers in November represented a 7.2 percent decrease from one year ago.
emphasis added
2) Conventional (equity, not distressed) sales were up 5% year-over-year. In Nov 2014, 81.7% of all sales were conventional equity. In Nov 2015, 86.2% were standard equity sales.
3) The percent of cash sales increased year-over-year from 31.9% in Nov 2014 to 33.2% in Nov 2015. This is another change - this is the first year-over-year increase in a long time - and is probably due to more condo sales in November.
4) Non-contingent inventory is down 5.2% year-over-year. This was the third month in a row with a YoY decline in inventory. The table below shows the year-over-year change for non-contingent inventory in Las Vegas. Inventory declined sharply through early 2013, and then inventory started increasing sharply year-over-year. It appears the inventory build is over.
| Las Vegas: Year-over-year Change in Non-contingent Inventory | |
|---|---|
| Month | YoY |
| Jan-13 | -58.3% |
| Feb-13 | -53.4% |
| Mar-13 | -42.1% |
| Apr-13 | -24.1% |
| May-13 | -13.2% |
| Jun-13 | 3.7% |
| Jul-13 | 9.0% |
| Aug-13 | 41.1% |
| Sep-13 | 60.5% |
| Oct-13 | 73.4% |
| Nov-13 | 77.4% |
| Dec-13 | 78.6% |
| Jan-14 | 96.2% |
| Feb-14 | 107.3% |
| Mar-14 | 127.9% |
| Apr-14 | 103.1% |
| May-14 | 100.6% |
| Jun-14 | 86.2% |
| Jul-14 | 55.2% |
| Aug-14 | 38.8% |
| Sep-14 | 29.5% |
| Oct-14 | 25.6% |
| Nov-14 | 20.0% |
| Dec-14 | 18.0% |
| Jan-15 | 12.9% |
| Feb-15 | 15.8% |
| Mar-15 | 12.2% |
| Apr-15 | 7.6% |
| May-15 | 7.8% |
| Jun-15 | 4.3% |
| Jul-15 | 5.1% |
| Aug-15 | 3.5% |
| Sep-15 | -0.8% |
| Oct-15 | -7.1% |
| Nov-15 | -5.2% |
Black Knight October Mortgage Monitor
by Calculated Risk on 12/07/2015 08:35:00 AM
Black Knight Financial Services (BKFS) released their Mortgage Monitor report for October today. According to BKFS, 4.77% of mortgages were delinquent in October, down from 4.87% in September. BKFS reported that 1.43% of mortgages were in the foreclosure process.
This gives a total of 6.20% delinquent or in foreclosure.
Press Release: Black Knight’s October Mortgage Monitor: Despite New GSE Products, FHA/VA Still Dominate High-LTV Lending; Cash Share of Residential Sales Hits 7-Year Low
Today, the Data & Analytics division of Black Knight Financial Services, Inc. (NYSE: BKFS) released its latest Mortgage Monitor Report, based on data as of the end of October 2015. This month, Black Knight looked at high loan-to-value (LTV) products – greater than 95 percent LTV – in light of the GSEs’ reintroduction of high-LTV products at the end of 2014, coupled with the 50-basis-point reduction in FHA annual mortgage insurance premiums earlier this year. Despite the renewed availability of GSE products, the data shows that high-LTV lending is still primarily the province of the FHA/VA. As Black Knight Data & Analytics Senior Vice President Ben Graboske explained, the FHA/VA has been the primary driver in what is an expanding segment of the purchase origination market.
“High-LTV purchase mortgage originations are up 20 percent in the third quarter over last year,” said Graboske. “That’s compared to an approximately 13 percent increase for the purchase market overall. High-LTV products now account for 23 percent of all purchase originations. What’s particularly interesting is how heavily this market is dominated by FHA/VA. Back in 2007, the GSEs made up over 45 percent of high-LTV purchase originations, while FHA/VA lending made up roughly one-third. Since 2009, FHA/VA products have made up over 90 percent of high-LTV purchase originations every year, and the same is true in 2015, even with the GSEs having reintroduced their own 97 percent LTV products. In fact, those products have accounted for less than 3 percent of all high-LTV originations so far this year.
“As we reported last month, recent increases in purchase lending have been driven primarily by higher-credit- score borrowers, and these high-LTV products are no exception. We’ve seen average credit scores on high-LTV FHA/VA loans rise six points from last year to 706. Of course, scores for GSE and portfolio high-LTV loans are roughly 35 points higher still. We’ve actually seen annual declines in high-LTV lending among 620-660 credit scores for each of the past six months even though overall high-LTV purchase volumes have risen in each of those months. This may be attributed to tightening credit, or it may be that the FHA’s reduced annual mortgage insurance – which FHA estimates will reduce borrowers’ mortgage payments by $900/year – has enticed some higher-credit borrowers into those FHA products.”
 Click on graph for larger image.
This graph from Black Knight shows the purchase origination distribution by LTV and investor (FHA, GSE and portfolio).
From Black Knight:
High-LTV loans account for 77 percent of FHA/ VA purchase originations through August this year, as compared to only 1 percent of GSE purchase originationsThere is much more in the mortgage monitor.
Almost 2/3 of portfolio purchase originations are less than 79 percent LTV products, but there is also some exposure to higher LTV products as well, albeit in higher credit tranches
Nearly 75 percent of high LTV portfolio products have credit scores above 700, while over half of FHA/VA originations have credit scores below 700
Sunday, December 06, 2015
Sunday Night Futures
by Calculated Risk on 12/06/2015 08:21:00 PM
A quick note: Oil prices have fallen near the lows for the year.
WTI hit $38.22 per barrel in August 2015 - the low for the year - and WTI prices are now at $39.54 (the low for WTI in 2008 was $30.28).
In November 2015, Brent hit $40.28 per barrel, and Brent prices are now at $42.80 (the low for WTI in 2008 was $33.73).
Monday:
• At 10:00 AM ET, The Fed will release the monthly Labor Market Conditions Index (LMCI).
• At 3:00 PM, Consumer Credit for October from the Federal Reserve. The consensus is for an increase of $20 billion in credit.
Weekend:
• Schedule for Week of December 6th
• The Endless Parade of Recession Calls
From CNBC: Pre-Market Data and Bloomberg futures: currently S&P futures are down 3 and DOW futures are down 25 (fair value).
Oil prices were down over the last week with WTI futures at $39.54 per barrel and Brent at $42.80 per barrel. A year ago, WTI was at $66, and Brent was at $68 - so prices are down almost 40% year-over-year (It was a year ago that prices were falling sharply).
Here is a graph from Gasbuddy.com for nationwide gasoline prices. Nationally prices are at $2.03 per gallon (down about $0.65 per gallon from a year ago).
The Endless Parade of Recession Calls
by Calculated Risk on 12/06/2015 10:53:00 AM
Note: I've made one recession call since starting this blog. One of my predictions for 2007 was a recession would start as a result of the housing bust (made it by one month - the recession started in December 2007). That prediction was out of the consensus for 2007 and, at the time, ECRI was saying a "recession is no longer a serious concern". Ouch.
For the last 6+ years, there have been an endless parade of incorrect recession calls. The most reported was probably the multiple recession calls from ECRI in 2011 and 2012.
In May of this year, ECRI finally acknowledged their incorrect call, and here is their admission : The Greater Moderation
In line with the old adage, “never say never,” [ECRI's] September 2011 U.S. recession forecast did turn out to be a false alarm.I disagreed with that call in 2011; I wasn't even on recession watch!
And here is another call today via CNBC: US economy recession odds '65 percent': Investor
Raoul Pal, the publisher of The Global Macro Investor, reiterated his bearishness ... "The economic situation is deteriorating fast." ... [The ISM report] "is showing that the U.S. economy is almost at stall speed now," Pal said. "It gives us a 65 percent chance of a recession in the U.S.Here is the report Pal is referring to from the Institute for Supply Management: November 2015 Manufacturing ISM® Report On Business®
 Click on graph for larger image.
Here is a long term graph of the ISM manufacturing index.
The manufacturing sector has been weak, and contracted in the US in November due to a combination of weakness in the oil sector, the strong dollar and some global weakness. But this doesn't mean the US will enter a recession.
The last time the index contracted was in 2012 (no recession), and has shown contraction a number of times outside of a recession.
Looking at the economic data, the odds of a recession in 2016 are very low (extremely unlikely in my view). Someday I'll make another recession call, but I'm not even on recession watch now.
Saturday, December 05, 2015
Schedule for Week of December 6th
by Calculated Risk on 12/05/2015 08:11:00 AM
The key economic report this week is November retail sales on Friday.
10:00 AM ET: The Fed will release the monthly Labor Market Conditions Index (LMCI).
3:00 PM: Consumer Credit for October from the Federal Reserve. The consensus is for an increase of $20 billion in credit.
9:00 AM ET: NFIB Small Business Optimism Index for November.
 10:00 AM: Job Openings and Labor Turnover Survey for October from the BLS.
 This graph shows job openings (yellow line), hires (purple), Layoff, Discharges and other (red column), and Quits (light blue column) from the JOLTS.
Jobs openings increased in September to 5.526 million from 5.377 million in August.
The number of job openings (yellow) were up 18% year-over-year, and Quits were unchanged year-over-year.
7:00 AM ET: The Mortgage Bankers Association (MBA) will release the results for the mortgage purchase applications index.
10:00 AM: Monthly Wholesale Trade: Sales and Inventories for October. The consensus is for a 0.2% increase in inventories.
8:30 AM: The initial weekly unemployment claims report will be released. The consensus is for 270 thousand initial claims, up from 269 thousand the previous week.
10:00 AM: The Q3 Quarterly Services Report from the Census Bureau.
12:00 PM: Q3 Flow of Funds Accounts of the United States from the Federal Reserve.
2:00 PM: The Monthly Treasury Budget Statement for November.
8:30 AM: The Producer Price Index for November from the BLS. The consensus is for no changed in prices, and a 0.1% increase in core PPI.
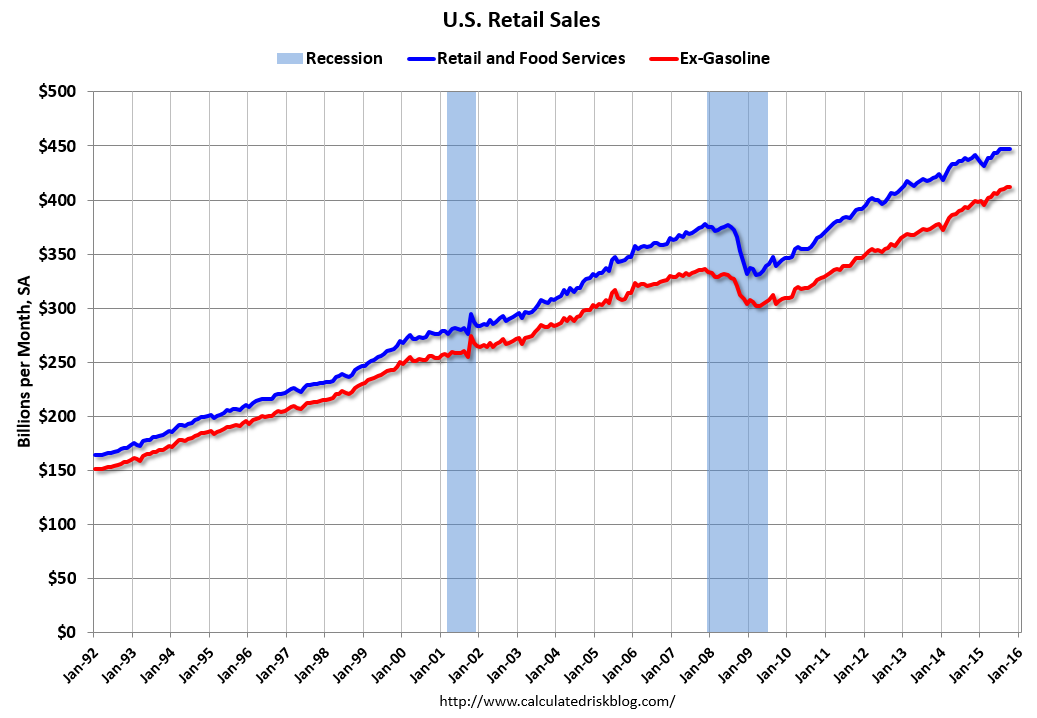 8:30 AM ET: Retail sales for November will be released.
This graph shows retail sales since 1992 through October 2015. This is monthly retail sales and food service, seasonally adjusted (total and ex-gasoline). On a monthly basis, retail sales were up 0.1% from September to October (seasonally adjusted), and sales were up 1.7% from October 2014.
The consensus is for retail sales to increase 0.3% in November, and to increase 0.3% ex-autos.
10:00 AM: Manufacturing and Trade: Inventories and Sales (business inventories) report for October. The consensus is for a 0.1% increase in inventories.
10:00 AM: University of Michigan's Consumer sentiment index (preliminary for December). The consensus is for a reading of 92.0, up from 91.3 in November.


