by Calculated Risk on 8/04/2015 03:18:00 PM
Tuesday, August 04, 2015
Lawler: Large Home Builder Results, Q2/2015
From housing economist Tom Lawler:
Below is a table showing some selected operating statistics for nine large, publicly-traded home builders for the quarter ended June 30, 2015.
As the table indicates, reported net home orders for these nine home builders in the quarter ended June 30, 2015 were up 13.7% from the comparable quarter of 2014. There are a few things worth noting. First, while Standard Pacific’s reported net home orders for the latest quarter exclude orders associated with the acquisition of a small Austin builder last June, both Horton’s orders and Meritage’s orders include orders associated with acquisitions of builders subsequent to the beginning of the second quarter of 2014. My “best guess” is that net home orders for these nine builders last quarter excluding the impact of such acquisitions were up about 12.5% from the comparable quarter of 2014.
On July 24th Census, in its “New Residential Sales” report for June, estimated that new home sales ran at a seasonally adjusted annual rate of 482,000, well below the “consensus” forecast. In addition, Census revised downward its estimate for home sales for each of the previous three months. For the second quarter as a whole Census estimated that new home sales were up 19% (not seasonally adjusted) from the comparable quarter of 2014 – well above the YOY gain the nine large builders shown above.
Of course, there are several reasons why net home orders for these nine builders do not always track Census’ estimate of new home sales. First, Census treats sales cancellations different than do builders. Second, the geographic “footprint” of these nine builders does not match that of the US as a whole. Third, the market share of these builders can change significantly. And finally, there may be timing differences between when a builder “books” a sale and when a sale is recorded in Census’ Survey of Construction.
Nevertheless, reported home orders from publicly-treaded builders not only “confirm” that new home sales last quarter were below “consensus” forecasts, but also suggest that Census may revise downward its estimate for second-quarter new home sales in the July “New Residential Sales” report.
| Net Orders | Settlements | Average Closing Price ($000s) | |||||||
|---|---|---|---|---|---|---|---|---|---|
| Qtr. Ended: | 6/15 | 6/14 | % Chg | 6/15 | 6/14 | % Chg | 6/15 | 6/14 | % Chg |
| D.R. Horton | 10,398 | 8,591 | 21.0% | 9,856 | 7,676 | 28.4% | 290 | 272 | 6.5% |
| Pulte Group | 5,118 | 4,778 | 7.1% | 3,744 | 3,798 | -1.4% | 332 | 328 | 1.2% |
| NVR | 3,796 | 3,415 | 11.2% | 3,175 | 2,943 | 7.9% | 384 | 368 | 4.4% |
| The Ryland Group | 2,387 | 2,228 | 7.1% | 1,814 | 1,700 | 6.7% | 351 | 333 | 5.4% |
| Beazer Homes | 1,524 | 1,290 | 18.1% | 1,293 | 1,241 | 4.2% | 410 | 372 | 10.2% |
| Standard Pacific | 1,567 | 1,425 | 10.0% | 1,305 | 1,236 | 5.6% | 532 | 479 | 11.1% |
| Meritage Homes | 1,986 | 1,647 | 20.6% | 1,556 | 1,368 | 13.7% | 380 | 368 | 3.3% |
| MDC Holdings | 1,481 | 1,419 | 4.4% | 1,126 | 1,158 | -2.8% | 410 | 372 | 10.2% |
| M/I Homes | 1,100 | 1,016 | 8.3% | 919 | 894 | 2.8% | 340 | 306 | 11.1% |
| Total | 29,357 | 25,809 | 13.7% | 24,788 | 22,014 | 12.6% | $345 | $329 | 4.7% |
Goldman: "What's Keeping the Kids at Their Parents' Homes?"
by Calculated Risk on 8/04/2015 12:05:00 PM
A few excerpts from a research note by Goldman Sachs economists David Mericle and Karen Reichgott: What's Keeping the Kids at Their Parents' Homes?
The share of 18-34 year-olds living with their parents rose about four percentage points (pp) during the recession and its aftermath, resulting in a few million extra "kids in the basement." This group accounts for the bulk of the recent shortfall in household formation and represents a potentially large pool of pent-up demand for homebuilding. While the share of young people living with their parents began to decline in 2014, the decline has stalled over the last six months ...
To what extent do current labor market conditions explain the elevated rate of young people living with their parents? ... We find that this current labor force status "composition effect" accounts for about 1.3pp, or roughly one-third of the "excess" kids living with their parents.
...
What accounts for the rest? Part of the explanation is likely that the legacy of the recession wears off only gradually ...
Three other factors might also have played a role. First, researchers at the New York Fed and the Fed Board have found evidence that rising student debt and poor credit scores have contributed to the elevated share of young people living with their parents. Second, the median age at first marriage has increased at a faster than usual rate since 2007 ... Third ... rent-to-income ratios are at historic highs, especially for young people. The future trajectory of these three factors is less clear, suggesting that the share of 18-34 year-olds living at home might not fully return to pre-recession rates.
...
What are the implications for the long-run homebuilding outlook? The pool of "excess" young people living at home is so large that even if only two-thirds ever move out and even if this process takes another decade, trend household formation would likely fall near the upper end of our 1.2-1.3mn forecast range. Combined with a 300k annual rate of demolitions, such a scenario would imply a trend demand for new housing units of about 1.6mn per year, well above the current sub-1.2mn run rate of housing starts. As a result, we continue to see plenty of upside for residential investment.
CoreLogic: House Prices up 6.5% Year-over-year in June
by Calculated Risk on 8/04/2015 09:11:00 AM
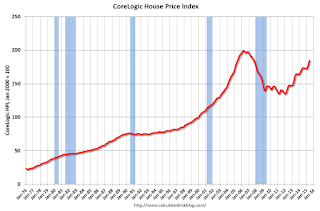
Notes: This CoreLogic House Price Index report is for June. The recent Case-Shiller index release was for May. The CoreLogic HPI is a three month weighted average and is not seasonally adjusted (NSA).
From CoreLogic: CoreLogic Reports National Home Prices Rose by 6.5 Percent Year Over Year in June 2015
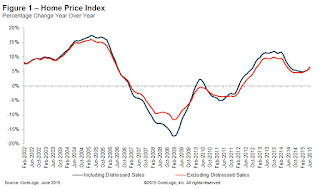
CoreLogic® ... today released its June 2015 CoreLogic Home Price Index (HPI®) which shows that home prices nationwide, including distressed sales, increased by 6.5 percent in June 2015 compared with June 2014. This change represents 40 months of consecutive year-over-year increases in home prices nationally. On a month-over-month basis, home prices nationwide, including distressed sales, increased by 1.7 percent in June 2015 compared with May 2015.
Including distressed sales, 35 states and the District of Columbia were at or within 10 percent of their peak prices in June 2015. Fifteen states and the District of Columbia reached new price peaks—Alaska, Arkansas, Colorado, Hawaii, Iowa, Kentucky, Nebraska, New York, North Carolina, North Dakota, Oklahoma, South Dakota, Tennessee, Texas and Wyoming. The CoreLogic HPI begins in January 1976.
Excluding distressed sales, home prices increased by 6.4 percent in June 2015 compared with June 2014 and increased by 1.4 percent month over month compared with May 2015. ...
emphasis added
 Click on graph for larger image.
 This graph shows the national CoreLogic HPI data since 1976. January 2000 = 100.
The index was up 1.7% in June (NSA), and is up 6.5% over the last year.
This index is not seasonally adjusted, and this was a solid month-to-month increase.
 The second graph is from CoreLogic. The year-over-year comparison has been positive for forty consecutive months.
The YoY increase had been moving sideways over most of the last year, but has picked up a little recently.
Monday, August 03, 2015
Fed Survey: Banks reports stronger demand for Home-purchase loans and CRE Loans
by Calculated Risk on 8/03/2015 05:42:00 PM
From the Federal Reserve: The July 2015 Senior Loan Officer Opinion Survey on Bank Lending Practices
Regarding loans to businesses, the July survey results indicated that, on balance, banks reported little change in their standards on commercial and industrial (C&I) loans in the second quarter of 2015. In addition, banks reported having eased some loan terms, such as spreads and covenants, especially for larger firms on net. Meanwhile, survey respondents also reported that standards on commercial real estate (CRE) loans remained unchanged on balance. On the demand side, modest to moderate net fractions of banks indicated having experienced stronger demand for C&I and CRE loans during the second quarter.
Regarding loans to households, banks reported having eased lending standards for a number of categories of residential mortgage loans over the past three months on net. Most banks reported no change in standards and terms on consumer loans. On the demand side, moderate to large net fractions of banks reported stronger demand across most categories of home-purchase loans. Similarly, respondents experienced stronger demand for auto and credit card loans on net.
emphasis added
 Click on graph for larger image.
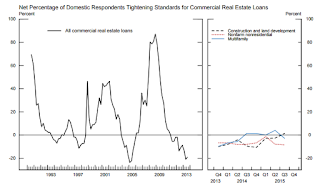
Here are some charts from the Fed.
This graph shows the change in lending standards and for CRE (commercial real estate) loans.
Mostly standards were unchanged for various categories of CRE (right half of graph).
The second graph shows the change in demand for CRE loans.
 Banks are seeing a pickup in demand for all categories of CRE - including multi-family.
This suggests that we will see further increases in commercial real estate development.
Also the banks are easing credit a little for residential mortgages (see graph on page 3).
U.S. Light Vehicle Sales increased to 17.5 million annual rate in July
by Calculated Risk on 8/03/2015 02:13:00 PM
Based on a WardsAuto estimate, light vehicle sales were at a 17.5 million SAAR in June. That is up 6.4% from July 2014, and up 3.3% from the 17.0 million annual sales rate last month.
Click on graph for larger image.
This graph shows the historical light vehicle sales from the BEA (blue) and an estimate for July (red, light vehicle sales of 17.5 million SAAR from WardsAuto).
This was above to the consensus forecast of 17.2 million SAAR (seasonally adjusted annual rate).
The second graph shows light vehicle sales since the BEA started keeping data in 1967.

This was another strong month for auto sales. It appears 2015 will be the best year for light vehicle sales since 2001.
Construction Spending increased 0.1% in June
by Calculated Risk on 8/03/2015 10:16:00 AM
The Census Bureau reported that overall construction spending increased slightly in June:
The U.S. Census Bureau of the Department of Commerce announced today that construction spending during June 2015 was estimated at a seasonally adjusted annual rate of $1,064.6 billion, 0.1 percent above the revised May estimate of $1,063.5 billion. The June figure is 12.0 percent above the June 2014 estimate of $950.3 billion.Private spending decreased and public spending increased:
Spending on private construction was at a seasonally adjusted annual rate of $766.4 billion, 0.5 percent below the revised May estimate of $770.0 billion ...Note: Non-residential for offices and hotels is generally increasing, but spending for oil and gas has been declining. Early in the recovery, there was a surge in non-residential spending for oil and gas (because oil prices increased), but now, with falling prices, oil and gas is a drag on overall construction spending.
In June, the estimated seasonally adjusted annual rate of public construction spending was $298.2 billion, 1.6 percent above the revised May estimate of $293.5 billion.
emphasis added
As an example, construction spending for private lodging is up 42% year-over-year, whereas spending for power (includes oil and gas) construction peaked in mid-2014 and is down 16% year-over-year.
 Click on graph for larger image.
This graph shows private residential and nonresidential construction spending, and public spending, since 1993. Note: nominal dollars, not inflation adjusted.
Private residential spending has been increasing recently, and is 45% below the bubble peak.
Non-residential spending is only 5% below the peak in January 2008 (nominal dollars).
Public construction spending is now 8% below the peak in March 2009 and about 13% above the post-recession low.
 The second graph shows the year-over-year change in construction spending.
On a year-over-year basis, private residential construction spending is up 13%. Non-residential spending is up 15% year-over-year. Public spending is up 8% year-over-year.
Looking forward, all categories of construction spending should increase in 2015. Residential spending is still very low, non-residential is starting to pickup (except oil and gas), and public spending has also increasing after several years of austerity.
This was below the consensus forecast of a 0.6% increase, however spending for April and May was revised up significantly. Overall, a solid report.
ISM Manufacturing index decreased to 52.7 in July
by Calculated Risk on 8/03/2015 09:44:00 AM
Note: This was released early.
The ISM manufacturing index suggested expansion in July. The PMI was at 52.7% in July, down from 53.5% in June. The employment index was at 52.7%, down from 55.5% in June, and the new orders index was at 56.5%, up from 56.0%.
From the Institute for Supply Management: July 2015 Manufacturing ISM® Report On Business®
Economic activity in the manufacturing sector expanded in July for the 31st consecutive month, and the overall economy grew for the 74th consecutive month, say the nation’s supply executives in the latest Manufacturing ISM® Report On Business®.
The report was issued today by Bradley J. Holcomb, CPSM, CPSD, chair of the Institute for Supply Management® (ISM®) Manufacturing Business Survey Committee. "The July PMI® registered 52.7 percent, a decrease of 0.8 percentage point below the June reading of 53.5 percent. The New Orders Index registered 56.5 percent, an increase of 0.5 percentage point from the reading of 56 percent in June. The Production Index registered 56 percent, 2 percentage points above the June reading of 54 percent. The Employment Index registered 52.7 percent, 2.8 percentage points below the June reading of 55.5 percent, reflecting growing employment levels from June but at a slower rate. Inventories of raw materials registered 49.5 percent, a decrease of 3.5 percentage points from the June reading of 53 percent. The Prices Index registered 44 percent, down 5.5 percentage points from the June reading of 49.5 percent, indicating lower raw materials prices for the ninth consecutive month. Comments from the panel reflect a combination of optimism mixed with uncertainties about international markets and the impacts of the continuing decline in oil prices."
emphasis added
 Click on graph for larger image.
Here is a long term graph of the ISM manufacturing index.
This was below expectations of 53.7%, and indicates slower manufacturing expansion in July.
BEA: Personal Income increased 0.4% in June, Core PCE prices up 1.3% year-over-year
by Calculated Risk on 8/03/2015 08:36:00 AM
From the BEA, the Personal Income and Outlays report for June:
Personal income increased $68.1 billion, or 0.4 percent ... in June, according to the Bureau of Economic Analysis.On inflation: the PCE price index was up 0.3% year-over-year (the decline in oil prices pushed down the headline price index). However core PCE is only up 1.3% year-over-year - still way below the Fed's target.
...
Real PCE -- PCE adjusted to remove price changes -- decreased less than 0.1 percent in June, in contrast to an increase of 0.4 percent in May. ... The price index for PCE increased 0.2 percent in June, compared with an increase of 0.3 percent in May. The PCE price index, excluding food and energy, increased 0.1 percent in June, the same increase as in May.
The June price index for PCE increased 0.3 percent from June a year ago. The June PCE price index, excluding food and energy, increased 1.3 percent from June a year ago.
Sunday, August 02, 2015
Monday: Auto Sales, ISM Mfg Index, Construction Spending, Personal Income and Outlays
by Calculated Risk on 8/02/2015 08:53:00 PM
Weekend:
• Schedule for Week of August 2, 2015
Monday:
• At 8:30 AM, Personal Income and Outlays for June. The consensus is for a 0.3% increase in personal income, and for a 0.2% increase in personal spending. And for the Core PCE price index to increase 0.1%.
• At 10:00 AM, ISM Manufacturing Index for July. The consensus is for the ISM to be at 53.7, up from 53.5 in June. The ISM manufacturing index indicated expansion at 53.5% in June. The employment index was at 55.5%, and the new orders index was at 56.0%.
• Also at 10:00 AM, Construction Spending for June. The consensus is for a 0.6% increase in construction spending.
• All day: Light vehicle sales for July. The consensus is for light vehicle sales to increase to 17.2 million SAAR in July from 17.1 million in June (Seasonally Adjusted Annual Rate).
From CNBC: Pre-Market Data and Bloomberg futures: currently S&P futures are up slightly and DOW futures are up 20 (fair value).
Oil prices were down over the last week with WTI futures at $46.84 per barrel and Brent at $51.81 per barrel. A year ago, WTI was at $105, and Brent was at $106 - so prices are down over 50% year-over-year.
Here is a graph from Gasbuddy.com for nationwide gasoline prices. Nationally prices are at $2.65 per gallon (down about $0.85 per gallon from a year ago).
Hotels: Best Week Ever, On Pace for Record Occupancy in 2015
by Calculated Risk on 8/02/2015 11:14:00 AM
From HotelNewsNow.com: STR: US hotel results for week ending 25 July
The U.S. hotel industry recorded positive results in the three key performance measurements during the week of 19-25 July 2015, according to data from STR, Inc.The 79.1% occupancy rate reported for last week was the best week on record (the four week average will peak in August).
In year-over-year measurements, the industry’s occupancy increased 1.5% to 79.1%. Average daily rate for the week was up 5.1% to US$125.04. Revenue per available room increased 6.6% to finish the week at US$98.91.
emphasis added
For the same week in 2009, ADR (average daily rate) was $98.13 and RevPAR (Revenue per available room) was $65.77. ADR is up 25% since July 2009, and RevPAR is up 50%!
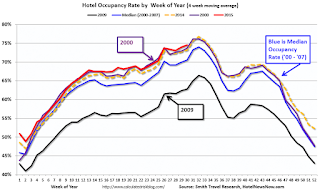
The following graph shows the seasonal pattern for the hotel occupancy rate using the four week average. The occupancy rate will be high during the summer travel season.
 The red line is for 2015, dashed orange is 2014, blue is the median, and black is for 2009 - the worst year since the Great Depression for hotels. Purple is for 2000.
The 4-week average of the occupancy rate is solidly above the median for 2000-2007, and above last year.
Right now 2015 is above 2000 (best year for hotels), and 2015 will probably be the best year ever for hotels.
Late July is usually the best time of the year for hotels - although the four week average usually peaks in August. A very strong year, and a key reason new hotel construction has picked up.
Data Source: Smith Travel Research, Courtesy of HotelNewsNow.com


