by Calculated Risk on 5/16/2015 09:20:00 PM
Saturday, May 16, 2015
An update on oil prices
Demand for gasoline has picked up significantly recently. In February, U.S. vehicle miles driven hit a new all time high. Gasoline prices have increased too (although some of the increase was due to refinery problems).
From the LA Times: Four-dollar gasoline returns to the L.A. area
On Friday, the average for a gallon of regular in the Los Angeles area was higher than $4 for the first time since July, according to daily fuel price reports by AAA and GasBuddy.com. The recent surge in regional fuel prices has left local drivers paying more on average than motorists anywhere else in the U.S.
Analysts attributed the rise to a supply pinch caused by problems at the state's refineries, and predicted relief may not arrive in time for Memorial Day weekend road trips.
 Click on graph for larger image
This graph shows WTI and Brent spot oil prices from the EIA. (Prices Friday added). According to Bloomberg, WTI was at $59.69 per barrel on Friday, and Brent at $66.81
Prices have increased sharply off the recent bottom, but are still down 40%+ year-over-year.
Schedule for Week of May 17, 2015
by Calculated Risk on 5/16/2015 08:55:00 AM
The key economic reports this week are April Housing Starts on Tuesday and April Existing on Sales on Thursday.
For manufacturing, the April Philly and Kansas City Fed surveys will be released this week.
For prices, April CPI will be released on Friday.
Also on Friday, Fed Chair Janet Yellen will speak on the U.S. economic outlook.
10:00 AM: The May NAHB homebuilder survey. The consensus is for a reading of 57, up from 56 last month. Any number above 50 indicates that more builders view sales conditions as good than poor.
 8:30 AM: Housing Starts for April.
 Total housing starts increased to 926 thousand (SAAR) in March. Single family starts increased to 618 thousand SAAR in March.
The consensus is for total housing starts to increase to 1.029 million (SAAR) in April.
7:00 AM: The Mortgage Bankers Association (MBA) will release the results for the mortgage purchase applications index.
During the day: The AIA's Architecture Billings Index for April (a leading indicator for commercial real estate).
2:00 PM: the Fed will release the FOMC Minutes for the Meeting of April 28-29, 2015.
8:30 AM: The initial weekly unemployment claims report will be released. The consensus is for claims to increase to 270 thousand from 264 thousand.
8:30 AM ET: Chicago Fed National Activity Index for April. This is a composite index of other data.
10:00 AM: the Philly Fed manufacturing survey for May. The consensus is for a reading of 8.0, up from 7.5 last month (above zero indicates expansion).
 10:00 AM: Existing Home Sales for April from the National Association of Realtors (NAR).
 The consensus is for sales of 5.22 million on seasonally adjusted annual rate (SAAR) basis. Sales in March were at a 5.19 million SAAR. Economist Tom Lawler estimates the NAR will report sales of 5.20 million SAAR.
A key will be the reported year-over-year change in inventory of homes for sale.
11:00 AM: the Kansas City Fed manufacturing survey for May.
1:30 PM: Speech by Fed Vice Chairman Stanley Fischer, Past, Present, and Future Challenges for the Euro Area, At the ECB Forum on Central Banking, Linho Sintra, Portugal
8:30 AM: The Consumer Price Index for April from the BLS. The consensus is for a 0.1% increase in prices, and a 0.1% increase in core CPI.
1:00 PM: Speech by Fed Chair Janet L. Yellen, U.S. Economic Outlook, At the Greater Providence Chamber of Commerce Economic Outlook Luncheon, Providence, Rhode Island
Friday, May 15, 2015
Lawler: Preliminary Table of Distressed Sales and Cash buyers for Selected Cities in April
by Calculated Risk on 5/15/2015 06:27:00 PM
Economist Tom Lawler sent me the preliminary table below of short sales, foreclosures and cash buyers for a few selected cities in April.
On distressed: Total "distressed" share is down in most of these markets mostly due to a decline in short sales (Mid-Atlantic is up year-over-year because of an increase in foreclosures in Baltimore).
Short sales are down in these areas.
The All Cash Share (last two columns) is declining year-over-year. As investors pull back, the share of all cash buyers will probably continue to decline.
From Lawler: Note: The Baltimore Metro area is included in the overall Mid-Atlantic region (covered by MRIS). I am showing it separately because a large portion of the YOY increase in the foreclosure share of home sales in the Mid-Atlantic region was attributable to the almost 85% YOY increase in foreclosure sales in the Baltimore Metro area.
| Short Sales Share | Foreclosure Sales Share | Total "Distressed" Share | All Cash Share | |||||
|---|---|---|---|---|---|---|---|---|
| Apr-15 | Apr-14 | Apr-15 | Apr-14 | Apr-15 | Apr-14 | Apr-15 | Apr-14 | |
| Las Vegas | 7.2% | 12.4% | 8.3% | 11.4% | 15.5% | 23.8% | 30.4% | 41.4% |
| Reno** | 6.0% | 15.0% | 5.0% | 6.0% | 11.0% | 21.0% | ||
| Phoenix | 2.5% | 4.0% | 3.8% | 6.5% | 6.3% | 10.5% | 25.3% | 32.2% |
| Minneapolis | 2.9% | 5.1% | 9.2% | 16.0% | 12.0% | 21.1% | ||
| Mid-Atlantic | 4.5% | 5.9% | 12.9% | 10.0% | 17.3% | 15.9% | 17.2% | 19.5% |
| Baltimore Metro | 4.3% | 5.8% | 20.7% | 13.8% | 25.0% | 19.6% | ||
| Orlando | 4.8% | 9.1% | 24.7% | 23.7% | 29.5% | 32.8% | 37.4% | 42.4% |
| Chicago (city) | 20.3% | 27.3% | ||||||
| Hampton Roads | 22.2% | 24.4% | ||||||
| Chicago (city) | 20.3% | 27.3% | ||||||
| Northeast Florida | 28.9% | 38.0% | ||||||
| Toledo | 30.2% | 33.4% | ||||||
| Tucson | 27.1% | 30.5% | ||||||
| Des Moines | 13.8% | 17.1% | ||||||
| Peoria | 17.3% | 21.2% | ||||||
| Georgia*** | 21.6% | 34.3% | ||||||
| Omaha | 16.4% | 19.7% | ||||||
| Richmond VA MSA | 11.5% | 15.4% | 18.2% | 22.5% | ||||
| Memphis | 16.1% | 17.3% | ||||||
| Springfield IL** | 10.3% | 13.2% | 17.9% | N/A | ||||
| *share of existing home sales, based on property records **Single Family Only ***GAMLS | ||||||||
Hotels: On Pace for Record Occupancy in 2015
by Calculated Risk on 5/15/2015 03:51:00 PM
From HotelNewsNow.com: STR: US hotel results for week ending 9 May
The U.S. hotel industry recorded positive results in the three key performance measurements during the week of 3-9 May 2015, according to data from STR, Inc.Note: ADR: Average Daily Rate, RevPAR: Revenue per Available Room.
In year-over-year measurements, the industry’s occupancy increased 1.3 percent to 67.0 percent. Average daily rate increased 4.8 percent to finish the week at US$120.59. Revenue per available room for the week was up 6.1 percent to finish at US$80.85.
emphasis added
The following graph shows the seasonal pattern for the hotel occupancy rate using the four week average.
Hotels are now in the Spring travel period and business travel is solid.
 Click on graph for larger image.
The red line is for 2015, dashed orange is 2014, blue is the median, and black is for 2009 - the worst year since the Great Depression for hotels. Purple is for 2000.
The 4-week average of the occupancy rate is solidly above the median for 2000-2007, and solidly above last year.
Right now 2015 is even above 2000 (best year for hotels) - and 2015 will probably be the best year on record for hotels. Note the solid gains for RevPAR too.
Data Source: Smith Travel Research, Courtesy of HotelNewsNow.com
Lawler: Early Read on Existing Home Sales in April
by Calculated Risk on 5/15/2015 12:47:00 PM
From housing economist Tom Lawler:
Based on available local realtor association/MLS reports from across the country, I estimate that US existing home sales as measured by the National Association of Realtors ran at a seasonally adjusted annual rate of 5.20 million in April, up 0.2% from March’s pace and up 9.5% from last April’s seasonally-adjusted pace.
On the inventory front, local realtor/MLS reports suggest that the monthly gain in the inventory of existing homes for sale last month was smaller than last April’s huge jump, and I project that the NAR’s existing home inventory estimate for April will be 2.23 million, up 11.5% from March but unchanged from last April. I should point out that the NAR’s inventory estimate for April has for many years showed a larger monthly gain – and the May estimate a smaller gain/larger decline – than local realtor/MLS reports would suggest. I’m not sure why, but the differences may reflect different “pull dates” for the publicly-released reports relative to the “NAR” reports realtor associations/MLS send to the NAR.
Finally, local realtor/MLS reports suggest that the median single-family home sales price for April as estimated by the NAR was up about 8.5% from last April.
CR Note: The NAR is scheduled to release April existing home sales on Thursday, May 21st.
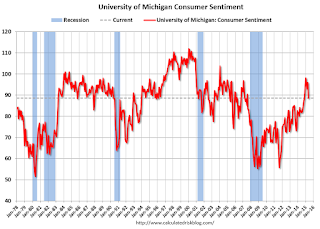
Preliminary May Consumer Sentiment declines to 88.6
by Calculated Risk on 5/15/2015 10:03:00 AM
Fed: Industrial Production decreased 0.3% in April
by Calculated Risk on 5/15/2015 09:23:00 AM
From the Fed: Industrial production and Capacity Utilization
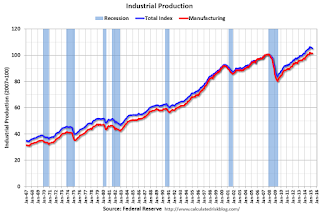
Industrial production decreased 0.3 percent in April for its fifth consecutive monthly loss. Manufacturing output was unchanged in April after recording an upwardly revised gain of 0.3 percent in March. In April, the index for mining moved down 0.8 percent, its fourth consecutive monthly decrease; a sharp fall in oil and gas well drilling has more than accounted for the overall decline in mining this year. The output of utilities fell 1.3 percent in April. At 105.2 percent of its 2007 average, total industrial production in April was 1.9 percent above its year-earlier level. Capacity utilization for the industrial sector decreased 0.4 percentage point in April to 78.2 percent, a rate that is 1.9 percentage points below its long-run (1972–2014) average.
emphasis added
 Click on graph for larger image.
This graph shows Capacity Utilization. This series is up 11.3 percentage points from the record low set in June 2009 (the series starts in 1967).
Capacity utilization at 78.2% is 1.9% below the average from 1972 to 2012 and below the pre-recession level of 80.8% in December 2007.
Note: y-axis doesn't start at zero to better show the change.
 The second graph shows industrial production since 1967.
Industrial production decreased 0.3% in April to 105.2. This is 25.6% above the recession low, and 4.4% above the pre-recession peak.
This was below expectations of no change, although March was revised up - and much of the decline over the last few months was due to the "a sharp fall in oil and gas well drilling".
Thursday, May 14, 2015
Friday: Industrial Production, Empire State Mfg, Consumer Sentiment
by Calculated Risk on 5/14/2015 06:43:00 PM
From Professor Tim Duy: Get Used To It
Bottom Line: We probably need to get used to the occasional negative GDP growth numbers in the context of overall expansion for the US economy. The concept of "stall speed" will need to be revised accordingly.Yes, due to demographics, 2% GDP growth is the new 4%.
Friday:
• At 8:30 AM ET, the NY Fed Empire State Manufacturing Survey for May. The consensus is for a reading of 5.0, up from -1.2 last month (above zero is expansion).
• At 9:15 AM, the The Fed will release Industrial Production and Capacity Utilization for April. The consensus is for no change in Industrial Production, and for Capacity Utilization to be unchanged at 78.4%.
At 10:00 AM, the University of Michigan's Consumer sentiment index (preliminary for May). The consensus is for a reading of 95.8, down from 95.9 in April.
Weekly Initial Unemployment Claims as a Percent of Labor Force
by Calculated Risk on 5/14/2015 03:21:00 PM
Earlier I mentioned that the 4-week moving average of weekly claims was the lowest since April 2000. And if the average falls just a little further, the average will be the lowest in over 40 years.
Of course that doesn't take into account the size of the labor force.
The following graph shows the 4-week moving average of weekly claims since 1967 as a percent of the labor force.
Click on graph for larger image.
As a percent of the labor force, weekly claims are at an all time record low.
Note: There is a general downward slope to weekly claims - interrupted by periods of recession. The downward slope is probably related to changes in hiring practices - such as background checks and drug tests, and maybe better planning.
CoStar: Commercial Real Estate prices increased in March
by Calculated Risk on 5/14/2015 01:11:00 PM
Here is a price index for commercial real estate that I follow.
From CoStar: Property Prices Surge Upward In the First Quarter Of 2015
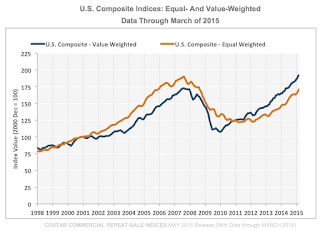
OMPOSITE PRICE INDICES CONTINUED TO RISE IN THE FIRST QUARTER OF 2015. ... The value-weighted U.S. Composite Index, which is influenced by high-quality assets in core markets, advanced by 4.7% in the first quarter of 2015 and is now 11% above the previous peak in 2007. The equal-weighted U.S. Composite Index, which weighs each transaction equally and therefore reflects the impact from more numerous smaller deals, rose 4.8% in the first quarter of 2015, although it remains 10% below its previous peak level.
ALL MAJOR PROPERTY TYPE AND REGIONAL INDICES ADVANCED AT DOUBLE- DIGIT ANNUAL RATES THROUGH MARCH 2015. As the CRE recovery extended to more markets and property types, all major property types and regional sectors posted double-digit annual gains through March 2015. The Multifamily Index has already fully recovered, eclipsing its previous peak, while the Retail and Industrial Indices advanced to within 10% of their previous peak levels and the Office Index remained 15% below its previous high-water mark in 2007. Among CCRSI’s regional indices, strong investor demand in core coastal metros propelled the Northeast Composite Index 6.1% above its prior peak, while the West Composite Index moved to within 8.4% of its prior peak in March 2015.
emphasis added
 Click on graph for larger image.
This graph from CoStar shows the the value-weighted U.S. Composite Index and the equal-weighted U.S. Composite Index indexes.
The value weighted index is at a record high, but the equal weighted is still 10.0% below the pre-recession peak.
There are indexes by sector and region too.
 The second graph shows the percent of distressed "pairs".
The distressed share is down from over 35% at the peak, but still a little elevated.
Note: These are repeat sales indexes - like Case-Shiller for residential - but this is based on far fewer pairs.


