 RSS Feed
 by Calculated Risk on 4/24/2015 06:34:00 PM
Friday, April 24, 2015
DOT: Vehicle Miles Driven increased 2.8% year-over-year in February, Rolling 12 Months at All Time High
Note: With lower gasoline prices, vehicle miles driven have reached a new high on a rolling 12 month basis.
The Department of Transportation (DOT) reported:
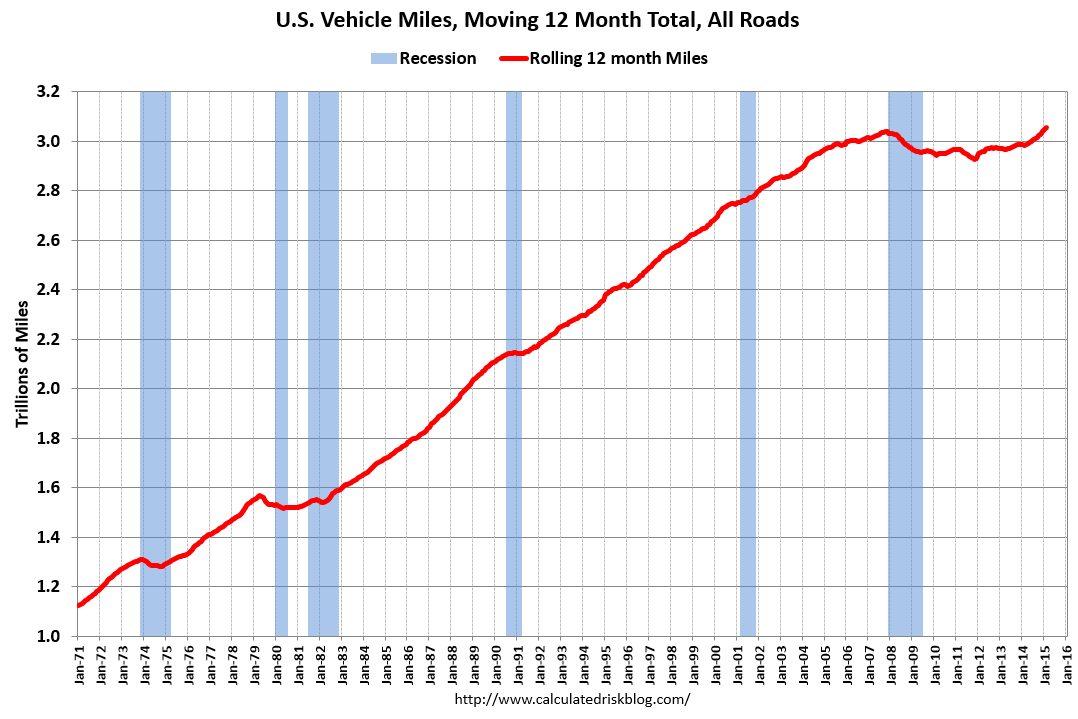
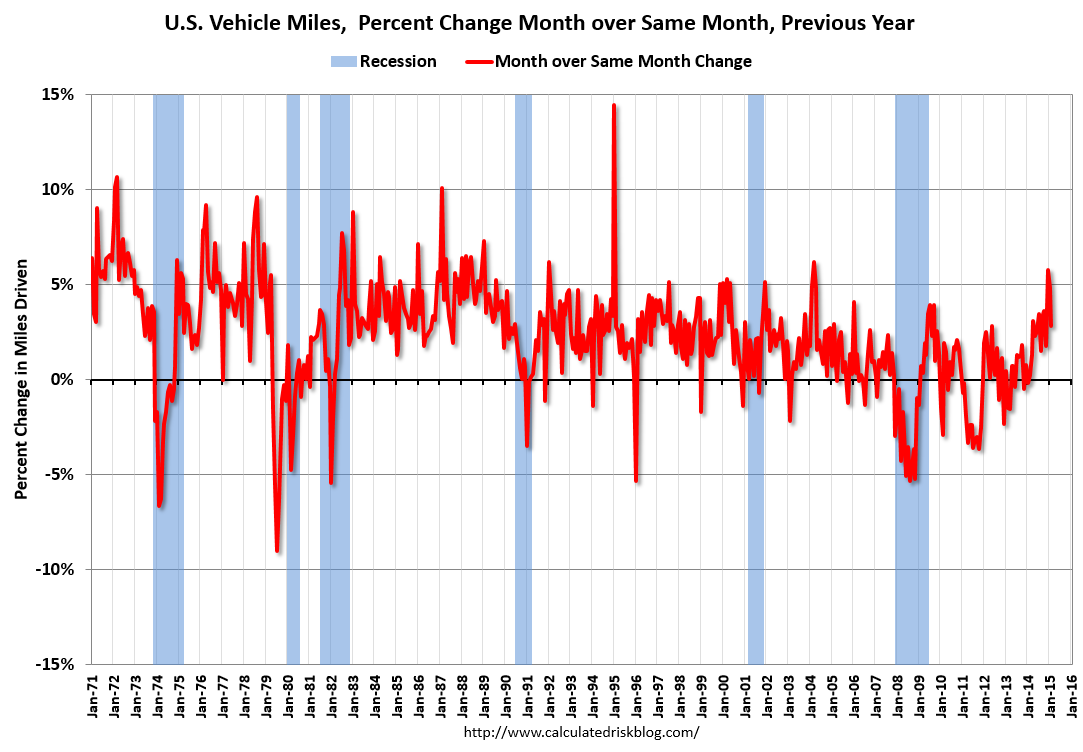
Travel on all roads and streets changed by 2.8% (6.1 billion vehicle miles) for February 2015 as compared with February 2014.The following graph shows the rolling 12 month total vehicle miles driven to remove the seasonal factors.
Travel for the month is estimated to be 221.1 billion vehicle miles
The seasonally adjusted vehicle miles traveled for February 2015 is 254.1 billion miles, a 2.6% (6.4 billion vehicle miles) increase over February 2014. It also represents a -1.2% change (-3.2 billion vehicle miles) compared with January 2015.
The rolling 12 month total is moving up, after moving sideways for several years.
 Click on graph for larger image.
In the early '80s, miles driven (rolling 12 months) stayed below the previous peak for 39 months.
Miles driven (rolling 12) had been below the previous peak for 85 months - an all time record - before reaching a new high for miles driven in January (and again in February).
The second graph shows the year-over-year change from the same month in the previous year.
 In February 2015, gasoline averaged of $2.30 per gallon according to the EIA. That was down significantly from January 2014 when prices averaged $3.43 per gallon.
 However gasoline prices are just part of the story. The lack of growth in miles driven over the last 7 years was probably also due to the lingering effects of the great recession (lack of wage growth), the aging of the overall population (over 55 drivers drive fewer miles) and changing driving habits of young drivers.
Now, miles driven - on a rolling 12 month basis - is at a new high.


