by Calculated Risk on 1/30/2015 05:47:00 PM
Friday, January 30, 2015
Restaurant Performance Index shows Expansion in December
I think restaurants are happy with lower gasoline prices (except, I hear, McDonald's) ...
Here is a minor indicator I follow from the National Restaurant Association: Restaurant Performance Index Finished the Year on a Positive Note
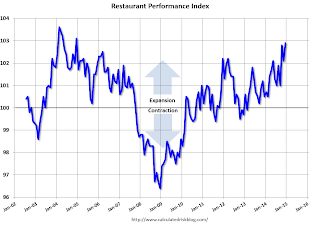
Driven by positive sales and traffic and an uptick in capital expenditures, the National Restaurant Association’s Restaurant Performance Index (RPI) finished 2014 with a solid gain. The RPI – a monthly composite index that tracks the health of and outlook for the U.S. restaurant industry – stood at 102.9 in December, up 0.8 percent from its November level of 102.1. In addition, December marked the 22nd consecutive month in which the RPI stood above 100, which signifies expansion in the index of key industry indicators.
“Growth in the RPI was driven by the current situation indicators in December, with a solid majority of restaurant operators reporting higher same-store sales and customer traffic levels,” said Hudson Riehle, senior vice president of the Research and Knowledge Group for the Association. “In addition, six in 10 operators reported making a capital expenditure during the fourth quarter, with a similar proportion planning for capital spending in the first half of 2015.”
“Overall, the RPI posted three consecutive months above 102 for the first time since the first quarter of 2006, which puts the industry on a positive track heading into 2015,” Riehle added.
emphasis added
 Click on graph for larger image.
The index increased to 102.9 in December, down from 102.1 in November. (above 100 indicates expansion).
Restaurant spending is discretionary, so even though this is "D-list" data, I like to check it every month. This is a very solid reading - and it is likely restaurants are benefiting from lower gasoline prices.
Freddie Mac: Mortgage Serious Delinquency rate declined in December
by Calculated Risk on 1/30/2015 02:31:00 PM
Freddie Mac reported that the Single-Family serious delinquency rate declined in December to 1.88%, down from 1.91% in November. Freddie's rate is down from 2.39% in December 2013, and the rate in December was the lowest level since December 2008. Freddie's serious delinquency rate peaked in February 2010 at 4.20%.
These are mortgage loans that are "three monthly payments or more past due or in foreclosure".
Note: Fannie Mae will report their Single-Family Serious Delinquency rate for December next week.

Although the rate is generally declining, the "normal" serious delinquency rate is under 1%.
The serious delinquency rate has fallen 0.51 percentage points over the last year - and the rate of improvement has slowed recently - but at that rate of improvement, the serious delinquency rate will not be below 1% until late 2016.
Note: Very few seriously delinquent loans cure with the owner making up back payments - most of the reduction in the serious delinquency rate is from foreclosures, short sales, and modifications.
So even though distressed sales are declining, I expect an above normal level of Fannie and Freddie distressed sales for 2+ more years (mostly in judicial foreclosure states).
Comment on Q4 GDP and Investment: R-E-L-A-X
by Calculated Risk on 1/30/2015 12:08:00 PM
There are legitimate concerns about a strong dollar, and weak economic activity overseas, impacting U.S. exports and GDP growth. However, overall, the Q4 GDP report was solid.
The key numbers are: 1) PCE increased at a 4.3% annual rate in Q4 (the two month method nails it again), and 2) private fixed investment increased at a 2.3% rate. The negatives were trade (subtracted 1.02 percentage point) and Federal government spending (subtracted 0.54 percentage points).
As usual, I like to focus on private fixed investment because that is the key to the business cycle.
The first graph shows the Year-over-year (YoY) change in real GDP, real PCE, and real fixed private investment.
Click on graph for larger image.
It appears the pace of growth for real GDP and PCE has been picking up a little. Real GDP was up 2.5% Q1 over Q1, and real PCE was up 2.8%. Both will show stronger growth next quarter (since Q1 2014 was so weak).
The dashed black line is the year-over-year change in private fixed investment. This slowed a little in Q4, but has been increasing solidly.
The graph below shows the contribution to GDP from residential investment, equipment and software, and nonresidential structures (3 quarter trailing average). This is important to follow because residential investment tends to lead the economy, equipment and software is generally coincident, and nonresidential structure investment trails the economy.
In the graph, red is residential, green is equipment and software, and blue is investment in non-residential structures. So the usual pattern - both into and out of recessions is - red, green, blue.
The dashed gray line is the contribution from the change in private inventories.
Note: This can't be used blindly. Residential investment is so low as a percent of the economy that the small decline early last year was not a concern.

Residential investment (RI) increased at a 4.1% annual rate in Q4. Equipment investment decreased at a 1.9% annual rate, and investment in non-residential structures increased at a 2.6% annual rate. On a 3 quarter trailing average basis, RI is moving up (red), equipment is moving sideways (green), and nonresidential structures dipped a little (blue).
Note: Nonresidential investment in structures typically lags the recovery, however investment in energy and power provided a boost early in this recovery.
I expect investment to be solid going forward (except for energy and power), and for the economy to grow at a solid pace in 2015.
Final January Consumer Sentiment at 98.1
by Calculated Risk on 1/30/2015 10:00:00 AM
Click on graph for larger image.
The final University of Michigan consumer sentiment index for January was at 98.1, down slightly from the preliminary estimate of 98.2, and up from 93.6 in December.
This was close to the consensus forecast of 98.2. Lower gasoline prices and a better labor market are probably the reasons for the recent increase.
BEA: Real GDP increased at 2.6% Annualized Rate in Q4
by Calculated Risk on 1/30/2015 08:30:00 AM
From the BEA: Gross Domestic Product: Fourth Quarter and Annual 2014 (Advance Estimate)
Real gross domestic product -- the value of the production of goods and services in the United States, adjusted for price changes -- increased at an annual rate of 2.6 percent in the fourth quarter of 2014, according to the "advance" estimate released by the Bureau of Economic Analysis. In the third quarter, real GDP increased 5.0 percent.The advance Q4 GDP report, with 2.6% annualized growth, was below expectations of a 3.2% increase.
...
The increase in real GDP in the fourth quarter reflected positive contributions from personal consumption expenditures (PCE), private inventory investment, exports, nonresidential fixed investment, state and local government spending, and residential fixed investment that were partly offset by a negative contribution from federal government spending. Imports, which are a subtraction in the calculation of GDP, increased.
The deceleration in real GDP growth in the fourth quarter primarily reflected an upturn in imports, a downturn in federal government spending, and decelerations in nonresidential fixed investment and in exports that were partly offset by an upturn in private inventory investment and an acceleration in PCE.
The price index for gross domestic purchases, which measures prices paid by U.S. residents, decreased 0.3 percent in the fourth quarter, in contrast to an increase of 1.4 percent in the third. Excluding food and energy prices, the price index for gross domestic purchases increased 0.7 percent, compared with an increase of 1.6 percent.
Personal consumption expenditures (PCE) increased at a 4.3% annualized rate - a strong pace!
The key negatives were trade (subtracted 1.02 percentage point) and Federal government spending (subtracted 0.54 percentage points).
 Click on graph for larger image.
The first graph shows residential investment as a percent of GDP.
Residential Investment as a percent of GDP has been increasing, but it still below the levels of previous recessions - and I expect RI to continue to increase for the next few years.
I'll break down Residential Investment into components after the GDP details are released this coming week. Note: Residential investment (RI) includes new single family structures, multifamily structures, home improvement, broker's commissions, and a few minor categories.
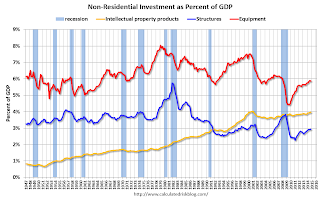
 The second graph shows non-residential investment in structures, equipment and "intellectual property products". Investment is trending up as a percent of GDP..
I'll add details for investment in offices, malls and hotels next week.
Overall this was a solid report with strong PCE and private domestic investment.


