 RSS Feed
 by Calculated Risk on 2/02/2015 07:01:00 AM
Monday, February 02, 2015
Black Knight Mortgage Monitor
Black Knight Financial Services (BKFS) released their Mortgage Monitor report for December today. According to BKFS, 5.64% of mortgages were delinquent in December, down from 6.08% in November. BKFS reported that 1.61% of mortgages were in the foreclosure process, down from 2.48% in December 2013.
This gives a total of 7.25% delinquent or in foreclosure. It breaks down as:
• 1,736,000 properties that are 30 or more days, and less than 90 days past due, but not in foreclosure.
• 1,132,000 properties that are 90 or more days delinquent, but not in foreclosure.
• 820,000 loans in foreclosure process.
For a total of 3,688,000 loans delinquent or in foreclosure in December. This is down from 4,488,000 in December 2013.
There is much more in the mortgage monitor.
Sunday, February 01, 2015
Monday: Personal Income and Outlays, ISM Mfg, Construction Spending
by Calculated Risk on 2/01/2015 08:01:00 PM
Monday:
• At 8:30 AM ET, Personal Income and Outlays for December. The consensus is for a 0.2% increase in personal income, and for a 0.2% decrease in personal spending. And for the Core PCE price index to be unchanged.
• At 10:00 AM, ISM Manufacturing Index for January. The consensus is for a decrease to 54.5 from 55.5 in December. The ISM manufacturing index indicated expansion in December at 55.5%. The employment index was at 56.8%, and the new orders index was at 57.3%
• At 10:00 AM, Construction Spending for December. The consensus is for a 0.6% increase in construction spending.
Weekend:
• Schedule for Week of February 1, 2015
• Demographics and GDP: 2% is the new 4%
From CNBC: Pre-Market Data and Bloomberg futures: currently S&P futures are down 24 and DOW futures are down 225 (fair value).
Oil prices were up over the last week with WTI futures at $48.24 per barrel and Brent at $52.99 per barrel. A year ago, WTI was at $99, and Brent was at $109 - so prices are down about 50% year-over-year.
Below is a graph from Gasbuddy.com for nationwide gasoline prices. Nationally prices are around $2.05 per gallon (down about $1.20 per gallon from a year ago). If you click on "show crude oil prices", the graph displays oil prices for WTI, not Brent; gasoline prices in most of the U.S. are impacted more by Brent prices.
| Orange County Historical Gas Price Charts Provided by GasBuddy.com |
Demographics and GDP: 2% is the new 4%
by Calculated Risk on 2/01/2015 08:11:00 AM
For amusement, I checked out the WSJ opinion page comments on the Q4 GDP report. As usual, the WSJ opinion is pure politics - but it does bring up an excellent point (that the WSJ conveniently ignores).
First, from the WSJ opinion page:
The fourth quarter report means that growth for all of 2014 clocked in at 2.4%, which is the best since 2.5% in 2010. It also means another year, an astonishing ninth in a row, in which the economy did not grow by 3%.This period of low growth isn't "astonishing". First, usually following a recession, there is a brief period of above average growth - but not this time due to the financial crisis and need for households to deleverage. So we didn't see a strong bounce back (sluggish growth was predict on the blog for the first years of the recovery).
And overall, we should have been expecting slower growth this decade due to demographics - even without the housing bubble-bust and financial crisis (that the WSJ opinion page missed).
One simple way to look at the change in GDP is as the change in the labor force, times the change in productivity. If the labor force is growing quickly, GDP will be higher with the same gains in productivity. And the opposite is true.
So here is a graph of the year-over-year change in the labor force since 1950 (data from the BLS).
 Click on graph for larger image
The data is noisy - because of changes in population controls and the business cycle - but the pattern is clear as indicated by the dashed red trend line. The labor force has been growing slowly recently after declining for some time.
We could also look at just the prime working age population - I've pointed out before the that prime working age population has just started growing again after declining for a few years (see Prime Working-Age Population Growing Again)
Now here is a look at GDP for the same period.
 The GDP data (year-over-year quarterly) is also noisy, and the dashed blue line shows the trend.
 GDP was high in the early 50s - and early-to-mid 60s because of government spending (Korean and Vietnam wars). As in example, in 1951, national defense added added 6.5 percentage points to GDP. Of course we don't want another war ...
Now lets put the two graphs together.
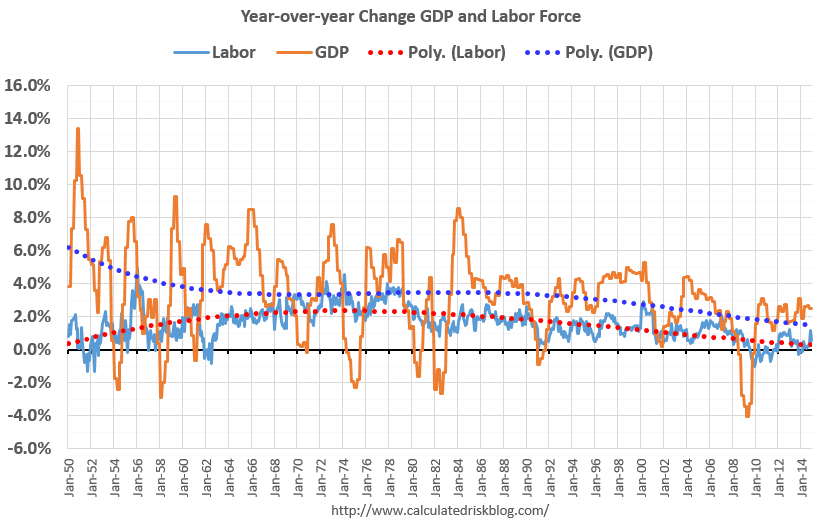 It isn't a surprise. Other than the early period with a boost from government spending, the growth in GDP has been tracking the growth in the labor force pretty well. The difference in growth between the dashed blue and red lines is due to gains in productivity.
The good news is that will change going forward (prime working age population will grow faster next decade). The bad news is the political hacks will continue to ignore demographics.
Right now, due to demographics, 2% GDP growth is the new 4%.
Saturday, January 31, 2015
Schedule for Week of February 1, 2015
by Calculated Risk on 1/31/2015 01:11:00 PM
The key report this week is the January employment report on Friday.
Other key reports include the January ISM manufacturing index on Monday, January vehicle sales on Tuesday, the ISM non-manufacturing index on Wednesday, and the December Trade Deficit on Thursday.
8:30 AM ET: Personal Income and Outlays for December. The consensus is for a 0.2% increase in personal income, and for a 0.2% decrease in personal spending. And for the Core PCE price index to be unchanged.
 10:00 AM: ISM Manufacturing Index for January. The consensus is for a decrease to 54.5 from 55.5 in December.
Here is a long term graph of the ISM manufacturing index.
The ISM manufacturing index indicated expansion in December at 55.5%. The employment index was at 56.8%, and the new orders index was at 57.3%
10:00 AM: Construction Spending for December. The consensus is for a 0.6% increase in construction spending.
 All day: Light vehicle sales for January. The consensus is for light vehicle sales to decrease to 16.6 million SAAR in January from 16.8 million in December (Seasonally Adjusted Annual Rate).
This graph shows light vehicle sales since the BEA started keeping data in 1967. The dashed line is the December sales rate.
10:00 AM: Manufacturers' Shipments, Inventories and Orders (Factory Orders) for December. The consensus is for a 2.0 decrease in December orders.
7:00 AM: The Mortgage Bankers Association (MBA) will release the results for the mortgage purchase applications index.
8:15 AM: The ADP Employment Report for January. This report is for private payrolls only (no government). The consensus is for 220,000 payroll jobs added in January, down from 241,000 in December.
10:00 AM: ISM non-Manufacturing Index for January. The consensus is for a reading of 56.5, up from 56.2 in December. Note: Above 50 indicates expansion.
8:30 AM: The initial weekly unemployment claims report will be released. The consensus is for claims to increase to 290 thousand from 265 thousand.
 8:30 AM: Trade Balance report for December from the Census Bureau.
 This graph shows the U.S. trade deficit, with and without petroleum, through November. The blue line is the total deficit, and the black line is the petroleum deficit, and the red line is the trade deficit ex-petroleum products.
The consensus is for the U.S. trade deficit to be at $38.0 billion in December from $39.0 billion in November.
8:30 AM: Employment Report for January. The consensus is for an increase of 230,000 non-farm payroll jobs added in January, down from the 252,000 non-farm payroll jobs added in December.
The consensus is for the unemployment rate to be unchanged at 5.6% in January from 5.6% the previous month.
 This graph shows the year-over-year change in total non-farm employment since 1968.
In December, the year-over-year change was 2.95 million jobs, and that should increase further in January.
As always, a key will be the change in real wages - and as the unemployment rate falls, wage growth should eventually start to pickup.
Notes: The annual benchmark revision will be released with the January report. The preliminary estimate was an additional 7,000 jobs as of March 2014.
Also, the new population controls will be used in the Current Population Survey (CPS) estimation process. It is important to note that "household survey data for January 2015 will not be directly comparable with data for December 2014 or earlier periods". Someone better alert Rick Santelli at CNBC!
3:00 PM: Consumer Credit for December from the Federal Reserve. The consensus is for credit to increase $15.0 billion.
Unofficial Problem Bank list declines to 388 Institutions
by Calculated Risk on 1/31/2015 08:05:00 AM
UPDATE: The Federal Reserve announced the termination of the enforcement action for Pacific Mercantile Bancorp, Costa Mesa, California; Pacific Mercantile Bank, Costa Mesa, California on Nov 20, 2014. The bank has been removed from the "unofficial list".
This is an unofficial list of Problem Banks compiled only from public sources.
Here is the unofficial problem bank list for Jan 30, 2015.
Changes and comments from surferdude808:
As expected, the FDIC released an update on its enforcement action activities through December 2014 that contributed to all of the changes to the Unofficial Problem Bank List this week. In all, there were five removals and three additions that leave the list at 388 institutions with assets of $122.5 billion. A year ago, the list held 590 institutions with assets of $195.4 billion. When the weekly was list was first published back on August 7, 2009 it had 389 institutions, so this is the first time a subsequent list held fewer institutions than its inception. There are still 53 institutions from the original list that still remain on it.CR Note: As Surfer Dude noted, the list has come full circle (back to number when we started)!
FDIC terminated actions against Signature Bank of Arkansas, Fayetteville, AR ($492 million); Village Bank, Saint Francis, MN ($176 million); Golden Eagle Community Bank, Woodstock, IL ($136 million); The Wilmington Savings Bank, Wilmington, OH ($127 million); and VistaBank, Aiken, SC ($107 million).
FDIC issued new actions against Seaway Bank and Trust Company, Chicago, IL ($522 million); International Bank, Raton, NM ($292 million); and Sage Bank, Lowell, MA ($208 million).
Next week will likely see fewer changes to the list.


