by Calculated Risk on 1/28/2015 11:13:00 AM
Wednesday, January 28, 2015
Duy: "While We Wait For Yet Another FOMC Statement..."
From Tim Duy: While We Wait For Yet Another FOMC Statement... Excerpt:
The Fed recognizes that hiking rates prematurely to "give them room" in the next recession is of course self-defeating. They are not going to invite a recession simply to prove they have the tools to deal with another recession.
The reasons the Fed wants to normalize policy are, I fear, a bit more mundane:
1. They believe the economy is approaching a more normal environment with solid GDP growth and near-NAIRU unemployment. They do not believe such an environment is consistent with zero rates.I am currently of the opinion that there is a reasonable chance the Fed is wrong on the third point, and that they have less room to maneuver than they believe. If so, they will find themselves back at the zero bound in the next recession, very quickly I might add. ...
2. They believe that monetary policy operates with long and variable lags. Consequently, they need to act before inflation hits 2% if they do not want to overshoot their target. And they in fact have no intention of overshooting their target.
3. They do not believe in the secular stagnation story. They do not believe that the estimate of the neutral Fed Funds rate should be revised sharply downward. Hence 25bp, or 50bp, or even 100bp still represents loose monetary policy by their definition.
Whether or not they can maintain their mid-year target is of course the topic du jour. But the logic of those who believe the Fed will not have what it needs in June and thus expect the first hike much later is more convincing than those who argue that they will raise rates due to some pressing need to prepare for the next recession.
MBA: "Mortgage Applications decrease in Latest MBA Weekly Survey"
by Calculated Risk on 1/28/2015 07:01:00 AM
From the MBA: Mortgage Applications Decrease in Latest MBA Weekly Survey
Mortgage applications decreased 3.2 percent from one week earlier, according to data from the Mortgage Bankers Association’s (MBA) Weekly Mortgage Applications Survey for the week ending January 23, 2015. This week’s results include an adjustment to account for the Martin Luther King holiday. ...
The Refinance Index decreased 5 percent from the previous week. The seasonally adjusted Purchase Index decreased 0.1 percent from one week earlier.
...
The FHA share of total applications increased to 9.1 percent this week from 8.0 percent last week. ...
The average contract interest rate for 30-year fixed-rate mortgages with conforming loan balances ($417,000 or less) increased to 3.83 percent from 3.80 percent, with points decreasing to 0.26 from 0.29 (including the origination fee) for 80 percent loan-to-value ratio (LTV) loans.
emphasis added
 Click on graph for larger image.
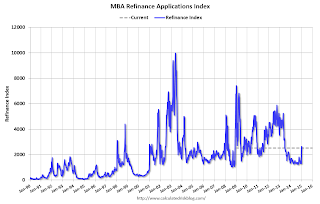
The first graph shows the refinance index.
2014 was the lowest year for refinance activity since year 2000.
It looks like 2015 will see more refinance activity than in 2014, especially from FHA loans!
 The second graph shows the MBA mortgage purchase index.
 According to the MBA, the purchase index is up 1% from a year ago.
Tuesday, January 27, 2015
Wednesday: FOMC Statement
by Calculated Risk on 1/27/2015 09:01:00 PM
I don't expect much to change in the FOMC statement. I expect "patient" to remain:
"Based on its current assessment, the Committee judges that it can be patient in beginning to normalize the stance of monetary policy."And this sentence will probably be dropped (it seemed like a one time transition sentence):
"The Committee sees this guidance as consistent with its previous statement that it likely will be appropriate to maintain the 0 to 1/4 percent target range for the federal funds rate for a considerable time following the end of its asset purchase program in October, especially if projected inflation continues to run below the Committee's 2 percent longer-run goal, and provided that longer-term inflation expectations remain well anchored."The major data flow has been consistent with the FOMC's view; the consensus estimate of Q4 GDP is at 3.2%, and the December employment report was solid (252 thousand jobs added, unemployment rate declined to 5.6%). Inflation too low is an ongoing concern, but overall I think the FOMC will be, uh, patient.
Wednesday:
• At 7:00 AM, the Mortgage Bankers Association (MBA) will release the results for the mortgage purchase applications index.
• At 2:00 PM, FOMC Meeting Statement. The FOMC is expected to retain the word "patient" in the FOMC statement
BLS: Forty-two States had Unemployment Rate Decreases in December
by Calculated Risk on 1/27/2015 06:44:00 PM
From the BLS: Regional and State Employment and Unemployment Summary
Regional and state unemployment rates were generally lower in December. Forty-two states and the District of Columbia had unemployment rate decreases from November, four states had increases, and four states had no change, the U.S. Bureau of Labor Statistics reported today.
...
Mississippi had the highest unemployment rate among the states in December, 7.2 percent. The District of Columbia had a rate of 7.3 percent. North Dakota again had the lowest jobless rate, 2.8 percent.
 Click on graph for larger image.
This graph shows the current unemployment rate for each state (red), and the max during the recession (blue). All states are well below the maximum unemployment rate for the recession.
The size of the blue bar indicates the amount of improvement.
The states are ranked by the highest current unemployment rate. Mississippi, at 7.2%, had the highest state unemployment rate although D.C was higher.
 The second graph shows the number of states (and D.C.) with unemployment rates at or above certain levels since January 2006. At the worst of the employment recession, there were 10 states with an unemployment rate at or above 11% (red).
Currently no state has an unemployment rate at or above 8% (light blue); Two states and D.C. are still at or above 7% (dark blue).
House Prices: Better Seasonal Adjustment; Real Prices and Price-to-Rent Ratio in November
by Calculated Risk on 1/27/2015 03:57:00 PM
This morning, S&P reported that the National index increased 0.8% in October seasonally adjusted. However, it appears the seasonal adjustment has been distorted by the high level of distressed sales in recent years. Trulia's Jed Kolko wrote in August: "Let’s Improve, Not Ignore, Seasonal Adjustment of Housing Data"
The housing crisis substantially changed the seasonal pattern of housing activity: relative to conventional home sales, which peak in summer, distressed home sales are more evenly spread throughout the year and sell at a discount. As a result, in years when distressed sales constitute a larger share of overall sales, the seasonal swings in home prices get bigger while the seasonal swings in sales volumes get smaller.
Sharply changing seasonal patterns create problems for seasonal adjustment methods, which typically estimate seasonal adjustment factors by averaging several years’ worth of observed seasonal patterns. A sharp but ultimately temporary change in the seasonal pattern for housing activity affects seasonal adjustment factors more gradually and for more years than it should. Despite the recent normalizing of the housing market, seasonal adjustment factors are still based, in part, on patterns observed at the height of the foreclosure crisis, causing home price indices to be over-adjusted in some months and under-adjusted in others.
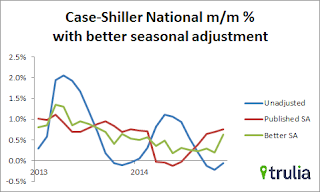
 Kolko proposed a better seasonal adjustment:
This graph from Kolko shows the weighted seasonal adjustment (see Kolko's article for a description of his method). Kolko calculates that prices increased 0.6% on a weighted seasonal adjustment basis in November - as opposed to the 0.8% SA increase and 0.1% NSA decrease reported by Case-Shiller.
The "better" SA (green) shows prices are still increasing, but more slowly than the Case-Shiller SA.
The expected slowdown in year-over-year price increases is ongoing. In November 2013, the Comp 20 index was up 13.8% year-over-year (YoY). Now the index is only up 4.3% YoY. This is the smallest YoY increase since October 2012 (the National index was up 10.9% YoY in October 2013, is now up 4.7% - a little more than the YoY change last month).
Looking forward, I expect the YoY increases for the indexes to move more sideways (as opposed to down). Two points: 1) I don't expect the indexes to turn negative YoY (in 2015) , and 2) I think most of the slowdown on a YoY basis is now behind us. This slowdown in price increases was expected by several key analysts, and I think it is good news for housing and the economy.
In the earlier post, I graphed nominal house prices, but it is also important to look at prices in real terms (inflation adjusted). Case-Shiller, CoreLogic and others report nominal house prices. As an example, if a house price was $200,000 in January 2000, the price would be close to $277,000 today adjusted for inflation (39%). That is why the second graph below is important - this shows "real" prices (adjusted for inflation).
Another point on real prices: In the Case-Shiller release this morning, the National Index was reported as being 9.1% below the bubble peak. However, in real terms, the National index is still about 23% below the bubble peak.
Nominal House Prices
 The first graph shows the monthly Case-Shiller National Index SA, the monthly Case-Shiller Composite 20 SA, and the CoreLogic House Price Indexes (through November) in nominal terms as reported.
In nominal terms, the Case-Shiller National index (SA) is back to April 2005 levels, and the Case-Shiller Composite 20 Index (SA) is back to November 2004 levels, and the CoreLogic index (NSA) is back to February 2005.
Real House Prices
 The second graph shows the same three indexes in real terms (adjusted for inflation using CPI less Shelter). Note: some people use other inflation measures to adjust for real prices.
In real terms, the National index is back to March 2003 levels, the Composite 20 index is back to September 2002, and the CoreLogic index back to March 2003.
In real terms, house prices are back to early '00s levels.
Price-to-Rent
In October 2004, Fed economist John Krainer and researcher Chishen Wei wrote a Fed letter on price to rent ratios: House Prices and Fundamental Value. Kainer and Wei presented a price-to-rent ratio using the OFHEO house price index and the Owners' Equivalent Rent (OER) from the BLS.
 Here is a similar graph using the Case-Shiller National, Composite 20 and CoreLogic House Price Indexes.
This graph shows the price to rent ratio (January 1998 = 1.0).
On a price-to-rent basis, the Case-Shiller National index is back to April 2003 levels, the Composite 20 index is back to October 2002 levels, and the CoreLogic index is back to April 2003.
In real terms, and as a price-to-rent ratio, prices are mostly back to early 2000 levels - and maybe moving a little sideways now.


