by Calculated Risk on 1/16/2015 01:22:00 PM
Friday, January 16, 2015
Key Measures Show Low Inflation in December
The Cleveland Fed released the median CPI and the trimmed-mean CPI this morning:
According to the Federal Reserve Bank of Cleveland, the median Consumer Price Index rose 0.2% (2.1% annualized rate) in December. The 16% trimmed-mean Consumer Price Index rose 0.1% (1.2% annualized rate) during the month. The median CPI and 16% trimmed-mean CPI are measures of core inflation calculated by the Federal Reserve Bank of Cleveland based on data released in the Bureau of Labor Statistics’ (BLS) monthly CPI report.Note: The Cleveland Fed has the median CPI details for December here. Motor fuel declined at a 69% annualized rate in December, following a 55% annualized rate decline in November, and a 31% annualized rate decline in October!
Earlier today, the BLS reported that the seasonally adjusted CPI for all urban consumers fell 0.4% (-4.4% annualized rate) in December. The CPI less food and energy was unchanged (0.0% annualized rate) on a seasonally adjusted basis.
 Click on graph for larger image.
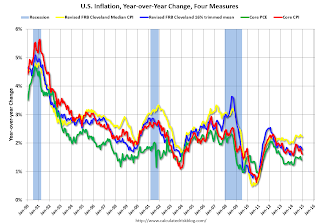
This graph shows the year-over-year change for these four key measures of inflation. On a year-over-year basis, the median CPI rose 2.2%, the trimmed-mean CPI rose 1.8%, and the CPI less food and energy rose 1.6%. Core PCE is for November and increased 1.4% year-over-year.
On a monthly basis, median CPI was at 2.1% annualized, trimmed-mean CPI was at 1.2% annualized, and core CPI was unchanged annualized.
On a year-over-year basis these measures suggest inflation remains below the Fed's target of 2% (median CPI is close to 2%).
Lawler: Preliminary Table of Distressed Sales and Cash buyers for Selected Cities in December
by Calculated Risk on 1/16/2015 11:46:00 AM
Economist Tom Lawler sent me the preliminary table below of short sales, foreclosures and cash buyers for a few selected cities in December.
On distressed: Total "distressed" share is down in most of these markets mostly due to a decline in short sales.
Short sales are down in these areas (except Sacramento).
Foreclosures are up in a few areas (working through the logjam).
The All Cash Share (last two columns) is declining year-over-year. As investors pull back, the share of all cash buyers will probably continue to decline.
| Short Sales Share | Foreclosure Sales Share | Total "Distressed" Share | All Cash Share | |||||
|---|---|---|---|---|---|---|---|---|
| Dec-14 | Dec-13 | Dec-14 | Dec-13 | Dec-14 | Dec-13 | Dec-14 | Dec-13 | |
| Las Vegas | 10.0% | 20.7% | 8.0% | 8.5% | 18.0% | 29.2% | 34.1% | 44.4% |
| Reno** | 8.0% | 24.0% | 5.0% | 4.0% | 13.0% | 28.0% | ||
| Phoenix | 29.2% | 32.9% | ||||||
| Sacramento | 6.2% | 6.1% | 7.1% | 5.4% | 13.3% | 11.5% | 15.4%** | 19.5%** |
| Minneapolis | 3.7% | 5.5% | 12.6% | 17.1% | 16.3% | 22.7% | ||
| Mid-Atlantic | 4.9% | 8.0% | 11.2% | 9.3% | 16.1% | 17.3% | 20.3% | 19.3% |
| Orlando | 4.8% | 13.5% | 26.7% | 19.1% | 31.5% | 32.7% | 40.0% | 45.0% |
| Bay Area CA* | 4.0% | 7.9% | 3.7% | 4.6% | 7.7% | 12.5% | 19.0% | 23.5% |
| So. California* | 6.2% | 10.2% | 5.0% | 5.8% | 11.2% | 16.0% | 23.8% | 28.8% |
| Hampton Roads | 21.5% | 29.1% | ||||||
| Northeast Florida | 30.6% | 37.9% | ||||||
| Toledo | 37.9% | 36.5% | ||||||
| Tucson | 28.7% | 32.3% | ||||||
| Des Moines | 20.3% | 23.1% | ||||||
| Georgia*** | 25.5% | N/A | ||||||
| Omaha | 20.5% | 23.9% | ||||||
| Memphis* | 15.0% | 21.0% | ||||||
| *share of existing home sales, based on property records **Single Family Only ***GAMLS | ||||||||
Preliminary January Consumer Sentiment increases to 98.2
by Calculated Risk on 1/16/2015 10:01:00 AM
Fed: Industrial Production decreased 0.1% in December
by Calculated Risk on 1/16/2015 09:15:00 AM
From the Fed: Industrial production and Capacity Utilization
Industrial production decreased 0.1 percent in December after rising 1.3 percent in November. The decrease in December reflected a sharp drop in the output of utilities, as warmer-than-usual temperatures reduced demand for heating; excluding utilities, industrial production rose 0.7 percent. Manufacturing posted a gain of 0.3 percent for its fourth consecutive monthly increase. The index for mining increased 2.2 percent after falling in the previous two months. At 106.5 percent of its 2007 average, total industrial production in December was 4.9 percent above its level of a year earlier. For the fourth quarter of 2014 as a whole, industrial production advanced at an annual rate of 5.6 percent, with widespread gains among the major market and industry groups. Capacity utilization for the industrial sector decreased 0.3 percentage point in December to 79.7 percent, a rate that is 0.4 percentage point below its long-run (1972–2013) average.
emphasis added
 Click on graph for larger image.
This graph shows Capacity Utilization. This series is up 12.7 percentage points from the record low set in June 2009 (the series starts in 1967).
Capacity utilization at 79.7% is 0.4% below the average from 1972 to 2012 and below the pre-recession level of 80.8% in December 2007.
Note: y-axis doesn't start at zero to better show the change.
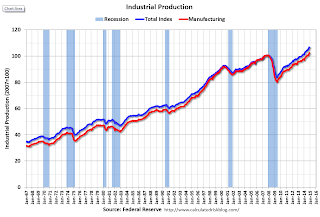
 The second graph shows industrial production since 1967.
Industrial production decreased 0.1% in December to 106.5. This is 27.2% above the recession low, and 5.7% above the pre-recession peak.
This was slightly below expectations.
BLS: CPI decreased 0.4% in December, Core CPI Unchanged
by Calculated Risk on 1/16/2015 08:30:00 AM
The Consumer Price Index for All Urban Consumers (CPI-U) declined 0.4 percent in December on a seasonally adjusted basis, the U.S. Bureau of Labor Statistics reported today. Over the last 12 months, the all items index increased 0.8 percent before seasonal adjustment.I'll post a graph later today after the Cleveland Fed releases the median and trimmed-mean CPI. This was at the consensus forecast of a 0.4% decrease for CPI, and below the forecast of a 0.1% increase in core CPI.
The gasoline index continued to fall sharply, declining 9.4 percent and leading to the decrease in the seasonally adjusted all items index. The fuel oil index also fell sharply, and the energy index posted its largest one-month decline since December 2008, although the indexes for natural gas and for electricity both increased. The food index, in contrast, rose 0.3 percent, its largest increase since September.
The index for all items less food and energy was unchanged in December, following a 0.2 percent increase in October and a 0.1 percent rise in November. This was only the second time since 2010 that it did not increase.
emphasis added
Thursday, January 15, 2015
Friday: CPI, Industrial Production, Consumer Sentiment
by Calculated Risk on 1/15/2015 08:33:00 PM
From Freddie Mac: Mortgage Rates Decline for Third Consecutive Week
Freddie Mac today released the results of its Primary Mortgage Market Survey® (PMMS®), showing average fixed mortgage rates falling for the third consecutive week as bond yields continued to drop despite a strong employment report. Averaging 3.66 percent, the 30-year fixed-rate mortgage is at its lowest level since the week ending May 23, 2013 when it averaged 3.59 percent. This also marks the first time the 15-year fixed rate mortgage has fallen below 3 percent since the week ending May 30, 2013.Friday:
30-year fixed-rate mortgage (FRM) averaged 3.66 percent with an average 0.6 point for the week ending January 15, 2014, down from last week when it averaged 3.73 percent. A year ago at this time, the 30-year FRM averaged 4.41 percent.
emphasis added
• At 8:30 AM ET, the Consumer Price Index for December. The consensus is for a 0.4% decrease in CPI, and for core CPI to increase 0.1%.
• At 9:15 AM, the The Fed will release Industrial Production and Capacity Utilization for December. The consensus is for no change in Industrial Production, and for Capacity Utilization to decrease to 80.0%.
• At 9:55 AM, the University of Michigan's Consumer sentiment index (preliminary for January). The consensus is for a reading of 94.1, up from 93.6 in December.
NMHC: Apartment Market Conditions Slightly Tighter in January Survey
by Calculated Risk on 1/15/2015 06:31:00 PM
From the National Multi Housing Council (NMHC): Apartment Markets Moderate Slightly in January NMHC Quarterly Survey
Apartment markets expanded in three of four areas in the January National Multifamily Housing Council (NMHC) Quarterly Survey of Apartment Market Conditions, indicating a slight moderation of the pace of improvement. Only the sales volume index (44) dropped below 50, with market tightness (51), equity financing (55) and debt financing (71) showing continued expansion.
“The apartment markets continue to show strength in most areas,” said Mark Obrinsky, NMHC’s SVP of Research and Chief Economist. “Last year’s ramp-up in new construction finally signaled complete recovery on the supply side. Even so, demand for apartment residences remains strong enough to absorb the increase in deliveries—and then some, as occupancy rates edged up a bit more.”
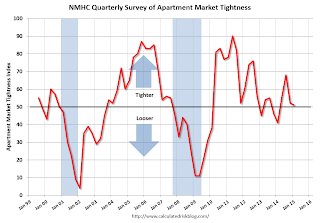
The Market Tightness Index fell from 52 to 51. More than half (58 percent) of respondents reported unchanged conditions, and slightly over one-fifth (22 percent) saw conditions as tighter than three months ago. Looser conditions were reported by 20 percent of respondents. This is the fourth consecutive quarter where the index has indicated overall improving conditions.
emphasis added

Click on graph for larger image.
This graph shows the quarterly Apartment Tightness Index. Any reading above 50 indicates tighter conditions from the previous quarter. This indicates market conditions were mostly unchanged over the last quarter.
As I've mentioned before, this index helped me call the bottom for effective rents (and the top for the vacancy rate) early in 2010.
Lawler: Early Read on Existing Home Sales in December
by Calculated Risk on 1/15/2015 03:28:00 PM
From housing economist Tom Lawler:
Based on local realtor/MLS reports from across the country, I estimate that existing home sales as measured by the National Association of Realtors ran at a seasonally adjusted annual rate of 5.15 million in December, up 4.5% from November’s pace and up 5.7% from last December’s pace.
On the inventory front, most realtor/MLS reports showed a bigger monthly decline this December compared to last December, and my “guesstimate” is that the NAR will report that the number of existing homes for sale at the end of December was 1,870, down 10.5% from November and up just 0.5% from last December.
Finally, local realtor/MLS data suggest that the national median existing SF home sales price last month was up by about 4.8% from a year earlier.
CR Note: Existing home sales for December will be released next week on Friday, January 23rd.
DataQuick: California Bay Area "Home buying picked up steam" in December
by Calculated Risk on 1/15/2015 02:36:00 PM
From DataQuick: Bay Area Home Sales and Prices Rise in December 2014
Home buying picked up steam late in 2014, with December posting strong month-over-month and year-over-year sales gains. ... A total of 7,456 new and resale houses and condos sold in the nine-county Bay Area in December 2014. That was up month over month 24.2 percent from 6,003 in November 2014 and up year over year 14.1 percent from 6,532 in December 2013, according to CoreLogic DataQuick data.Last month I noted that it seemed like houses were moving again. I wrote 'in my area it seems like a large number of homes went "pending" during the last few weeks' - and sure enough the data suggests a pickup in sales in December.
...
“The Bay Area’s residential real estate market ended 2014 on a cautiously optimistic note, with moderate year-over-year increases in both median price and sales counts,” said John Karevoll, CoreLogic DataQuick analyst. “Supply continues to be constrained, and the mortgage market remains difficult. As long-term trends, cash sales and investor purchases are declining slowly, but they are still significant market factors. We know that there is a significant amount of pent-up demand lying in wait, and there is a good chance the market could see a surge this spring and summer as more homes are put up for sale.”
...
Foreclosure resales accounted for 3.7 percent of all resales in December 2014, up from 2.8 percent in November 2014, and down from 4.6 percent in December 2013. Foreclosure resales in the Bay Area peaked at 52.0 percent in February 2009, while the monthly average over the past 17 years is 9.6 percent. Foreclosure resales are purchased homes that have been previously foreclosed upon in the prior 12 months.
Short sales made up an estimated 4.0 percent of Bay Area resales in December 2014, up from a revised 3.9 percent in November 2014 and down from 7.9 percent in December 2013. Short sales are transactions in which the sale price fell short of what was owed on the property.
emphasis added
CoStar: Commercial Real Estate prices increased in November
by Calculated Risk on 1/15/2015 01:22:00 PM
Here is a price index for commercial real estate that I follow.
From CoStar: CRE Price Recovery Continues With Strong Showing in November
The two broadest measures of aggregate pricing for commercial properties within the CCRSI—the value-weighted U.S. Composite Index and the equal-weighted U.S. Composite Index—increased by 1% and 0.7%, respectively, in the month of November 2014, contributing to annual gains of 9.9% and 14.8%, respectively, for the 12 months ending in November 2014.
...
VALUE-WEIGHTED U.S. COMPOSITE INDEX SET A NEW HIGH-WATER MARK. Investors’ healthy appetite for core properties propelled growth in the value-weighted U.S. Composite Index, which surpassed its pre-recession peak previously set in 2007 by 5.1% in November 2014.
PRICE GROWTH ACCELERATED IN EQUAL-WEIGHTED INDEX. Price growth in the equal-weighted U.S. Composite Index, influenced more by smaller, non-core deals, accelerated to an annual pace of 14.8% in November 2014, from an average annual pace of 7.5% in 2013.
emphasis added
 Click on graph for larger image.
This graph from CoStar shows the the value-weighted U.S. Composite Index and the equal-weighted U.S. Composite Index indexes.
The value weighted index is at a record high, but the equal weighted is still 14% below the pre-recession peak.
There are indexes by sector and region too.
 The second graph shows the percent of distressed "pairs".
The distressed share is down from over 35% at the peak, but still somewhat elevated.
Note: These are repeat sales indexes - like Case-Shiller for residential - but this is based on far fewer pairs.


