by Calculated Risk on 10/16/2014 07:35:00 PM
Thursday, October 16, 2014
Friday: Housing Starts, Yellen
From Jann Swanson at Mortgage News Daily: Relaxed QRM Rules Expected Next Week(ht Soylent Green is People)
Federal regulators may finally produce the long anticipated market standards for Qualified Residential Mortgages (QRM), perhaps even as early as next week. The new rules are designed to ensure the quality of mortgages that are pooled and packaged into securities for sale to investors on the secondary market. Insiders expect that the final regulations will be more relaxed than those originally proposed, largely in response to demands by real estate and mortgage industry groups.Friday:
• At 8:30 AM, Housing Starts for September. Total housing starts were at 956 thousand (SAAR) in August. Single family starts were at 643 thousand SAAR in August. The consensus is for total housing starts to increase to 1.010 million (SAAR) in September.
• Also at 8:30 AM, Speech by Fed Chair Janet Yellen, Economic Opportunity, At the Federal Reserve Bank of Boston Economic Conference: Inequality of Economic Opportunity, Boston, Massachusetts
• At 9:55 AM, the Reuter's/University of Michigan's Consumer sentiment index (preliminary for October). The consensus is for a reading of 84.2, down from 84.6 in September.
CoStar: Commercial Real Estate prices increased in August
by Calculated Risk on 10/16/2014 05:21:00 PM
Here is a price index for commercial real estate that I follow.
From CoStar: Commercial Property Prices Sustain Upward Climb in August
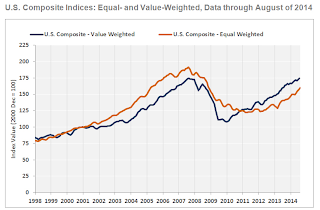
Fueled by better than expected job growth, demand continues to outstrip supply across major property types, resulting in tighter vacancy rates and continued investor interest in commercial real estate. The two broadest measures of aggregate pricing for commercial properties within the CCRSI—the value-weighted U.S. Composite Index and the equal-weighted U.S. Composite Index—increased by 1% and 1.5%, respectively, in August 2014.
...
The value-weighted U.S. Composite Index, which is heavily influenced by larger, core transactions, has now reached prerecession peak levels, and price gains have naturally slowed as a result. The Index increased 8.7% for the 12 months ending in August 2014, following 12% growth in the prior 12 months. Meanwhile, price growth in the equal-weighted U.S. Composite Index, which is influenced more by smaller non-core deals, accelerated to an annual rate of 13.6% in August 2014, up from an average of 8.7% in the prior 12 months.
...
Just 10.5% of all repeat sale transactions involved distressed assets in the first eight months of 2014, down from one-third of all repeat sale transactions in 2010.
emphasis added
 Click on graph for larger image.
This graph from CoStar shows the the value-weighted U.S. Composite Index and the equal-weighted U.S. Composite Index indexes.
The value weighted index is back to the pre-recession peak, but the equal weighted is still well below the pre-recession peak.
 The second graph shows the percent of distressed "pairs".
The distressed share is down from over 35% at the peak.
Note: These are repeat sales indexes - like Case-Shiller for residential - but this is based on far fewer pairs.
Earlier: Philly Fed Manufacturing Survey declines to 20.7 in October
by Calculated Risk on 10/16/2014 12:56:00 PM
Earlier from the Philly Fed: October Manufacturing Survey
The diffusion index for current activity edged down from a reading of 22.5 to 20.7 this month ... The current shipments and employment indexes also declined but remained positive, while the current new orders index increased 2 points [to 17.3].This at the consensus forecast of a reading of 20.0 for October.
...
Although positive for the 16th consecutive month, the employment index decreased 9 points. [to 12.1] ...
The survey’s indicators for future manufacturing conditions fell from higher readings but continued to reflect general optimism about growth in activity and employment over the next six months.
emphasis added
 Click on graph for larger image.
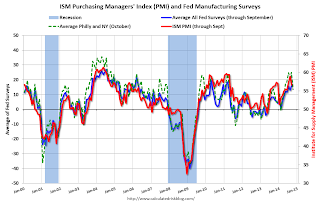
Here is a graph comparing the regional Fed surveys and the ISM manufacturing index. The dashed green line is an average of the NY Fed (Empire State) and Philly Fed surveys through October. The ISM and total Fed surveys are through September.
The average of the Empire State and Philly Fed surveys declined in October, but still suggests another decent ISM report for October.
NAHB: Builder Confidence decreased to 54 in October
by Calculated Risk on 10/16/2014 10:00:00 AM
The National Association of Home Builders (NAHB) reported the housing market index (HMI) was at 54 in October, down from 59 in September. Any number above 50 indicates that more builders view sales conditions as good than poor.
From the NAHB: Four-Month Upturn Ends as Builder Confidence Falls in October
After four consecutive monthly gains, builder confidence in the market for newly built single-family homes fell five points to a level of 54 on the National Association of Home Builders/Wells Fargo Housing Market Index (HMI), released today.
“We are seeing a return to the mid-50s index level trend established earlier in the summer, which is in line with the gradual pace of the housing recovery,” said NAHB Chairman Kevin Kelly, a home builder and developer from Wilmington, Del.
“While there was a dip this month, builders are still positive about the housing market.” “After the HMI posted a nine-year high in September, it’s not surprising to see the number drop in October,” said NAHB Chief Economist David Crowe. “However, historically low mortgage interest rates, steady job gains, and significant pent up demand all point to continued growth of the housing market.”
...
All three HMI components declined in October. The index gauging current sales conditions decreased six points to 57, while the index measuring expectations for future sales slipped three points to 64 and the index gauging traffic of prospective buyers dropped six points to 41.
Looking at the three-month moving averages for regional HMI scores, the Northeast and Midwest remained flat at 41 and 59, respectively. The South rose two points to 58 and the West registered a one-point loss to 57.
emphasis added
 Click on graph for larger image.
This graph show the NAHB index since Jan 1985.
This was below the consensus forecast of 59.
Fed: Industrial Production increased 1.0% in September
by Calculated Risk on 10/16/2014 09:15:00 AM
From the Fed: Industrial production and Capacity Utilization
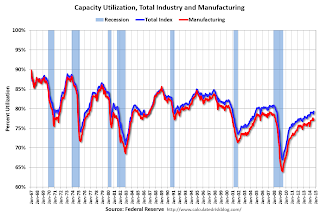
Industrial production increased 1.0 percent in September and advanced at an annual rate of 3.2 percent in the third quarter of 2014, roughly its average quarterly increase since the end of 2010. In September, manufacturing output moved up 0.5 percent, while the indexes for mining and for utilities climbed 1.8 percent and 3.9 percent, respectively. For the third quarter as a whole, manufacturing production rose at an annual rate of 3.5 percent and mining output increased at an annual rate of 8.7 percent. The output of utilities fell at an annual rate of 8.5 percent for a second consecutive quarterly decline. At 105.1 percent of its 2007 average, total industrial production in September was 4.3 percent above its level of a year earlier. The capacity utilization rate for total industry moved up 0.6 percentage point in September to 79.3 percent, a rate that is 1.0 percentage point above its level of 12 months earlier but 0.8 percentage point below its long-run (1972–2013) average.
emphasis added
 Click on graph for larger image.
This graph shows Capacity Utilization. This series is up 12.4 percentage points from the record low set in June 2009 (the series starts in 1967).
Capacity utilization at 79.3% is 0.8 percentage points below its average from 1972 to 2012 and below the pre-recession level of 80.8% in December 2007.
Note: y-axis doesn't start at zero to better show the change.
 The second graph shows industrial production since 1967.
Industrial production increased 1.0% in September to 105.1. This is 25.5% above the recession low, and 4.3% above the pre-recession peak.
The monthly change for Industrial Production was above expectations.


