by Calculated Risk on 5/07/2014 11:17:00 AM
Wednesday, May 07, 2014
Phoenix Real Estate in April: Sales down 12%, Cash Sales down 33%, Inventory up 49%
This is a key distressed market to follow since Phoenix saw a large bubble / bust followed by strong investor buying.
The Arizona Regional Multiple Listing Service (ARMLS) reports (table below):
1) Overall sales in April were down 12% year-over-year and at the lowest level since April 2008.
2) Cash Sales (frequently investors) were down 33%, so investor buying appears to be declining. Non-cash sales were up year-over-year.
3) Active inventory is now increasing rapidly and is up 49% year-over-year - and at the highest level since 2011.
Inventory has clearly bottomed in Phoenix (A major theme for housing last year). And more inventory (a theme this year) - and less investor buying - suggests price increases should slow sharply in 2014.
According to Case-Shiller, Phoenix house prices bottomed in August 2011 (mostly flat for all of 2011), and then increased 23% in 2012, and another 15% in 2013. Those large increases were probably due to investor buying, low inventory and some bounce back from the steep price declines in 2007 through 2010. Now, with more inventory, price increases should flatten out in 2014.
We only have Case-Shiller through February, but the Zillow index shows Phoenix prices down slightly in March (most recent data), and down 1.2% in Q1.
| April Residential Sales and Inventory, Greater Phoenix Area, ARMLS | |||||
|---|---|---|---|---|---|
| Sales | Cash | Percent Cash | Inventory | YoY Change | |
| Apr-08 | 4,8751 | 986 | 20.2% | 55,7261 | --- |
| Apr-09 | 8,564 | 3,464 | 40.4% | 44,165 | -20.7% |
| Apr-10 | 9,261 | 3,641 | 39.3% | 41,756 | -5.5% |
| Apr-11 | 9,328 | 4,489 | 48.1% | 34,515 | -17.3% |
| Apr-12 | 8,438 | 4,013 | 47.6% | 21,125 | -38.8% |
| Apr-13 | 8,744 | 3,670 | 42.0% | 20,083 | -4.9% |
| Apr-14 | 7,656 | 2,469 | 32.2% | 29,889 | 48.8% |
| 1 April 2008 does not include manufactured homes, ~100 more | |||||
Fed Chair Janet Yellen: Expects Growth Rate to Increase, "A high degree of monetary accommodation remains warranted"
by Calculated Risk on 5/07/2014 10:05:00 AM
Testimony by Chair Yellen on the economic outlook. A couple of excerpts:
Looking ahead, I expect that economic activity will expand at a somewhat faster pace this year than it did last year, that the unemployment rate will continue to decline gradually, and that inflation will begin to move up toward 2 percent. A faster rate of economic growth this year should be supported by reduced restraint from changes in fiscal policy, gains in household net worth from increases in home prices and equity values, a firming in foreign economic growth, and further improvements in household and business confidence as the economy continues to strengthen. Moreover, U.S. financial conditions remain supportive of growth in economic activity and employment.And on monetary policy:
emphasis added
As always, our policy will continue to be guided by the evolving economic and financial situation, and we will adjust the stance of policy appropriately to take account of changes in the economic outlook. In light of the considerable degree of slack that remains in labor markets and the continuation of inflation below the Committee's 2 percent objective, a high degree of monetary accommodation remains warranted.
MBA: Refinance Share of Mortgage Applications under 50% for first time since 2009
by Calculated Risk on 5/07/2014 07:00:00 AM
For the first time since 2009 there were more purchase mortgage applications than refinance applications last week!
From the MBA: Mortgage Applications Increase in Latest MBA Weekly Survey
Mortgage applications increased 5.3 percent from one week earlier, according to data from the Mortgage Bankers Association’s (MBA) Weekly Mortgage Applications Survey for the week ending May 2, 2014. ...
The Refinance Index increased 2 percent from the previous week. The seasonally adjusted Purchase Index increased 9 percent from one week earlier to the highest level since January 2014. ...
...
The refinance share of mortgage activity decreased to 49 percent of total applications from 50 percent the previous week.
"It is official: we are in a majority purchase market for the first time since 2009,” said Mike Fratantoni, MBA’s Chief Economist. “A sizeable increase in purchase applications last week likely reflected the impact of somewhat lower mortgage rates as well as continued growth in the job market, as confirmed by Friday’s employment report from the BLS. Despite the strong increase in the purchase market last week, volume continues to run 16 percent behind last year's pace."
...
The average contract interest rate for 30-year fixed-rate mortgages with conforming loan balances ($417,000 or less) decreased to 4.43 percent, the lowest rates since November 2013, from 4.49 percent, with points decreasing to 0.21 from 0.38 (including the origination fee) for 80 percent loan-to-value ratio (LTV) loans.
emphasis added
 Click on graph for larger image.
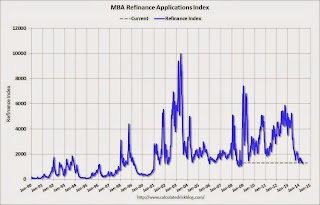
The first graph shows the refinance index.
The refinance index is down 75% from the levels in May 2013 (one year ago).
As expected, with the mortgage rate increases, refinance activity is very low this year.
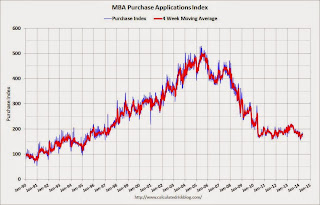
 The second graph shows the MBA mortgage purchase index.
 The 4-week average of the purchase index is now down about 18% from a year ago.
The purchase index is probably understating purchase activity because small lenders tend to focus on purchases, and those small lenders are underrepresented in the purchase index.
Tuesday, May 06, 2014
Wednesday: Yellen on the Economic Outlook
by Calculated Risk on 5/06/2014 08:44:00 PM
From Business Insider, here are some housing graphs: Here's Jeff Gundlach's Big Presentation On Why Homeownership Is Overrated And Why He's Short The Homebuilders. Gundlach is arguing the homebuilders are overvalued (I have no comment), and I'm not sure if he made any macro predictions.
This is a weird time because housing is improving, but most housing statistics are ugly. As an example, if I hadn't been paying attention - and someone told me the level of mortgage delinquencies and foreclosures - I'd guess the US was in a deep recession. But the trend for delinquencies tells a very different story.
If Gundlach made some macro predictions, please send them along and maybe I'll comment ...
Wednesday:
• At 7:00 AM ET, the Mortgage Bankers Association (MBA) will release the results for the mortgage purchase applications index.
• At 10:00 AM, Testimony by Fed Chair Janet Yellen, The Economic Outlook, Before the Joint Economic Committee, U.S. Congress
• At 3:00 PM, Consumer Credit for March from the Federal Reserve. The consensus is for credit to increase $15.1 billion.
What's Right with Housing?
by Calculated Risk on 5/06/2014 03:37:00 PM
There have been quite a few hand-wringing articles lately discussing the problems with housing. Most articles point to some of these suspects:
1) Existing home sales were down 7.5% year-over-year in March.
2) New home sales were down 13% year-over-year in March and down slightly Q1 over Q1.
3) Housing starts were down 5.9% year-over-year in March, and down 2% Q1 compared to Q1 2013.
4) The 4-week average of the Mortgage Bankers Association (MBA) mortgage purchase index is down 19% compared to the same week last year.
5) Mortgage credit is still tight.
6) Mortgage rates are up significantly from last year.
7) The homeownership rate is still falling.
8) Younger people prefer renting and more ...
Oh my, the sky is falling!
Well, maybe not.
The first mistake these writers make is they are asking the wrong question. Of course housing is lagging the recovery because of the residual effects of the housing bust and financial crisis (this lag was predicted on this blog and elsewhere for years - it should not be a surprise).
The correct question is: What's right with housing? And there is plenty.
1) Existing home sales were down 7.5% year-over-year in March. Wait, isn't that bad news? Nope - not if the decline is related to fewer distressed sales - and it is. (fewer foreclosures and short sales).
2) Mortgage delinquencies are down sharply. See: Fannie Mae and Freddie Mac: Mortgage Serious Delinquency rate declined in March and Mortgage Monitor: Mortgage delinquency rate in March lowest since October 2007, "Only One in 10 American Borrowers Underwater"
3) Mortgage credit is tight. Hey, isn't that bad news? Nope. There is only one way to go ...
 Click on graph for larger image.
4) New home sales are up significantly from the bottom, but are still historically very low.
There really is no where to go but up. A growing population will require more new homes. (I'll post again on household formation in the future). The graph for housing starts looks similar.
5) The percent of borrowers with negative equity is declining sharply. See: CoreLogic: 4 Million Residential Properties Returned to Positive Equity in 2013 and Zillow: Negative Equity declines further in Q4 2013
6) The impact from rising mortgage rates is mostly behind us. Economists at Goldman Sachs have found "the effect of monetary policy shocks on [building] permits persists for 3-4 quarters". Rates increased from around 3.5% in May 2013 to 4.4% in July 2013. Since then rates have moved sideways or down a little - and the "3-4 quarters" is almost over.
7) Existing home inventory is increasing, and house price increases are slowing. Sometimes rising inventory is a sign of trouble (I was pointing to this in 2005), but now inventory is so low that it is a positive that inventory is increasing. This will also slow house price increases (I think that will be a positive for housing too - a more normal market).
8) The MBA purchase index is skewed by large lenders. Over the last few years, small lenders (many not included in the MBA survey) have focused on purchase applications (they market through real estate channels and charge lower fees than the large lenders). Other data suggests mortgage applications are mostly flat year-over-year. UPDATE: The MBA told me they have expanded coverage of the index to include many smaller purchase focused lenders. The MBA doesn't believe their data is "skewed" by the large lenders.
9) Investor buying is declining.
Housing is a slow moving market - and the recovery will not be smooth or fast with all the residual problems. But overall housing is clearly improving and the outlook remains positive for the next few years.
Zillow: Case-Shiller House Price Index expected to slow to 11.9% year-over-year increase in March
by Calculated Risk on 5/06/2014 11:23:00 AM
The Case-Shiller house price indexes for February were released last week (CoreLogic this morning). Zillow has started forecasting Case-Shiller a month early - and I like to check the Zillow forecasts since they have been pretty close.
It looks like the year-over-year change for Case-Shiller will continue to slow. From Zillow: Finally…We’re Seeing More of the Slowdown
The Case-Shiller data for February 2014 came out [last week], and based on this information and the March 2014 Zillow Home Value Index (ZHVI, released April 21), we predict that next month’s Case-Shiller data (March 2014) will show that the non-seasonally adjusted (NSA) 20-City Composite Home Price Index and the NSA 10-City Composite Home Price Index increased 11.9 and 12.1 percent on a year-over-year basis, respectively. The seasonally adjusted (SA) month-over-month change from February to March will be 0.8 percent for the 20-City Composite Index and 0.7 percent for the 10-City Composite Home Price Index (SA). All forecasts are shown in the table below. Officially, the Case-Shiller Composite Home Price Indices for March will not be released until Tuesday, May 27.The Case-Shiller Comp 20 was up 13.7% year-over-year (YoY) in November, up 13.4% YoY in December, 13.2% in January, and up 12.9% YoY in February - and will probably be around 11.9% YoY in March - so the index appears to be slowing down.
| Zillow March 2014 Forecast for Case-Shiller Index | |||||
|---|---|---|---|---|---|
| Case Shiller Composite 10 | Case Shiller Composite 20 | ||||
| NSA | SA | NSA | SA | ||
| Case Shiller (year ago) | Mar 2013 | 161.13 | 165.55 | 148.44 | 152.58 |
| Case-Shiller (last month) | Feb 2014 | 179.96 | 184.04 | 165.35 | 169.21 |
| Zillow Forecast | YoY | 12.1% | 12.1% | 11.9% | 11.9% |
| MoM | 0.4% | 0.7% | 0.5% | 0.8% | |
| Zillow Forecasts1 | 180.7 | 185.5 | 166.1 | 170.7 | |
| Current Post Bubble Low | 146.45 | 149.81 | 134.07 | 137.10 | |
| Date of Post Bubble Low | Mar-12 | Feb-12 | Mar-12 | Jan-12 | |
| Above Post Bubble Low | 23.4% | 23.8% | 23.9% | 24.5% | |
| 1Estimate based on Year-over-year and Month-over-month Zillow forecasts | |||||
CoreLogic: House Prices up 11.1% Year-over-year in March
by Calculated Risk on 5/06/2014 09:32:00 AM
Notes: This CoreLogic House Price Index report is for March. The recent Case-Shiller index release was for February. The CoreLogic HPI is a three month weighted average and is not seasonally adjusted (NSA).
From CoreLogic: CoreLogic Reports Home Prices Rise by 11.1 Percent Year Over Year in March
Home prices nationwide, including distressed sales, increased 11.1 percent in March 2014 compared to March 2013. This change represents 25 months of consecutive year-over-year increases in home prices nationally. On a month-over-month basis, home prices nationwide, including distressed sales, increased 1.4 percent in March 2014 compared to February 2014.
Excluding distressed sales, home prices nationally increased 9.5 percent in March 2014 compared to March 2013 and 0.9 percent month over month compared to February 2014. Distressed sales include short sales and real estate owned (REO) transactions.
“March data on new and existing home sales was weaker than expected and is a cause for concern as we enter the spring buying season,” said Dr. Mark Fleming, chief economist for CoreLogic. “Interest rate-disenfranchised potential sellers are adding to the existing shadow inventory, while buyers who can't find what they want to buy are on the sidelines creating a new kind of 'shadow demand.' This supply and demand imbalance continues to drive home prices higher, even though transaction volumes are lower than expected.”
 Click on graph for larger image.
 This graph shows the national CoreLogic HPI data since 1976. January 2000 = 100.
The index was up 1.4% in March, and is up 11.1% over the last year. This index is not seasonally adjusted, so this was a strong month-to-month gain during the "weak" season.
 The second graph is from CoreLogic. The year-over-year comparison has been positive for twenty five consecutive months suggesting house prices bottomed early in 2012 on a national basis (the bump in 2010 was related to the tax credit).
I expect the year-over-year increases to continue to slow.
Trade Deficit decreased in March to $40.4 Billion
by Calculated Risk on 5/06/2014 08:44:00 AM
The Department of Commerce reported this morning:
[T]otal March exports of $193.9 billion and imports of $234.3 billion resulted in a goods and services deficit of $40.4 billion, down from $41.9 billion in February, revised. March exports were $3.9 billion more than February exports of $190.0 billion. March imports were $2.5 billion more than February imports of $231.8 billion.The trade deficit was close to the consensus forecast of $40.2 billion.
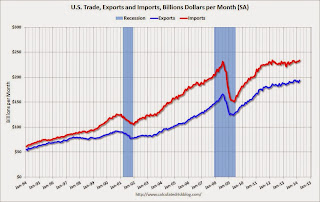
The first graph shows the monthly U.S. exports and imports in dollars through March 2014.
 Click on graph for larger image.
Both imports and exports increased in March.
Exports are 17% above the pre-recession peak and up 5% compared to March 2013; imports are about 1% above the pre-recession peak, and up about 5% compared to March 2013.
The second graph shows the U.S. trade deficit, with and without petroleum, through March.
 The blue line is the total deficit, and the black line is the petroleum deficit, and the red line is the trade deficit ex-petroleum products.
Oil imports averaged $93.91 in March, up from $90.21 in February, and down from $96.95 in March 2013. The petroleum deficit has generally been declining and is the major reason the overall deficit has declined since early 2012.
The trade deficit with China increased to $20.4 billion in March, from $17.9 billion in March 2013. About half of the trade deficit is related to China.
Overall it appears trade is picking up slightly.
Monday, May 05, 2014
Q1 2014 GDP Details on Residential and Commercial Real Estate
by Calculated Risk on 5/05/2014 08:26:00 PM
Tuesday:
• At 8:30 AM ET, Trade Balance report for March from the Census Bureau. The consensus is for the U.S. trade deficit to be at $40.2 billion in March from $42.3 billion in February.
The BEA released the underlying details for the Q1 advance GDP report.
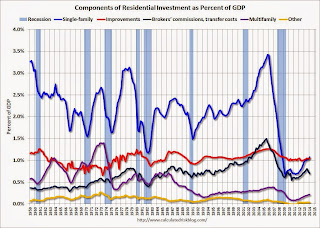
The first graph is for Residential investment (RI) components as a percent of GDP. According to the Bureau of Economic Analysis, RI includes new single family structures, multifamily structures, home improvement, Brokers’ commissions and other ownership transfer costs, and a few minor categories (dormitories, manufactured homes).
A few key points:
1) Investment in single family structures is now back to being the top category for the first time in 22 quarters. Home improvement was the top category for twenty one consecutive quarters following the housing bust ... but now investment in single family structures is the top category once again.
2) Even though investment in single family structures has increased significantly from the bottom, single family investment is still very low - and still below the bottom for previous recessions. I expect further increases over the next few years.
3) Look at the contribution from Brokers’ commissions and other ownership transfer costs. This is the category mostly related to existing home sales (this is the contribution to GDP from existing home sales). If existing home sales decline due to fewer foreclosures, this will have little impact on total residential investment.
 Click on graph for larger image.
Investment in home improvement was at a $179 billion Seasonally Adjusted Annual Rate (SAAR) in Q1 (just over 1.0% of GDP). Investment in single family structures was $184 billion (SAAR) (almost 1.1% of GDP).
The second graph shows investment in offices, malls and lodging as a percent of GDP. Office, mall and lodging investment has increased recently, but from a very low level.
Investment in offices is down about 49% from the recent peak (as a percent of GDP) and increasing slowly. The office vacancy rate is still very high, so any increase in investment will probably be small.
 Investment in multimerchandise shopping structures (malls) peaked in 2007 and is down about 57% from the peak (note that investment includes remodels, so this will not fall to zero). The vacancy rate for malls is still very high, so investment will probably stay low for some time.
Lodging investment peaked at 0.31% of GDP in Q3 2008 and is down about 60%. With the hotel occupancy rate close to normal, it is likely that hotel investment will probably continue to increase.
These graphs show there is currently very little investment in offices, malls and lodging - but that investment is starting to increase. And residential investment is generally increasing, but from a very low level.
Weekly Update: Housing Tracker Existing Home Inventory up 8.6% year-over-year on May 5th
by Calculated Risk on 5/05/2014 04:38:00 PM
Here is another weekly update on housing inventory ...
There is a clear seasonal pattern for inventory, with the low point for inventory in late December or early January, and then usually peaking in mid-to-late summer.
The Realtor (NAR) data is monthly and released with a lag (the most recent data was for March). However Ben at Housing Tracker (Department of Numbers) has provided me some weekly inventory data for the last several years.
 Click on graph for larger image.
This graph shows the Housing Tracker reported weekly inventory for the 54 metro areas for 2010, 2011, 2012, 2013 and 2014.
In 2011 and 2012, inventory only increased slightly early in the year and then declined significantly through the end of each year.
In 2013 (Blue), inventory increased for most of the year before declining seasonally during the holidays. Inventory in 2013 finished up 2.7% YoY compared to 2012.
Inventory in 2014 (Red) is now 8.6% above the same week in 2013.
Inventory is still very low - still below the level in 2012 (yellow) when prices started increasing - but this increase in inventory should slow house price increases.
Note: One of the key questions for 2014 will be: How much will inventory increase? My guess is inventory will be up 10% to 15% year-over-year by the end of 2014 (inventory would still be below normal).


