by Calculated Risk on 8/31/2013 03:51:00 PM
Saturday, August 31, 2013
Unofficial Problem Bank list declines to 707 Institutions
This is an unofficial list of Problem Banks compiled only from public sources.
Here is the unofficial problem bank list for August 30, 2013.
Changes and comments from surferdude808:
This week, the FDIC finally released industry results for the second quarter and its enforcement actions through July. For the week, there were 11 removals and four additions. The changes leave the Unofficial Problem Bank List holding 707 institutions with assets of $250.6 billion. A year ago, the list held 891 institutions with assets of $331.5 billion. For the month, the list declined by a net 22 institutions and dropped $102 billion of assets. Monthly activity included six additions, one unassisted merger, four failures, and 23 action terminations, which was the most action terminations in a month since 25 cures in April 2012. With second quarter industry results, the FDIC said there are 559 institutions with assets of $192 billion on the Official Problem Bank List. The difference between the two lists dropped by one institution to 148. We had anticipated for the difference to narrow to about 135.CR Note: The first unofficial problem bank list was published in August 2009 with 389 institutions. The list peaked at 1,002 institutions on June 10, 2011, and is now down to 707.
The FDIC terminated actions against Inland Bank and Trust, Oak Brook, IL ($1.0 billion); Highland Bank, Saint Michael, MN ($429 million); Community Bank of Oak Park River Forest, Oak Park, IL ($272 million); First Southwest Bank, Alamosa, CO ($237 million); Signature Bank, Bad Axe, MI ($224 million); The Union Bank, Marksville, LA ($219 million); Community Trust & Banking Company, Ooltewah, TN ($131 million); Metropolitan Bank, Oakland, CA ($128 million); Cambridge State Bank, Cambridge, MN ($69 million); Elysian Bank, Elysian, MN ($42 million); and Vermont State Bank, Vermont, IL ($17 million).
Additions this week include United International Bank, Flushing, NY ($177 million); State Bank of Taunton, Taunton, MN ($71 million); Allendale County Bank, Fairfax, SC ($59 million); and Citizens Bank of Chatsworth, Chatsworth, IL ($48 million).
Not much new to report on Capitol Bancorp Ltd. other than its outside counsel squawking at the FDIC labeling its actions "imprudent and counterproductive." Within an article published by SNL Securities - Capitol Bancorp legal rep slams FDIC's 'imprudent and counterproductive actions', Andrew Sandler, chairman of BuckleySandler LLP, said "The FDIC is operating with extraordinary powers and seems all too willing to ignore judges, experts and others in effecting closures." Five banks controlled by Capital Bancorp have failed, which have cost the bank insurance fund an estimated 48 million. The FDIC could utilize the cross-guaranty provisions of FIRREA to assess the cost of the failures against the remaining banks controlled by Capitol Bancorp, which could lead to their failure.
Schedule for Week of September 1st
by Calculated Risk on 8/31/2013 08:33:00 AM
The key report this week is the August employment report on Friday.
Other key reports include the ISM manufacturing report on Tuesday, the trade deficit on Wednesday, and August auto sales also on Wednesday.
All US markets will be closed in observance of the Labor Day holiday.
Early: The LPS July Mortgage Monitor report. This is a monthly report of mortgage delinquencies and other mortgage data.
9:00 AM: The Markit US PMI Manufacturing Index for August. The consensus is for the index to increase to 53.9 from 53.7 in July.
 10:00 AM ET: ISM Manufacturing Index for August. The consensus is for an derease to 53.8 from 55.4 in July. Based on the regional surveys, a decrease in August seems likely.
Here is a long term graph of the ISM manufacturing index.
The ISM manufacturing index indicated expansion in 55.4% in July. The employment index was at 54.4%, and the new orders index was at 58.3%.
10:00 AM: Construction Spending for July. The consensus is for a 0.3% increase in construction spending.
7:00 AM: The Mortgage Bankers Association (MBA) will release the results for the mortgage purchase applications index.
 All day: Light vehicle sales for August. The consensus is for light vehicle sales to increase to 15.8 million SAAR in August (Seasonally Adjusted Annual Rate) from 15.7million SAAR in July.
This graph shows light vehicle sales since the BEA started keeping data in 1967. The dashed line is the July sales rate.
 8:30 AM: Trade Balance report for July from the Census Bureau.
 Imports decreased in June, and exports increased.
The consensus is for the U.S. trade deficit to increase to $39.0 billion in July from $34.2 billion in June.
2:00 PM: Federal Reserve Beige Book, an informal review by the Federal Reserve Banks of current economic conditions in their Districts.
8:15 AM: The ADP Employment Report for August. This report is for private payrolls only (no government). The consensus is for 177,000 payroll jobs added in August, down from 200,000 in July.
8:30 AM: The initial weekly unemployment claims report will be released. The consensus is for claims to decrease to 330 thousand from 331 thousand last week.
10:00 AM: ISM non-Manufacturing Index for August. The consensus is for a reading of 55.0, down from 56.0 in July. Note: Above 50 indicates expansion, below 50 contraction.
10:00 AM: Manufacturers' Shipments, Inventories and Orders (Factory Orders) for July. The consensus is for a 3.4% decrease in orders.
10:00 AM: Trulia Price Rent Monitors for August. This is the index from Trulia that uses asking house prices adjusted both for the mix of homes listed for sale and for seasonal factors.
8:30 AM: Employment Report for August. The consensus is for an increase of 175,000 non-farm payroll jobs in August; the economy added 162,000 non-farm payroll jobs in June.
The consensus is for the unemployment rate to be unchanged at 7.4 in August.
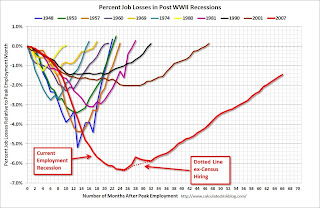
The following graph shows the percentage of payroll jobs lost during post WWII recessions through July.
 The economy has added 7.3 million private sector jobs since employment bottomed in February 2010 (6.7 million total jobs added including all the public sector layoffs).
There are still 1.5 million fewer private sector jobs now than when the recession started in 2007.
Friday, August 30, 2013
Vehicle Sales: Another strong month in August
by Calculated Risk on 8/30/2013 08:30:00 PM
Note: The automakers will report August vehicle sales on Wednesday, Sept 4th.
According the Bureau of Economic Analysis (BEA), light vehicle sales in July were at a 15.7 million rate, on a seasonally adjusted annual rate (SAAR) basis. It looks like August sales will be in the same range.
Here are a few forecasts:
From Kelley Blue Book: Crossovers, Pickup Trucks Lift August Sales Nearly 14 Percent, According To Kelley Blue Book
In August, new light-vehicle sales, including fleet, are expected to hit 1,460,000 units, up 13.6 percent from August 2012 and up 11.0 percent from July 2013.Press Release: J.D. Power and LMC Automotive Report: August New-Vehicle Sales Reach Highest Level in Seven Years
The seasonally adjusted annual rate (SAAR) for August 2013 is estimated to be 15.6 million, up from 14.5 million in August 2012 and down from 15.8 million in July 2013.
With consistency in the fleet environment, total light-vehicle sales in August 2013 are also expected to increase by 12 percent from August 2012 to 1,495,400. Fleet sales are expected to account for 15 percent of total sales, with volume of 225,000 units.From TrueCar: August 2013 New Car Sales Expected to Be Up 14.4 Percent According to TrueCar; August 2013 SAAR at 15.75M, Highest August SAAR since 2007
PIN and LMC data show total sales reaching a 16 million unit SAAR in August, which is the highest since November 2007, with actual unit sales the highest since May 2007.
For August 2013, new light vehicle sales in the U.S. (including fleet) is expected to be 1,464,214 units, up 14.4 percent from August 2012 and up 11.8% percent from July 2013 (on an unadjusted basis).The analyst consensus is for sales of 15.8 million SAAR in August.
The August 2013 forecast translates into a Seasonally Adjusted Annualized Rate ("SAAR") of 15.75 million new car sales
Fannie Mae: Mortgage Serious Delinquency rate declined in July, Lowest since December 2008
by Calculated Risk on 8/30/2013 04:14:00 PM
Fannie Mae reported today that the Single-Family Serious Delinquency rate declined in July to 2.70% from 2.77% in June. The serious delinquency rate is down from 3.50% in July 2012, and this is the lowest level since December 2008.
The Fannie Mae serious delinquency rate peaked in February 2010 at 5.59%.
Earlier Freddie Mac reported that the Single-Family serious delinquency rate declined in July to 2.70% from 2.79% in June. Freddie's rate is down from 3.42% in July 2012, and this is the lowest level since April 2009. Freddie's serious delinquency rate peaked in February 2010 at 4.20%..
Note: These are mortgage loans that are "three monthly payments or more past due or in foreclosure".
 Click on graph for larger image
The Fannie Mae serious delinquency rate has fallen 0.8 percentage points over the last year, and at that pace the serious delinquency rate will be under 1% in just under 2 years. Note: The "normal" serious delinquency rate is under 1%.
Maybe serious delinquencies will be back to normal in mid-2015.
Chemical Activity Barometer for August shows "Economy on the Upswing"
by Calculated Risk on 8/30/2013 01:09:00 PM
This is a new indicator that I'm following that appears to be a leading indicator for the economy.
From the American Chemistry Council: Leading Economic Indicator Shows U.S. Economy on the Upswing; Consumer-Driven Production Gains Strengthen
The pendulum of the U.S. economy remains on the upswing, according to the American Chemistry Council’s (ACC) monthly Chemical Activity Barometer (CAB), released today. The economic indicator, shown to lead U.S. business cycles by an average of eight months at cycle peaks, increased 0.1 percent over July on a three-month moving average (3MMA) basis, marking its fourth consecutive monthly gain. The barometer is now up 3.8 percent over a year ago, the largest year-over-year increase since September 2010. The index itself is at its highest point since June 2008. Prior CAB readings for March through July were all revised.
“As we approach the fourth quarter, the U.S. economy seems to be making strides, compared to the baby steps of earlier in the year,” said Dr. Kevin Swift, chief economist at the American Chemistry Council. “The Chemical Activity Barometer is showing a strengthening of year-over-year growth and suggests an economy which finally may be gaining momentum,” he added.
 Click on graph for larger image.
This graph shows the year-over-year change in the 3-month moving average for the Chemical Activity Barometer compared to Industrial Production. It does appear that CAB (red) generally leads Industrial Production (blue).
And this suggests that economic activity is increasing.
Final August Consumer Sentiment at 82.1
by Calculated Risk on 8/30/2013 09:55:00 AM

Click on graph for larger image.
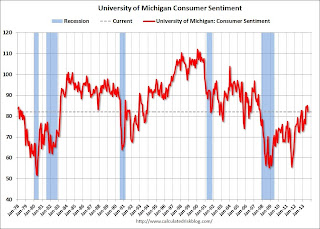
The final Reuters / University of Michigan consumer sentiment index for August was at 82.1, down from the July reading of 85.1, but up from the preliminary August reading of 80.0.
This was above the consensus forecast of 80.0. Sentiment has generally been improving following the recession - with plenty of ups and downs - and one big spike down when Congress threatened to "not pay the bills" in 2011. Unfortunately Congress is once again threatening to "not pay the bills" and that might impact sentiment (and consumer spending) late in September or in October.
Personal Income increased 0.1% in July, Spending increased 0.1%
by Calculated Risk on 8/30/2013 08:30:00 AM
The BEA released the Personal Income and Outlays report for July:
Personal income increased $14.1 billion, or 0.1 percent, ... in July, according to the Bureau of Economic Analysis. Personal consumption expenditures (PCE) increased $16.3 billion, or 0.1 percent.Core PCE increased at a 2.6% annual rate in July, but only a 1.2% annual rate in Q2.
...
Real PCE -- PCE adjusted to remove price changes -- increased less than 0.1 percent in July, compared with an increase of 0.2 percent in June. ... The price index for PCE increased 0.1 percent in July, compared with an increase of 0.4 percent in June. The PCE price index, excluding food and energy, increased 0.1 percent, compared with an increase of 0.2 percent.
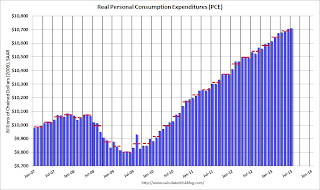
The following graph shows real Personal Consumption Expenditures (PCE) through July (2009 dollars). Note that the y-axis doesn't start at zero to better show the change.
 Click on graph for larger image.
The dashed red lines are the quarterly levels for real PCE.
This is a slow start to Q3.
On inflation, the PCE price index increased at a 1.1% annual rate in July, and core PCE prices increased only at a 0.9% annual rate.
Thursday, August 29, 2013
Friday: July Personal Income and Outlays, Chicago PMI, Consumer Sentiment
by Calculated Risk on 8/29/2013 07:52:00 PM
Back in June I posted four charts that I'm using to track when the Fed will start tapering the QE3 purchases.
Here is an update to the GDP chart including the 2nd estimate of GDP released this morning (Q2 GDP growth was revised up to annual rate of 2.5% from the 1.7% advance estimate). Note: Here are the most recent updates to the four charts. I'll update two more charts tomorrow (PCE and core inflation).
At the June FOMC press conference, Fed Chairman Ben Bernanke said:
"If the incoming data are broadly consistent with this forecast, the Committee currently anticipates that it would be appropriate to moderate the monthly pace of purchases later this year. And if the subsequent data remain broadly aligned with our current expectations for the economy, we would continue to reduce the pace of purchases in measured steps through the first half of next year, ending purchases around midyear. In this scenario, when asset purchases ultimately come to an end, the unemployment rate would likely be in the vicinity of 7%, with solid economic growth supporting further job gains, a substantial improvement from the 8.1% unemployment rate that prevailed when the committee announced this program."
 Click on graph for larger image.
The current forecast is for GDP to increase between 2.3% and 2.6% from Q4 2012 to Q4 2013.
Combined the first and second quarter were below the FOMC projections. GDP would have to increase at a 2.8% annual rate in the 2nd half to reach the FOMC lower projection, and at a 3.3% rate to reach the higher projection.
Friday:
• 8:30 AM ET, Personal Income and Outlays for July. The consensus is for a 0.2% increase in personal income in June, and for a 0.3% increase in personal spending. And for the Core PCE price index to increase 0.2%.
• At 9:45 AM, the Chicago Purchasing Managers Index for August. The consensus is for an increase to 53.0, up from 52.3 in July.
• At 9:55 AM, the Reuter's/University of Michigan's Consumer sentiment index (final for July). The consensus is for a reading of 80.0.
Lawler: Regulators “Caving” on QRM
by Calculated Risk on 8/29/2013 04:09:00 PM
From housing economist Tom Lawler:
Six federal agencies on Wednesday issued a notice revising a proposed rule requiring sponsors of securitization transactions to retain risk in those transactions. The new proposal revises a proposed rule the agencies issued in 2011 to implement the risk retention requirement in the Dodd-Frank Wall Street Reform and Consumer Protection Act (Dodd-Frank Act) .
After intense lobbying and political pressure, the agencies have reluctantly agreed “to define QRMs to have the same meaning as the term qualified mortgages as defined by the Consumer Financial Protection Bureau.” The agencies also changed its original proposal that risk-retention requirements would be based on the par value of securities issued and included a “premium recapture provision; the new proposal has risk retention based on “fair value measurements without a premium capture provision.”
The agencies requested comments on whether an alternative definition of QRM should include “certain underwriting standards in addition to the qualified mortgage criteria.” With the exception of the DTI and verification requirements, the QM doesn’t really have underwriting “standards related to risk.
The “Dodd-Frank Act” had, among other things, two “definitions” of mortgages: “qualified mortgages,” to be defined by the CFPB and focusing on a borrower’s “ability to pay;” and “qualified residential mortgages,” to be defined by six regulatory agencies, focusing on mortgages with underwriting and product features related to the probability of default. A “qualified mortgage” would give lenders something of a “safe harbor” against future litigation, while a “qualified residential mortgage” would be exempt from risk-retention requirements associated with issuing mortgage-backed securities.
In setting the “qualified mortgage” definition, the CFPB focused on (1) product features); (2) up-front fees charged; (3) verification of relevant borrower information; and (4) a maximum backend debt-to-income ratio (and implicitly a maximum front-end ratio) of 43% (with some exceptions). While the CFPB gave a list of factors creditors must consider in determining a borrower’s ability to pay, it did not dictate that creditors follow any particular underwriting model. In defining a “QM” the CFPB did not take into account many extremely important variables/factors that impact the probability that a mortgagor will default.
The original intent of the Dodd-Frank “risk retention” rule was to make sure that issuers/originators had “skin in the game,” which it was hoped would better align the interests of issuers/originators and investors. Mortgage and real-estate industry lobbyists argued that “low-risk” mortgages should be exempt from the risk-retention requirement. While this exemption didn’t make any sense – after all, the proposed legislation required a 5% retention of “risk,” meaning that issuers/originators of “low-risk” mortgages backing a private-label MBS would have to retain 5% of a “low” amount of risk -- legislators succumbed to the lobbying and introduced the “QRM” concept into the final Dodd-Frank bill – relegating the definition to regulatory agencies, but requiring that QRMs be mortgages with “underwriting and product features that historical loan performance data indicate result in a lower risk of default.”
In their preliminary proposed definition of a “QRM,” regulators tried to define a QRM as a mortgage with so little risk that risk-retention to ensure mortgage players would have “skin in the game” was “unimportant.” Not surprisingly, the original proposed definition of a QRM included a hefty (20% down) down payment, a DTI no greater than 36%, had restrictions on a borrower’s credit, and excluded most of the loan features excluded from a QM.
The real estate and mortgage industry lobbyists who had argued for a QRM exemption were stunned, even though the regulators’ “framework” of (1) assuming that risk-retention was a “good thing” (and should be applied to the bulk of mortgages backing private-label RMBS), and (2) only “extremely” low risk mortgages should be exempted from this requirement made perfect sense.
Real estate and mortgage industry folks started lobbying hard against this QRM proposal, and (1) massively inflated the “costs” to issuers/originators of the risk-retention requirement – which would be based on to consumers; (2) argued that many potential borrowers would be excluded from getting mortgage credit; and (3) argued that having a QM definition that differed from a QRM definition would add to the growing regulatory burden being placed on mortgage lenders, and lobbied extremely hard to make the two definitions the same – even though the legislation explicitly differentiated between the two. This latter argument was mildly humorous, in that the only reason the legislation HAD both a QM and a QRM was because of real estate and mortgage industry lobbyists!
An alternative and more logical approach would have been for regulators to decide that there simply WAS no mortgage that was so inherently low risk that it made sense to exempt such a mortgage from the risk-retention requirement, which would effectively have eliminated the concept of a QRM. If they had done so, then the “burden” on the industry of having both a QM and a QRM would have been lifted.
Making the QM and the QRM essentially the same pretty much violates the intent of the Dodd-Frank law, in that the QM definition has very little to do with risk, while the QRM was explicitly supposed to be related to risk. E.g., a 30-year fully amortizing loan with no down payment to a borrower with a FICO score of 580, no current debt outstanding but also hardly any assets, and a front-end debt-to-income ratio of 43% would be deemed a qualified mortgage, even though by any standard such a mortgage would be viewed as extremely risky! An interest-only loan to an extremely wealthy borrower with an 800 credit score who made a 40% down payment would not be a QM.
If the current proposal is finalized as is, then the risk-retention requirement for private-label RMBS, which was very explicitly designed to better align the interests of issuers/originators and investors, will effectively be gone.
That may not be bad, in that it was not clear if a 5% risk-retention requirement would really alter behavior. However, risk retention was a clear INTENT of legislators in Dodd-Frank, and real-estate and mortgage lobbyists have effectively eliminated it for the vast bulk of mortgages that will be originated.
FDIC reports $42.2 Billion Earnings for Insured Institutions, Fewer Problem banks, Residential REO Declines in Q2
by Calculated Risk on 8/29/2013 01:02:00 PM
The FDIC reported FDIC-Insured Institutions Earned $42.2 Billion in the Second Quarter of 2013
Commercial banks and savings institutions insured by the Federal Deposit Insurance Corporation (FDIC) reported aggregate net income of $42.2 billion in the second quarter of 2013, a $7.8 billion (22.6 percent) increase from the $34.4 billion in profits that the industry reported a year earlier. This is the 16th consecutive quarter that earnings have registered a year-over-year increase. Increased noninterest income, lower noninterest expenses, and reduced provisions for loan losses accounted for the increase in earnings from a year ago.The FDIC reported the number of problem banks declined:
The number of problem banks continued to decline. The number of banks on the FDIC's "Problem List" declined from 612 to 553 during the quarter. The number of "problem" banks is down nearly 40 percent from the recent high of 888 institutions at the end of first quarter 2011. Twelve FDIC-insured institutions failed in the second quarter of 2013, up from four failures in the first quarter. Thus far in 2013, there have been 20 failures, compared to 40 during the same period in 2012.
 Click on graph for larger image.
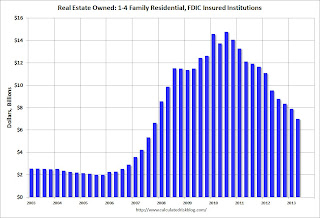
This graph shows the dollar value of Residential REO for FDIC insured institutions. Note: The FDIC reports the dollar value and not the total number of REOs.
The dollar value of 1-4 family residential Real Estate Owned (REOs, foreclosure houses) declined from $7.89 billion in Q1 to $6.98 Billion in Q2. This is the lowest level of REOs since Q4 2007. The dollar value of FDIC insured REO peaked at $14.8 Billion in Q3 2010.
Even in good times, the FDIC insured institutions have about $2.5 billion in residential REO, so the FDIC insured institutions are about two-thirds of the way back to normal levels.


