by Calculated Risk on 2/25/2013 01:02:00 PM
Monday, February 25, 2013
LPS: House Price Index increased 0.1% in December, Up 5.8% year-over-year
Notes: I follow several house price indexes (Case-Shiller, CoreLogic, LPS, Zillow, FNC and more). The timing of different house prices indexes can be a little confusing. LPS uses December closings only (not a three month average like Case-Shiller or a weighted average like CoreLogic), excludes short sales and REOs, and is not seasonally adjusted.
From LPS: U.S. Home Prices Up 0.1 Percent for the Month; Up 5.8 Percent Year-Over-Year
Lender Processing Services ... today released its latest LPS Home Price Index (HPI) report, based on December 2012 residential real estate transactions. The The LPS HPI combines the company’s extensive property and loan-level databases to produce a repeat sales analysis of home prices as of their transaction dates every month for each of more than 15,500 U.S. ZIP codes. The LPS HPI represents the price of non-distressed sales by taking into account price discounts for REO and short sales.The LPS HPI is off 21.9% from the peak in June 2006. Note: The press release has data for the 20 largest states, and 40 MSAs. LPS shows prices off 52.3% from the peak in Las Vegas, 44.2% off from the peak in Riverside-San Bernardino, CA (Inland Empire), and at a new peak in Austin!
Looking at the year-over-year price change throughout 2012 - in May, the LPS HPI turned positive and was up 0.4% year-over-year, in June the index was up 0.9% year-over-year, 1.8% in July, 2.6% in August, 3.6% in September, 4.3% in October, 5.1% in November, and now 5.8% in December. These steady increases on a year-over-year basis suggest prices bottomed early in 2012.
Note: Case-Shiller for December will be released Tuesday morning.
Dallas Fed: Regional Manufacturing Activity increases in February but at a Slower Pace
by Calculated Risk on 2/25/2013 10:39:00 AM
From the Dallas Fed: Texas Manufacturing Activity Increases but at a Slower Pace
Texas factory activity expanded in February, according to business executives responding to the Texas Manufacturing Outlook Survey. The production index, a key measure of state manufacturing conditions, fell from 12.9 to 6.2, suggesting growth continued but at a slower pace.This was slightly below expectations of a reading of 4.0 for the general business activity index and suggest sluggish growth.
... The new orders index was positive for the second month in a row, although it fell from 12.2 to 2.8.
... The general business activity index was positive for the third month in a row, although it dipped from 5.5 to 2.2.
Labor market indicators were mixed in February. Hiring slowed with the employment index moving down to 2.0, and about 17 percent of employers reporting hiring and 15 percent noting layoffs. The average workweek index dipped into negative territory with a reading of –3.0, suggesting hours worked declined.
Expectations regarding future business conditions continued to reflect optimism. The index of future general business activity edged up from 9.2 to 10.8. The index of future company outlook remained unchanged at 20.1.
Chicago Fed: "Economic Growth Moderated in January"
by Calculated Risk on 2/25/2013 08:37:00 AM
The Chicago Fed released the national activity index (a composite index of other indicators): Economic Growth Moderated in January
Led by declines in production-related indicators, the Chicago Fed National Activity Index (CFNAI) decreased to –0.32 in January from +0.25 in December. Three of the four broad categories of indicators that make up the index decreased from December, and only two of the four categories made positive contributions to the index in January.This graph shows the Chicago Fed National Activity Index (three month moving average) since 1967.
The index’s three-month moving average, CFNAI-MA3, increased to +0.30 in January from +0.23 in December. Given the substantial upward revisions for November and December, January’s CFNAI-MA3 marked the third consecutive reading above zero. Additionally, January’s reading suggests that growth in national economic activity was somewhat above its historical trend. The economic growth reflected in this level of the CFNAI-MA3 suggests limited inflationary pressure from economic activity over the coming year.
emphasis added
 Click on graph for larger image.
This suggests economic activity "moderated" in January, and growth was somewhat above its historical trend (using the three-month average).
According to the Chicago Fed:
What is the National Activity Index? The index is a weighted average of 85 indicators of national economic activity drawn from four broad categories of data: 1) production and income; 2) employment, unemployment, and hours; 3) personal consumption and housing; and 4) sales, orders, and inventories.
A zero value for the index indicates that the national economy is expanding at its historical trend rate of growth; negative values indicate below-average growth; and positive values indicate above-average growth.
Sunday, February 24, 2013
Sunday Night Futures
by Calculated Risk on 2/24/2013 09:58:00 PM
I'm frequently asked about the "Sequester". Next week the "Sequester" budget cuts will begin if government does not take any action, and over the next 7 months the sequester will require $85 billion in cuts, about half from defense programs. This is one of those really dumb policies that is hard to stop. The cuts will not be catastrophic, but as we've discussed, the deficit will decline sharply this year already, and we really don't need additional deficit reduction in the near term. Here are a couple of articles on the cuts:
From the WaPo: The big sequester gamble: How badly will the cuts hurt? and White House releases state-by-state breakdown of sequester’s effects
Monday:
• At 8:30 AM ET, the Chicago Fed National Activity Index for January will be released. This is a composite index of other data.
• At 10:30 AM, the Dallas Fed Manufacturing Survey for February will be released. The consensus is a decrease to 4.0 from 5.5 in January (above zero is expansion).
Weekend:
• Summary for Week Ending Feb 22nd
• Schedule for Week of Feb 24th
The Asian markets are mostly up tonight with the Nikkei up 1.9%, and Shanghai Composite up 0.3%.
From CNBC: Pre-Market Data and Bloomberg futures: the S&P futures are down 2 and DOW futures are down 20 (fair value).
Oil prices have moved down a little recently with WTI futures at $93.00 per barrel and Brent at $113.82 per barrel.
Gasoline Prices up over 50 Cents per Gallon since December
by Calculated Risk on 2/24/2013 07:36:00 PM
From CNN: Gas prices jump, but not as high, survey finds
Over the past two weeks, prices at the pump have jumped 20 cents, adding to a total rise of nearly 54 cents over the past nine weeks, according to the Lundberg Survey.In Los Angeles prices are around $4.30 per gallon.
... And now, prices may even start to drop, says publisher Trilby Lundberg.
"I don't mean that gasoline prices cannot go up further from here," she said Sunday. "But the chief causes of the rise are out of the picture."
Crude oil prices are now going down, and wholesale prices -- which marketers and retailers pay -- are "starting to tumble," she said.
Below is a graph from Gasbuddy.com for nationwide gasoline prices. Nationally prices are up over 50 cents per gallon from the low last December, and up 20 cents over the last two weeks. But it does appear the price increases have slowed.
If you click on "show crude oil prices", the graph displays oil prices for WTI, not Brent; gasoline prices in most of the U.S. are impacted more by Brent prices.
| Orange County Historical Gas Price Charts Provided by GasBuddy.com |
Forecast: Solid Auto Sales in February
by Calculated Risk on 2/24/2013 02:18:00 PM
Note: The automakers will report February vehicle sales this coming Friday, March 1st. The consensus is for sales of around 15.2 million SAAR.
From Edmunds.com: Despite Rising Gas Prices, February Auto Sales Strong at Estimated 15.5 Million SAAR, says Edmunds.com
Edmunds.com ... forecasts that 1,198,538 new cars and trucks will be sold in the U.S. in February for an estimated Seasonally Adjusted Annual Rate (SAAR) this month of 15.5 million light vehicles. The projected sales [NSA] will be a 14.9 percent increase from January 2013, and a 4.3 percent increase from February 2012.The following table shows annual light vehicle sales, and the change from the previous year. Light vehicle sales have seen double digit growth for three consecutive years. The 2013 forecast was from Edmunds.com, but it appears sales were above expectations in January and February - and the annual forecast will probably be increased.
“Car sales are persevering despite economic factors on people’s minds like rising gas prices and the implementation of the payroll tax,” says Edmunds.com Senior Analyst Jessica Caldwell. “Pent-up demand and widespread access to credit are keeping up car sales momentum.”
| Light Vehicle Sales | ||
|---|---|---|
| Sales (millions) | Annual Change | |
| 2005 | 16.9 | 0.5% |
| 2006 | 16.5 | -2.6% |
| 2007 | 16.1 | -2.5% |
| 2008 | 13.2 | -18.0% |
| 2009 | 10.4 | -21.2% |
| 2010 | 11.6 | 11.1% |
| 2011 | 12.7 | 10.2% |
| 2012 | 14.4 | 13.4% |
| 20131 | 15.0 | 3.7% |
| 1Forecast | ||
Housing: Some Details on the Business Model for Institutional Buyers
by Calculated Risk on 2/24/2013 10:23:00 AM
Some interesting details on institutional buyers from the Newsobserver.com: California billionaire bets on rentals with Wake home-buying spree (ht Sebastian)
[C]ompanies have raised billions from pension funds, private equity firms and other institutional investors to fuel their buying sprees. To date, these companies have focused their attention mainly on markets with large inventories of distressed homes, particularly in Arizona, Florida, Nevada and California.There is much more in the article. It is interesting that the institutional investors are moving beyond distressed properties, and even buying new homes in some areas.
What’s noteworthy about American Homes 4 Rent’s buying binge in Wake County [North Carolina] is that it isn’t just targeting distressed properties, or even existing homes. About a third of its purchases have been new homes acquired directly from homebuilders.
...
Institutional investors have invested at least $5.4 billion for purchase of single-family rentals nationwide during the past 18 months, according to Barclays, and an additional $8 billion is expected to be invested within the next couple of years. American Homes 4 Rent’s buying spree is being financed in part by a $600 million investment from the Alaska Permanent Fund, a $45 billion fund that invests royalties the state collects from oil companies.
American Homes 4 Rent is targeting homes with about 2,000 square feet that are less than 15 years old and are located in neighborhoods with better-than-average schools. The company paid around $65 to $75 per square foot for the first 1,500 homes it acquired, according to the meeting minutes, and it expects vacancy rates of 5 percent or less in its portfolio.
American Homes 4 Rent hopes to charge monthly rents equal to about 1 percent of the purchase price, and provide returns of about 6.5 percent a year to the Alaska Permanent Fund, according to the board’s meeting minutes. In three to seven years, if the housing market recovers, the portfolio could be sold or be converted into a publicly traded real estate investment trust ...
emphasis added
Yesterday:
• Summary for Week Ending Feb 22nd
• Schedule for Week of Feb 24th
Saturday, February 23, 2013
DOT: Vehicle Miles Driven declined 2.9% in December
by Calculated Risk on 2/23/2013 06:50:00 PM
The Department of Transportation (DOT) reported:
Travel on all roads and streets changed by -2.9% (-7.0 billion vehicle miles) for December 2012 as compared with December 2011. Travel for the month is estimated to be 236.3 billion vehicle miles.The following graph shows the rolling 12 month total vehicle miles driven.
Cumulative Travel for 2012 changed by +0.3% (9.1 billion vehicle miles). The Cumulative estimate for the year is 2,938.5 billion vehicle miles of travel.
Traffic was down in all regions, and down 4.6% in the Northeast. The rolling 12 month total is still moving sideways.
 Click on graph for larger image.
In the early '80s, miles driven (rolling 12 months) stayed below the previous peak for 39 months.
Currently miles driven has been below the previous peak for 61 months - over 5 years - and still counting.
The second graph shows the year-over-year change from the same month in the previous year.
 Gasoline prices were up in December compared to December 2011. In December 2012, gasoline averaged of $3.38 per gallon according to the EIA. In 2011, prices in December averaged $3.33 per gallon.
 However, as I've mentioned before, gasoline prices are just part of the story. The lack of growth in miles driven over the last 5 years is probably also due to the lingering effects of the great recession (high unemployment rate and lack of wage growth), the aging of the overall population (over 55 drivers drive fewer miles) and changing driving habits of young drivers.
With all these factors, it might take several more years before we see a new peak in miles driven. Maybe when we are all riding in self-driving electric cars!
Schedule for Week of Feb 24th
by Calculated Risk on 2/23/2013 01:11:00 PM
Earlier:
• Summary for Week Ending Feb 22nd
This will be a very busy week for economic data. The key reports are the January New Home sales report on Tuesday, the January Personal Income and Outlays report on Friday, and the second estimate of Q4 GDP on Thursday.
Other key reports include Case-Shiller house prices for December on Tuesday, the ISM manufacturing index on Friday, and auto sales also on Friday.
Fed Chairman Ben Bernanke will deliver the Semiannual Monetary Policy Report to the Senate on Tuesday, and to the House on Wednesday.
8:30 AM ET: Chicago Fed National Activity Index for January. This is a composite index of other data.
10:30 AM: Dallas Fed Manufacturing Survey for February. The consensus is a decrease to 4.0 from 5.5 in January (above zero is expansion).
9:00 AM: FHFA House Price Index for December 2012. This was original a GSE only repeat sales, however there is also an expanded index that deserves more attention. The consensus is for a 0.7% increase in house prices.
 9:00 AM: S&P/Case-Shiller House Price Index for December. Although this is the December report, it is really a 3 month average of October, November and December.
 This graph shows the nominal seasonally adjusted Composite 10 and Composite 20 indexes through November 2012 (the Composite 20 was started in January 2000).
The consensus is for a 6.8% year-over-year increase in the Composite 20 index (NSA) for December. The Zillow forecast is for the Composite 20 to increase 6.7% year-over-year, and for prices to increase 0.7% month-to-month seasonally adjusted.
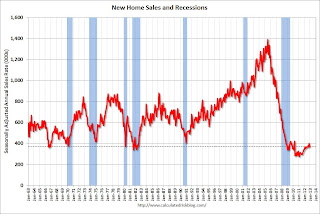 10:00 AM: New Home Sales for January from the Census Bureau.
 This graph shows New Home Sales since 1963. The dashed line is the December sales rate.
The consensus is for an increase in sales to 381 thousand Seasonally Adjusted Annual Rate (SAAR) in January from 369 thousand in December.
10:00 AM: Richmond Fed Survey of Manufacturing Activity for February. The consensus is for a a reading of minus 3 for this survey, up from minus 12 in January (Below zero is contraction).
10:00 AM: Conference Board's consumer confidence index for February. The consensus is for the index to increase to 61.0.
10:00 AM: Fed Chairman Ben S. Bernanke, Semiannual Monetary Policy Report to the Congress, Before the Committee on Banking, Housing, and Urban Affairs, U.S. Senate
7:00 AM: The Mortgage Bankers Association (MBA) will release the results for the mortgage purchase applications index.
8:30 AM: Durable Goods Orders for January from the Census Bureau. The consensus is for a 4.0% decrease in durable goods orders.
10:00 AM ET: Pending Home Sales Index for January. The consensus is for a 3.0% increase in the index.
10:00 AM: Fed Chairman Ben S. Bernanke, Semiannual Monetary Policy Report to the Congress, Before the Committee on Financial Services, U.S. House of Representatives
8:30 AM: The initial weekly unemployment claims report will be released. The consensus is for claims to decrease to 360 thousand from 362 thousand last week.
8:30 AM: Q4 GDP (second estimate). This is the second estimate of GDP from the BEA. The consensus is that real GDP increased 0.5% annualized in Q4, revised up from a negative 0.1% in the advance report.
9:45 AM: Chicago Purchasing Managers Index for February. The consensus is for a decrease to 55.0, down from 55.6 in January.
11:00 AM: Kansas City Fed regional Manufacturing Survey for February.
11:00 AM: The Federal Reserve Bank of New York will release the Q4 2012 Quarterly Report on Household Debt and Credit
8:30 AM ET: Personal Income and Outlays for January. The consensus is for a 2.1% decrease in personal income in January (following the surge in December due to some people taking income early to avoid higher taxes), and for 0.2% increase in personal spending. And for the Core PCE price index to increase 0.2%.
9:55 AM: Reuter's/University of Michigan's Consumer sentiment index (final for February). The consensus is for a reading of 76.0.
 10:00 AM ET: ISM Manufacturing Index for February.
 Here is a long term graph of the ISM manufacturing index. The ISM manufacturing index indicated expansion in January at 53.1% (dashed line). The employment index was at 54.0%, and the new orders index was at 53.3%. The consensus is for PMI to be decline to 52.8%. (above 50 is expansion).
10:00 AM: Construction Spending for January. The consensus is for a 0.6% increase in construction spending.
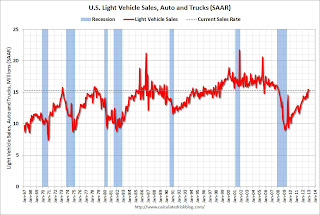 All day: Light vehicle sales for February. The consensus is for light vehicle sales to be at 15.2 million SAAR in February (Seasonally Adjusted Annual Rate) down from 15.3 SAAR in January.
This graph shows light vehicle sales since the BEA started keeping data in 1967. The dashed line is the January sales rate.
Summary for Week ending February 22nd
by Calculated Risk on 2/23/2013 10:30:00 AM
Here is a summary of last week in graphs:
• Housing Starts decreased to 890 thousand SAAR in January, Single Family Starts Increased
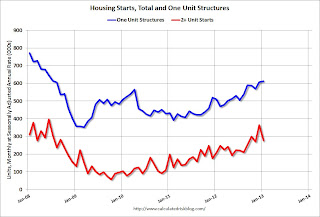 Click on graph for larger image.
From the Census Bureau: "Privately-owned housing starts in January were at a seasonally adjusted annual rate of 890,000. This is 8.5 percent below the revised December estimate of 973,000, but is 23.6 percent above the January 2012 rate of 720,000.
Single-family housing starts in January were at a rate of 613,000; this is 0.8 percent above the revised December figure of 608,000. The January rate for units in buildings with five units or more was 260,000."
The first graph shows single and multi-family housing starts for the last several years.
Multi-family starts (red, 2+ units) decreased sharply in January.
Single-family starts (blue) increased to 613,000 thousand in January and are at the highest level since 2008.
The second graph shows total and single unit starts since 1968.
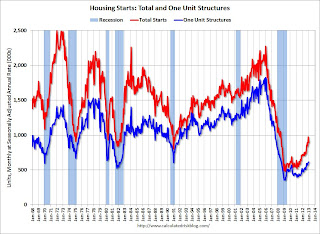 This shows the huge collapse following the housing bubble, and that housing starts have been increasing lately after moving sideways for about two years and a half years.
Total starts are up about 86% from the bottom start rate, and single family starts are up about 74 percent from the post-bubble low.
This was below expectations of 914 thousand starts in January due to the sharp decrease in the volatile multi-family sector. Starts in January were up 23.6% from January 2012.
• Existing Home Sales in January: 4.92 million SAAR, 4.2 months of supply
The NAR reported: January Existing-Home Sales Hold with Steady Price Gains, Seller’s Market Developing
 This graph shows existing home sales, on a Seasonally Adjusted Annual Rate (SAAR) basis since 1993.
 Sales in January 2013 (4.92 million SAAR) were 0.4% higher than last month, and were 9.1% above the January 2012 rate.
According to the NAR, inventory declined to 1.74 million in January down from 1.83 million in December. This is the lowest level of inventory since December 1999. Inventory is not seasonally adjusted, and usually inventory decreases from the seasonal high in mid-summer to the seasonal lows in December and January.
The next graph shows the year-over-year (YoY) change in reported existing home inventory and months-of-supply. Since inventory is not seasonally adjusted, it really helps to look at the YoY change. Note: Months-of-supply is based on the seasonally adjusted sales and not seasonally adjusted inventory.
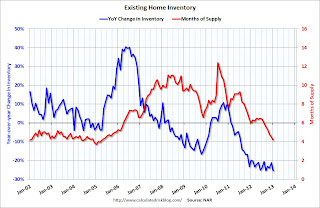 Inventory decreased 25.3% year-over-year in January from January 2012. This is the 23rd consecutive month with a YoY decrease in inventory.
Months of supply declined to 4.2 months in January, the lowest level since April 2005.
This was at expectations of sales of 4.94 million. For existing home sales, the key number is inventory - and the sharp year-over-year decline in inventory is a positive for housing.
• MBA: "Mortgage Delinquency and Foreclosure Rates Finished 2012 Down Sharply"
From the MBA: Mortgage Delinquency and Foreclosure Rates Finished 2012 Down Sharply
 This graph shows the percent of loans delinquent by days past due.
Loans 30 days delinquent decreased to 3.04% from 3.25% in Q3. This is just below 2007 levels and around the long term average.
Delinquent loans in the 60 day bucket decreased to 1.16% in Q4, from 1.19% in Q3.
The 90 day bucket decreased to 2.89% from 2.96%. This is still way above normal (around 0.8% would be normal according to the MBA).
The percent of loans in the foreclosure process decreased to 3.74% from 4.07% and is now at the lowest level since 2008.
 This graph is from the MBA and shows the percent of loans in the foreclosure process by state. Posted with permission.
The top states are Florida (12.15% in foreclosure down from 13.04% in Q3), New Jersey (8.85% down from 8.87%), New York (6.34% down from 6.46%), Illinois (6.33% down from 6.83%), and Nevada (the only non-judicial state in the top 13 at 5.87% down from 5.93%).
As Fratantoni noted, California (2.06% down from 2.63%) and Arizona (2.02% down from 2.51%) are now well below the national average by every measure.
• Key Measures show low inflation in January
 This graph shows the year-over-year change for four key measures of inflation: trimmed-mean CPI, median CPI, CPI less food and energy, and core PCE prices. On a year-over-year basis, the median CPI rose 2.1%, the trimmed-mean CPI rose 1.9%, and the CPI less food and energy rose 1.9%. Core PCE is for December and increased 1.4% year-over-year.
On a monthly basis, median CPI was at 2.6% annualized, trimmed-mean CPI was at 2.2% annualized, and core CPI increased 3.1% annualized. Also core PCE for December increased 0.2% annualized.
The inflation report for February will be released on March 15th, a few days before the next Fed meeting. But with this low level of inflation and the current high level of unemployment, I expect the Fed will keep the "pedal to the metal" at the meeting of March 19th and 20th.
• Weekly Initial Unemployment Claims increased to 362,000
 The DOL reports:
In the week ending February 16, the advance figure for seasonally adjusted initial claims was 362,000, an increase of 20,000 from the previous week's revised figure of 342,000. The 4-week moving average was 360,750, an increase of 8,000 from the previous week's revised average of 352,750.The dashed line on the graph is the current 4-week average. The four-week average of weekly unemployment claims increased to 360,750 - the highest 4-week average since the first week of January.
Weekly claims were above the 359,000 consensus forecast.
• AIA: "Strong Surge for Architecture Billings Index"
Note: This index is a leading indicator primarily for new Commercial Real Estate (CRE) investment.
 From AIA: Strong Surge for Architecture Billings Index
 This graph shows the Architecture Billings Index since 1996. The index was at 54.2 in January, up from 51.2 in December. Anything above 50 indicates expansion in demand for architects' services.
Every building sector is now expanding and new project inquiries are strongly positive. Note: This includes commercial and industrial facilities like hotels and office buildings, multi-family residential, as well as schools, hospitals and other institutions.
According to the AIA, there is an "approximate nine to twelve month lag time between architecture billings and construction spending" on non-residential construction. This suggests some increase in CRE investment in 2013.


