by Calculated Risk on 2/21/2013 10:00:00 AM
Thursday, February 21, 2013
Existing Home Sales in January: 4.92 million SAAR, 4.2 months of supply
The NAR reports: January Existing-Home Sales Hold with Steady Price Gains, Seller’s Market Developing
Total existing-home sales, which are completed transactions that include single-family homes, townhomes, condominiums and co-ops, increased 0.4 percent to a seasonally adjusted annual rate of 4.92 million in January from a downwardly revised 4.90 million in December, and are 9.1 percent above the 4.51 million-unit pace in January 2012.
Total housing inventory at the end of January fell 4.9 percent to 1.74 million existing homes available for sale, which represents a 4.2-month supply 2 at the current sales pace, down from 4.5 months in December, and is the lowest housing supply since April 2005 when it was also 4.2 months.
Listed inventory is 25.3 percent below a year ago when there was a 6.2-month supply. Raw unsold inventory is at the lowest level since December 1999 when there were 1.71 million homes on the market.
 Click on graph for larger image.
This graph shows existing home sales, on a Seasonally Adjusted Annual Rate (SAAR) basis since 1993.
Sales in January 2013 (4.92 million SAAR) were 0.4% higher than last month, and were 9.1% above the January 2012 rate.
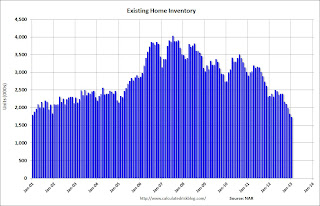
The second graph shows nationwide inventory for existing homes.
 According to the NAR, inventory declined to 1.74 million in January down from 1.83 million in December. This is the lowest level of inventory since December 1999. Inventory is not seasonally adjusted, and usually inventory decreases from the seasonal high in mid-summer to the seasonal lows in December and January.
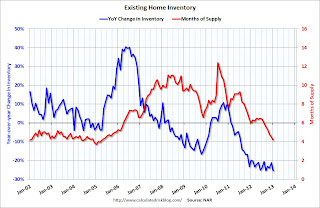
The last graph shows the year-over-year (YoY) change in reported existing home inventory and months-of-supply. Since inventory is not seasonally adjusted, it really helps to look at the YoY change. Note: Months-of-supply is based on the seasonally adjusted sales and not seasonally adjusted inventory.
 Inventory decreased 25.3% year-over-year in January from January 2012. This is the 23rd consecutive month with a YoY decrease in inventory.
Months of supply declined to 4.2 months in January, the lowest level since April 2005.
This was at expectations of sales of 4.94 million. For existing home sales, the key number is inventory - and the sharp year-over-year decline in inventory is a positive for housing. I'll have more later ...
Weekly Initial Unemployment Claims increase to 362,000
by Calculated Risk on 2/21/2013 08:36:00 AM
The DOL reports:
In the week ending February 16, the advance figure for seasonally adjusted initial claims was 362,000, an increase of 20,000 from the previous week's revised figure of 342,000. The 4-week moving average was 360,750, an increase of 8,000 from the previous week's revised average of 352,750.The previous week was revised up from 341,000.
The following graph shows the 4-week moving average of weekly claims since January 2000.

Click on graph for larger image.
The dashed line on the graph is the current 4-week average. The four-week average of weekly unemployment claims increased to 360,750 - the highest 4-week average since the first week of January.
Weekly claims were above the 359,000 consensus forecast.
Wednesday, February 20, 2013
Thursday: Existing Home Sales, MBA's Mortgage Delinquency Survey, Unemployment Claims, CPI and more
by Calculated Risk on 2/20/2013 07:37:00 PM
Tomorrow will be busy ...
Thursday economic releases:
• At 8:30 AM ET, the initial weekly unemployment claims report will be released. The consensus is for claims to increase to 359 thousand from 341 thousand last week.
• Also at 8:30 AM, the Consumer Price Index for January. The consensus is for a 0.1% increase in CPI in January and for core CPI to increase 0.2%.
• At 9:00 AM, The Markit US PMI Manufacturing Index Flash. The consensus is for a decrease to 55.5 from 56.1 in January.
• At 10:00 AM, the January Existing Home Sales report from the National Association of Realtors (NAR). The consensus is for sales of 4.90 million on seasonally adjusted annual rate (SAAR) basis. Sales in December 2012 were 4.94 million SAAR. Economist Tom Lawler is forecasting an increase to a 5.10 million sales rate.
• Also at 10:00 AM, the the Philly Fed manufacturing survey for February. The consensus is for a reading of 1.1, up from minus 5.8 last month (above zero indicates expansion).
• Also at 10:00 AM, the Conference Board Leading Indicators for January will be released. The consensus is for a 0.3% increase in this index.
• Also at 10:00 AM, the MBA's National Mortgage Delinquency Survey for Q4. As usual, I'll be on the conference call (the call is scheduled for 12 PM ET).
FOMC Minutes: "Several participants" support varying QE asset purchases
by Calculated Risk on 2/20/2013 02:14:00 PM
Note: My read is the FOMC is modestly more optimistic on the economic outlook, and are prepared to vary the amount of QE asset purchases based on incoming data.
From the Fed: Minutes of the Federal Open Market Committee, January 29-30, 2013. On the outlook:
In their discussion of the economic situation, meeting participants indicated that they viewed the information received during the intermeeting period as suggesting that, apart from some temporary factors that had led to a pause in overall output growth in recent months, the economy remained on a moderate growth path. In particular, participants saw the economic outlook as little changed or modestly improved relative to the December meeting. Most participants judged that there had been some reduction in downside risks facing the economy: Strains in global financial markets had eased somewhat, and U.S. fiscal policymakers had come to a partial resolution of the so-called fiscal cliff. Supported by a highly accommodative stance of monetary policy, the housing sector was strengthening, and the unemployment rate appeared likely to continue its gradual decline. Nearly all participants anticipated that inflation over the medium-term would run at or below the Committee's 2 percent objective.On varying asset purchases:
emphasis added
Several participants emphasized that the Committee should be prepared to vary the pace of asset purchases, either in response to changes in the economic outlook or as its evaluation of the efficacy and costs of such purchases evolved. For example, one participant argued that purchases should vary incrementally from meeting to meeting in response to incoming information about the economy. A number of participants stated that an ongoing evaluation of the efficacy, costs, and risks of asset purchases might well lead the Committee to taper or end its purchases before it judged that a substantial improvement in the outlook for the labor market had occurred. Several others argued that the potential costs of reducing or ending asset purchases too soon were also significant, or that asset purchases should continue until a substantial improvement in the labor market outlook had occurred. A few participants noted examples of past instances in which policymakers had prematurely removed accommodation, with adverse effects on economic growth, employment, and price stability; they also stressed the importance of communicating the Committee's commitment to maintaining a highly accommodative stance of policy as long as warranted by economic conditions. In this regard, a number of participants discussed the possibility of providing monetary accommodation by holding securities for a longer period than envisioned in the Committee's exit principles, either as a supplement to, or a replacement for, asset purchases.Changes in the size of asset purchases will be something to watch at each FOMC meeting.
Quarterly Housing Starts by Intent compared to New Home Sales
by Calculated Risk on 2/20/2013 12:30:00 PM
I mentioned this yesterday, see: Housing: No "Troubling Divergence" between Completions and Sales. In addition to housing starts for January, the Census Bureau released Housing Starts by Intent for Q4. Note: Most text is a repeat with updated graphs.
First, we can't directly compare single family housing starts to new home sales. For starts of single family structures, the Census Bureau includes owner built units and units built for rent that are not included in the new home sales report. For an explanation, see from the Census Bureau: Comparing New Home Sales and New Residential Construction
We are often asked why the numbers of new single-family housing units started and completed each month are larger than the number of new homes sold. This is because all new single-family houses are measured as part of the New Residential Construction series (starts and completions), but only those that are built for sale are included in the New Residential Sales series.However it is possible to compare "Single Family Starts, Built for Sale" to New Home sales on a quarterly basis.
The quarterly report released this morning showed there were 91,000 single family starts, built for sale, in Q4 2012, and that was above the 84,000 new homes sold for the same quarter, so inventory increased a little (Using Not Seasonally Adjusted data for both starts and sales).
This graph shows the NSA quarterly intent for four start categories since 1975: single family built for sale, owner built (includes contractor built for owner), starts built for rent, and condos built for sale.
 Click on graph for larger image.
Single family starts built for sale were up about 44% compared to Q4 2011. This is still very low, and only back to 2008 levels.
Owner built starts were down slightly from Q3 2011. And condos built for sale are just above the record low.
The 'units built for rent' have increased significantly and are up about 48% year-over-year.
The second graph shows quarterly single family starts, built for sale and new home sales (NSA).
 In 2005, and most of 2006, starts were higher than sales, and inventories of new homes increased. The difference on this graph is pretty small, but the builders were starting about 30,000 more homes per quarter than they were selling (speculative building), and the inventory of new homes soared to record levels. Inventory of under construction and completed new home sales peaked at 477,000 in Q3 2006.
In 2008 and 2009, the home builders started far fewer homes than they sold as they worked off the excess inventory that they had built up in 2005 and 2006.
Now it looks like builders are starting a few more homes than they are selling, and the inventory of under construction and completed new home sales increased slightly to 124,000 in Q4 (this is still near record lows).
Note: new home sales are reported when contracts are signed, so it is appropriate to compare sales to starts (as opposed to completions). This is not perfect because of the handling of cancellations, but it does suggest the builders are keeping inventories under control, and also suggests that the year-over-year increase in housing starts is directly related to an increase in demand and not renewed speculative building.
AIA: "Strong Surge for Architecture Billings Index"
by Calculated Risk on 2/20/2013 09:59:00 AM
Note: This index is a leading indicator primarily for new Commercial Real Estate (CRE) investment.
From AIA: Strong Surge for Architecture Billings Index
As the prognosis for the design and construction industry continues to improve, the Architecture Billings Index (ABI) is reflecting its strongest growth since November 2007. As a leading economic indicator of construction activity, the ABI reflects the approximate nine to twelve month lag time between architecture billings and construction spending. The American Institute of Architects (AIA) reported the January ABI score was 54.2, up sharply from a mark of 51.2* in December. This score reflects a strong increase in demand for design services (any score above 50 indicates an increase in billings). The new projects inquiry index was 63.2, much higher than the reading of 57.9 the previous month.
“We have been pointing in this direction for the last several months, but this is the strongest indication that there will be an upturn in construction activity in the coming months,” said AIA Chief Economist, Kermit Baker, PhD, Hon. AIA. “But as we continue to hear about overall improving economic conditions and that there are more inquiries for new design projects in the marketplace, a continued reservation by lending institutions to supply financing for construction projects is preventing a more widespread recovery in the industry.”
• Regional averages: Midwest (54.4), West (53.4), South (51.7), Northeast (50.3)
• Sector index breakdown: mixed practice (54.9), multi-family residential (54.5), commercial / industrial (52.0), institutional (50.2)
emphasis added
 Click on graph for larger image.
This graph shows the Architecture Billings Index since 1996. The index was at 54.2 in January, up from 51.2 in December. Anything above 50 indicates expansion in demand for architects' services.
Every building sector is now expanding and new project inquiries are strongly positive. Note: This includes commercial and industrial facilities like hotels and office buildings, multi-family residential, as well as schools, hospitals and other institutions.
According to the AIA, there is an "approximate nine to twelve month lag time between architecture billings and construction spending" on non-residential construction. This suggests some increase in CRE investment in 2013.
Housing Starts decrease to 890 thousand SAAR in January, Single Family Starts Increase
by Calculated Risk on 2/20/2013 08:43:00 AM
From the Census Bureau: Permits, Starts and Completions
Housing Starts:
Privately-owned housing starts in January were at a seasonally adjusted annual rate of 890,000. This is 8.5 percent below the revised December estimate of 973,000, but is 23.6 percent above the January 2012 rate of 720,000.
Single-family housing starts in January were at a rate of 613,000; this is 0.8 percent above the revised December figure of 608,000. The January rate for units in buildings with five units or more was 260,000.
Building Permits:
Privately-owned housing units authorized by building permits in January were at a seasonally adjusted annual rate of 925,000. This is 1.8 percent above the revised December rate of 909,000 and is 35.2 percent above the January 2012 estimate of 684,000.
Single-family authorizations in January were at a rate of 584,000; this is 1.9 percent above the revised December figure of 573,000. Authorizations of units in buildings with five units or more were at a rate of 311,000 in January.
 Click on graph for larger image.
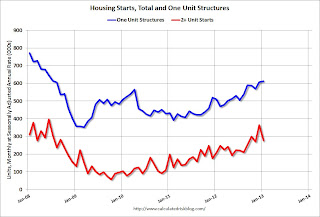
The first graph shows single and multi-family housing starts for the last several years.
Multi-family starts (red, 2+ units) decreased sharply in January.
Single-family starts (blue) increased to 613,000 thousand in January and are at the highest level since 2008.
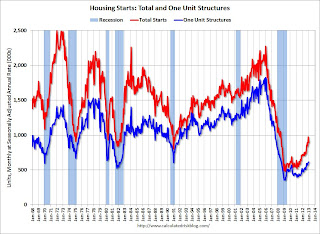
The second graph shows total and single unit starts since 1968.
 This shows the huge collapse following the housing bubble, and that housing starts have been increasing lately after moving sideways for about two years and a half years.
 Total starts are up about 86% from the bottom start rate, and single family starts are up about 74 percent from the post-bubble low.
This was below expectations of 914 thousand starts in January due to the sharp decrease in the volatile multi-family sector. Starts in January were up 23.6% from January 2012. I'll have more later, but this was a solid report.
MBA: Mortgage Applications Decrease, Mortgage Rates increase
by Calculated Risk on 2/20/2013 07:07:00 AM
From the MBA: Mortgage Applications Decrease in Latest MBA Weekly Survey
The Refinance Index decreased 2 percent from the previous week. The seasonally adjusted Purchase Index decreased 2 percent from one week earlier.
...
The refinance share of mortgage activity decreased to 77 percent of total applications, the lowest level since May 2012, from 78 percent the previous week. The adjustable-rate mortgage (ARM) share of activity increased to 4 percent of total applications.
The average contract interest rate for 30-year fixed-rate mortgages with conforming loan balances ($417,500 or less) increased to 3.78 percent, the highest rate since August 2012, from 3.75 percent, with points decreasing to 0.40 from 0.43 (including the origination fee) for 80 percent loan-to-value ratio (LTV) loans.
emphasis added
 Click on graph for larger image.
The first graph shows the refinance index.
The refinance activity is down over the last four weeks, but activity is still very high - and has remained high for over a year.
There has been a sustained refinance boom, and 77 percent of all mortgage applications are for refinancing.
 The second graph shows the MBA mortgage purchase index. The purchase index was off last week - and is still very low, but the index has generally been trending up over the last six months.
This index will probably continue to increase as conventional home purchase activity increases.
Tuesday, February 19, 2013
Wednesday: Housing Starts, FOMC Minutes, PPI and more
by Calculated Risk on 2/19/2013 09:28:00 PM
Oh my. From Bondad Blog, via Invictus (Big Picture), here is a funny parody Hitler "Downfall" parody: ECRI learns that their recession call has blown up (foul language).
Wednesday economic releases:
• At 7:00 AM ET, the Mortgage Bankers Association (MBA) will release the results for the mortgage purchase applications index.
• At 8:30 AM: Housing Starts for January will be released. The consensus is for total housing starts to decrease to 914 thousand (SAAR) in January, down from 954 thousand in December. Note: On a seasonally adjusted annual rate (SAAR) basis, starts in December were the highest since June 2008.
• At 8:30 AM: the Producer Price Index for January will be released. The consensus is for a 0.3% increase in producer prices (0.2% increase in core).
• During the day: The AIA's Architecture Billings Index for January (a leading indicator for commercial real estate).
• At 2:00 PM: FOMC Minutes for January 29-30, 2013.
Housing: No "Troubling Divergence" between Completions and Sales
by Calculated Risk on 2/19/2013 07:49:00 PM
Business Insider had an article on housing today: A Troubling Divergence In The US Housing Market
One of the few concerns about U.S. housing recovery is that building has been outpacing the sales of new homes. As such, there are fears that new home construction is only adding to the inventory of new homes ...The article included the following chart from TD Securities:
This chart from TD Securities shows just why some experts are worried.
 Click on graph for larger image.
This chart compares cumulative housing completions and new home sales over the last 12 months. This is apparently the "troubling divergence".
However this is total completions (including apartments) and total completions is always higher than new home sales!
The second graph is a repeat of the above graph with the addition of single family completions over the last 12 months.
 Just removing multi-family units reduces the "troubling divergence".
But some single family homes are built by owner (with or without a contractor) and are not built for sale. Plus a few single family homes are built to rent. So this comparison is also incorrect.
Here is a repeat of a post from last November: We can't directly compare single family housing starts to new home sales. For an explanation, see from the Census Bureau: Comparing New Home Sales and New Residential Construction
We are often asked why the numbers of new single-family housing units started and completed each month are larger than the number of new homes sold. This is because all new single-family houses are measured as part of the New Residential Construction series (starts and completions), but only those that are built for sale are included in the New Residential Sales series.However it is possible to compare "Single Family Starts, Built for Sale" to New Home sales on a quarterly basis.
The quarterly report released in November showed there were 104,000 single family starts, built for sale, in Q3 2012, and that was above the 96,000 new homes sold for the same quarter, so inventory increased a little (Using Not Seasonally Adjusted data for both starts and sales). Note: The Q4 report will be released tomorrow.
This graph shows the NSA quarterly intent for four start categories since 1975: single family built for sale, owner built (includes contractor built for owner), starts built for rent, and condos built for sale.
 Click on graph for larger image.
Single family starts built for sale were up about 33% compared to Q3 2011. This is still very low, and only back to 2008 levels.
Owner built starts were unchanged from Q3 2011. And condos built for sale are just above the record low.
The 'units built for rent' has increased significantly and is up about 33% year-over-year.
The next graph shows quarterly single family starts, built for sale and new home sales (NSA).
 In 2005, and most of 2006, starts were higher than sales, and inventories of new homes increased. The difference on this graph is pretty small, but the builders were starting about 30,000 more homes per quarter than they were selling (speculative building), and the inventory of new homes soared to record levels. Inventory of under construction and completed new home sales peaked at 477,000 in Q3 2006.
In 2008 and 2009, the home builders started far fewer homes than they sold as they worked off the excess inventory that they had built up in 2005 and 2006.
Now it looks like builders are starting a few more homes than they are selling, and the inventory of under construction and completed new home sales increased slightly to 122,000 in Q3 (this is still near record lows).
Note: new home sales are reported when contracts are signed, so it is appropriate to compare sales to starts (as opposed to completions). This is not perfect because of the handling of cancellations, but it does suggest the builders are keeping inventories under control, and also suggests that the year-over-year increase in housing starts is directly related to an increase in demand and not renewed speculative building.


