by Calculated Risk on 9/02/2012 12:03:00 PM
Sunday, September 02, 2012
Hotel Occupancy Rate above pre-recession levels
From HotelNewsNow.com: STR: US results for week ending 25 August
In year-over-year comparisons, occupancy ended the week with a 4.9-percent increase to 65.7 percent, average daily rate was up 5.3 percent to US$105.43 and revenue per available room ended the week with an increase of 10.5 percent to US$69.30.The 4-week average is above the pre-recession levels (the occupancy rate for the same week in 2007 was 64.2 percent).
Note: ADR: Average Daily Rate, RevPAR: Revenue per Available Room.
The following graph shows the seasonal pattern for the hotel occupancy rate using a four week average.
 Click on graph for larger image.
The red line is for 2012, yellow is for 2011, blue is "normal" and black is for 2009 - the worst year since the Great Depression for hotels.
The occupancy rate will decline over the next month as the summer travel season ends. The next key period is for fall business travel.
The recovery in the occupancy rate has helped hotel profitability, from HotelNewsNow.com: Hotel profitability bouncing back
The U.S. hotel industry achieved a net income of approximately $33 billion, or 21.4% of total revenues, during 2011—a healthy increase of 15.7% over 2010 levels, according to STR through its Hotel Operating Statistics, or HOST, program. STR is the parent company of HotelNewsNow.com.Data Source: Smith Travel Research, Courtesy of HotelNewsNow.com
Yesterday:
• Summary for Week Ending Aug 31st
• Schedule for Week of Sept 2nd
Restaurant Performance Index declines in July
by Calculated Risk on 9/02/2012 09:06:00 AM
From the National Restaurant Association: Uncertainty Over Future Business Conditions Dampens Restaurant Performance Index
The RPI – a monthly composite index that tracks the health of and outlook for the U.S. restaurant industry – stood at 100.2 in July, down 1.1 percent from June and the lowest mark since a reading of 100.0 in October. However, July still represented the ninth consecutive month that the RPI stood above 100, which signifies continued expansion in the index of key industry indicators.
“Although restaurant operators reported positive same-store sales for the 14th consecutive month in July, their economic outlook for the months ahead continued to soften,” said Hudson Riehle, senior vice president of the Research and Knowledge Group for the Association. “Only 22 percent of restaurant operators expect economic conditions to improve in the next six months, the lowest level in 10 months.”
 Click on graph for larger image.
The index decreased to 100.2 in July, down from 101.4 in June (above 100 indicates expansion).
Restaurant spending is discretionary, so even though this is "D-list" data, I like to check it every month.
Yesterday:
• Summary for Week Ending Aug 31st
• Schedule for Week of Sept 2nd
Saturday, September 01, 2012
WSJ interview with Fed's Lockhart: Next Fed action could be a "package" of easing
by Calculated Risk on 9/01/2012 06:36:00 PM
Here is a brief interview of Atlanta Fed President Dennis Lockhart in the WSJ: Fed Official Says More Stimulus a 'Close Call'
"It's a close call" when it comes answering the question of whether the Fed should provide more aid to the economy, Federal Reserve Bank of Atlanta President Dennis Lockhart said.CR Note: If Lockhart is waiting for additional fiscal stimulus, it will be a long long wait. And the "fiscal cliff" will not be addressed until after the election.
...
"I'm increasingly of the view that we are on a track that you would, to simplify it, would say is about a 2% growth track with fluctuating job growth. But overall, not a strong enough pace to bring down unemployment to anything close to a notion of full employment in a reasonable time," Mr. Lockhart said.
"That's a very tough question. I am not highly confident in the ability of simply monetary action to jump-shift the economy onto a different track," ... "There really is a lot to be solved on the fiscal side to create the conditions, arguably, in which further monetary action could really boost the economy,"
...
If the Fed were to act, Mr. Lockhart said half-measures would not get the job done. While he didn't state what the steps could be, he said stimulus, if chosen, should be "a package. When I say package that means two or three things done at the same time to create maximum possible gains."
I think his most interesting comment is at the end about additional accommodation as "a package". That suggests that both extending the extended period until 2015 and another round of asset purchases might happen at the same time (perhaps conditional on the economy).
Earlier:
• Summary for Week Ending Aug 31st
• Schedule for Week of Sept 2nd
Schedule for Week of Sept 2nd
by Calculated Risk on 9/01/2012 12:57:00 PM
Earlier:
• Summary for Week Ending Aug 31st
The key report for this week will be the August employment report to be released on Friday, Sept 7th. Other key reports include the ISM manufacturing index on Tuesday, vehicle sales also on Tuesday, and the ISM non-manufacturing (service) index on Thursday.
On Thursday, September 6th, there is a Governing Council meeting of the European Central Bank in Frankfurt with a press conference to follow. ECB President Mario Draghi is expected to discuss how the ECB will help lower Spanish and Italian borrowing costs.
All day: Light vehicle sales for August. The consensus is for light vehicle sales to increase to 14.3 million SAAR in August from 14.1 million in July (Seasonally Adjusted Annual Rate).
 This graph shows light vehicle sales since the BEA started keeping data in 1967. The dashed line is the July sales rate.
 TrueCar is forecasting:
The August 2012 forecast translates into a Seasonally Adjusted Annualized Rate (“SAAR”) of 14.2 million new car sales, up from 12.1 million in August 2011 and up from 14.1 million in July 2012.Edmunds.com is forecasting:
Edmunds.com ... forecasts that 1,287,603 new cars will be sold in August for an estimated Seasonally Adjusted Annual Rate (SAAR) this month of 14.5 million light vehicles.
 10:00 AM ET: ISM Manufacturing Index for August.
 Here is a long term graph of the ISM manufacturing index. The ISM index has shown contraction for two consecutive months; the first contraction in the ISM index since the recession ended in 2009. The consensus is for an increase to 50.0, up from 49.8 in July. (below 50 is contraction).
10:00 AM: Construction Spending for July. The consensus is for a 0.4% increase in construction spending.
8:30 AM: Productivity and Costs for Q2. The consensus is for a 1.4% increase in unit labor costs.
10:00 AM: Trulia Price Rent Monitors for August. This is the new index from Trulia that uses asking prices adjusted both for the mix of homes listed for sale and for seasonal factors.
8:30 AM: The initial weekly unemployment claims report will be released. The consensus is for claims to decrease to 370 thousand from 374 thousand.
10:00 AM: ISM non-Manufacturing Index for August. The consensus is for an increase to 53.0 from 52.6 in July. Note: Above 50 indicates expansion, below 50 contraction.
During the day: Governing Council meeting of the European Central Bank with a press conference to follow.
 8:30 AM: Employment Report for August. The consensus is for an increase of 125,000 non-farm payroll jobs in August, down from the 163,000 jobs added in July.
The consensus is for the unemployment rate to be unchanged at 8.3%.
This second employment graph shows the percentage of payroll jobs lost during post WWII recessions through June.
 The economy has added 4.54 million private sector jobs since employment bottomed in February 2010 (4.00 million total jobs added with all the public sector layoffs).
There are still 4.3 million fewer private sector jobs now than when the recession started in 2007. (4.8 million fewer total nonfarm jobs).
Summary for Week Ending August 31st
by Calculated Risk on 9/01/2012 08:03:00 AM
The key event of the week was Fed Chairman Ben Bernanke’s speech on Friday at the Jackson Hole Economic Symposium. Here was my take on the speech: Analysis: Bernanke Clears the way for QE3 in September and a couple more views: Two more reviews of Bernanke's Speech: Weak Labor Market "a grave concern"
The economic data was still weak, but a little better than expected - since expectations are so low. Q2 GDP was revised up to a still weak 1.7% from 1.5% and personal income and spending increased in July. An important positive was that the Case-Shiller house price index turned positive on a year-over-year basis suggesting house prices might have bottomed earlier this year.
On the other hand, the manufacturing surveys were once again disappointing.
Even the “better” news was pretty weak – definitely not “substantial and sustainable strengthening in the pace of the economic recovery”. Next week the focus will be on the August employment report and the European ECB meeting.
Here is a summary of last week in graphs:
• Case-Shiller: House Prices increased 0.5% year-over-year in June
 Click on graph for larger image.
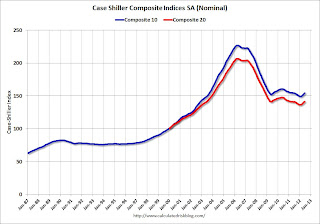
The first graph shows the nominal seasonally adjusted Composite 10 and Composite 20 indices (the Composite 20 was started in January 2000).
The Composite 10 index is off 32.0% from the peak, and up 1.0% in June (SA). The Composite 10 is up 3.5% from the post bubble low set in March (SA).
The Composite 20 index is off 31.6% from the peak, and up 0.9% (SA) in June. The Composite 20 is up 3.6% from the post-bubble low set in March (SA).
 The second graph shows the Year over year change in both indices.
The Composite 10 SA is up 0.1% compared to June 2011.
The Composite 20 SA is up 0.5% compared to June 2011. This was the first year-over-year since 2010 (when the tax credit boosted prices temporarily).
• Real House Prices, Price-to-Rent Ratio
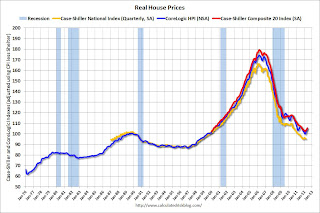
Here is another update to a few graphs: Case-Shiller, CoreLogic and others report nominal house prices, and it is also useful to look at house prices in real terms (adjusted for inflation) and as a price-to-rent ratio. Real prices, and the price-to-rent ratio, are back to late 1999 to 2000 levels depending on the index.

This graph shows the quarterly Case-Shiller National Index SA (through Q2 2012), and the monthly Case-Shiller Composite 20 SA and CoreLogic House Price Indexes (through June) in nominal terms as reported.
In nominal terms, the Case-Shiller National index (SA) is back to Q1 2003 levels (and also back up to Q4 2010), and the Case-Shiller Composite 20 Index (SA) is back to July 2003 levels, and the CoreLogic index (NSA) is back to November 2003.
 The second graph shows the same three indexes in real terms (adjusted for inflation using CPI less Shelter). Note: some people use other inflation measures to adjust for real prices.
In real terms, the National index is back to mid-1999 levels, the Composite 20 index is back to June 2000, and the CoreLogic index back to October 2000.
As we've discussed before, in real terms, all of the appreciation early in the last decade is still gone.
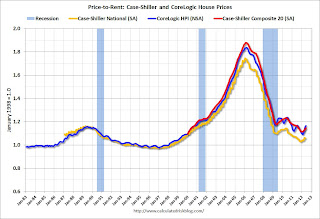
 Here is a graph using the Case-Shiller National, Composite 20 and CoreLogic House Price Indexes compared to owners equivalent rent.
This graph shows the price to rent ratio (January 1998 = 1.0).
On a price-to-rent basis, the Case-Shiller National index is back to Q3 1999 levels, the Composite 20 index is back to June 2000 levels, and the CoreLogic index is back to August 2000.
In real terms - and as a price-to-rent ratio - prices are mostly back to late 1990s or early 2000 levels.
• Personal Income increased 0.3% in July, Spending increased 0.4%
 This graph shows real PCE by month for the last few years. The dashed red lines are the quarterly levels for real PCE.
 "Personal income increased $42.3 billion, or 0.3 percent ... Personal consumption expenditures (PCE) increased $46.0 billion, or 0.4 percent. ... Real PCE -- PCE adjusted to remove price changes -- increased 0.4 percent in July, in contrast to a decrease of 0.1 percent in June."
A key point is the PCE price index has only increased 1.3% over the last year, and core PCE is up only 1.6%. The PCE price index - and core PCE - hardly increased in July.
• Weekly Initial Unemployment Claims at 374,000
 "In the week ending August 25, the advance figure for seasonally adjusted initial claims was 374,000, unchanged from the previous week's revised figure of 374,000. The 4-week moving average was 370,250, an increase of 1,500 from the previous week's revised average of 368,750"
The dashed line on the graph is the current 4-week average. The four-week average of weekly unemployment claims increased to 370,250.
This was above the consensus forecast of 370,000.
• Fed: Consumer Deleveraging Continued in Q2
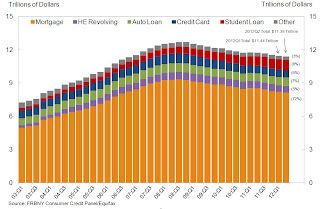
 From the NY Fed: Overall Delinquency Rates Down as Americans Paying More Debt on Time
 This graph shows aggregate consumer debt decreased in Q2. This was mostly due to a decline in mortgage debt.
However student debt is still increasing.
 This graph shows the percent of debt in delinquency. In general, the percent of delinquent debt is declining, but what really stands out is the percent of debt 90+ days delinquent (Yellow, orange and red).
 From the NY Fed: "Overall delinquencies improved in 2012Q2. As of June 30, 9.0% of outstanding debt was in some stage of delinquency, compared with 9.3% at the end of 2012Q1. About $1.02 trillion of debt is delinquent, with $765 billion seriously delinquent (at least 90 days late or “severely derogatory”)."
• Other Economic Stories ...
• NAR: Pending home sales index increased 2.4% in July
• Fed's Beige Book: Economic activity increased "gradually", Residential real estate shows "signs of improvement"
• Chicago PMI declines to 53.0
• Fannie Mae and Freddie Mac Serious Delinquency rates declined in July
• LPS: Mortgage delinquencies decreased in July


