by Calculated Risk on 9/01/2012 08:03:00 AM
Saturday, September 01, 2012
Summary for Week Ending August 31st
The key event of the week was Fed Chairman Ben Bernanke’s speech on Friday at the Jackson Hole Economic Symposium. Here was my take on the speech: Analysis: Bernanke Clears the way for QE3 in September and a couple more views: Two more reviews of Bernanke's Speech: Weak Labor Market "a grave concern"
The economic data was still weak, but a little better than expected - since expectations are so low. Q2 GDP was revised up to a still weak 1.7% from 1.5% and personal income and spending increased in July. An important positive was that the Case-Shiller house price index turned positive on a year-over-year basis suggesting house prices might have bottomed earlier this year.
On the other hand, the manufacturing surveys were once again disappointing.
Even the “better” news was pretty weak – definitely not “substantial and sustainable strengthening in the pace of the economic recovery”. Next week the focus will be on the August employment report and the European ECB meeting.
Here is a summary of last week in graphs:
• Case-Shiller: House Prices increased 0.5% year-over-year in June
 Click on graph for larger image.
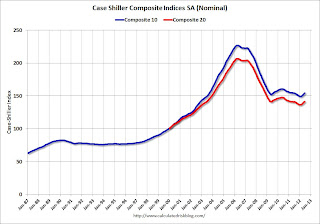
The first graph shows the nominal seasonally adjusted Composite 10 and Composite 20 indices (the Composite 20 was started in January 2000).
The Composite 10 index is off 32.0% from the peak, and up 1.0% in June (SA). The Composite 10 is up 3.5% from the post bubble low set in March (SA).
The Composite 20 index is off 31.6% from the peak, and up 0.9% (SA) in June. The Composite 20 is up 3.6% from the post-bubble low set in March (SA).
 The second graph shows the Year over year change in both indices.
The Composite 10 SA is up 0.1% compared to June 2011.
The Composite 20 SA is up 0.5% compared to June 2011. This was the first year-over-year since 2010 (when the tax credit boosted prices temporarily).
• Real House Prices, Price-to-Rent Ratio
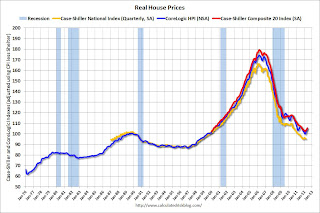
Here is another update to a few graphs: Case-Shiller, CoreLogic and others report nominal house prices, and it is also useful to look at house prices in real terms (adjusted for inflation) and as a price-to-rent ratio. Real prices, and the price-to-rent ratio, are back to late 1999 to 2000 levels depending on the index.

This graph shows the quarterly Case-Shiller National Index SA (through Q2 2012), and the monthly Case-Shiller Composite 20 SA and CoreLogic House Price Indexes (through June) in nominal terms as reported.
In nominal terms, the Case-Shiller National index (SA) is back to Q1 2003 levels (and also back up to Q4 2010), and the Case-Shiller Composite 20 Index (SA) is back to July 2003 levels, and the CoreLogic index (NSA) is back to November 2003.
 The second graph shows the same three indexes in real terms (adjusted for inflation using CPI less Shelter). Note: some people use other inflation measures to adjust for real prices.
In real terms, the National index is back to mid-1999 levels, the Composite 20 index is back to June 2000, and the CoreLogic index back to October 2000.
As we've discussed before, in real terms, all of the appreciation early in the last decade is still gone.
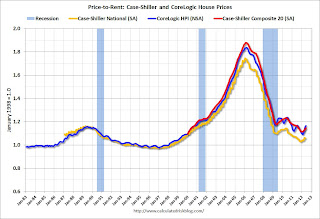
 Here is a graph using the Case-Shiller National, Composite 20 and CoreLogic House Price Indexes compared to owners equivalent rent.
This graph shows the price to rent ratio (January 1998 = 1.0).
On a price-to-rent basis, the Case-Shiller National index is back to Q3 1999 levels, the Composite 20 index is back to June 2000 levels, and the CoreLogic index is back to August 2000.
In real terms - and as a price-to-rent ratio - prices are mostly back to late 1990s or early 2000 levels.
• Personal Income increased 0.3% in July, Spending increased 0.4%
 This graph shows real PCE by month for the last few years. The dashed red lines are the quarterly levels for real PCE.
 "Personal income increased $42.3 billion, or 0.3 percent ... Personal consumption expenditures (PCE) increased $46.0 billion, or 0.4 percent. ... Real PCE -- PCE adjusted to remove price changes -- increased 0.4 percent in July, in contrast to a decrease of 0.1 percent in June."
A key point is the PCE price index has only increased 1.3% over the last year, and core PCE is up only 1.6%. The PCE price index - and core PCE - hardly increased in July.
• Weekly Initial Unemployment Claims at 374,000
 "In the week ending August 25, the advance figure for seasonally adjusted initial claims was 374,000, unchanged from the previous week's revised figure of 374,000. The 4-week moving average was 370,250, an increase of 1,500 from the previous week's revised average of 368,750"
The dashed line on the graph is the current 4-week average. The four-week average of weekly unemployment claims increased to 370,250.
This was above the consensus forecast of 370,000.
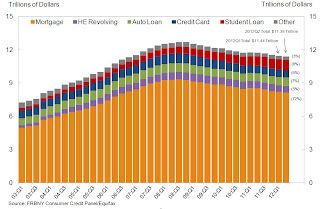
• Fed: Consumer Deleveraging Continued in Q2
 From the NY Fed: Overall Delinquency Rates Down as Americans Paying More Debt on Time
 This graph shows aggregate consumer debt decreased in Q2. This was mostly due to a decline in mortgage debt.
However student debt is still increasing.
 This graph shows the percent of debt in delinquency. In general, the percent of delinquent debt is declining, but what really stands out is the percent of debt 90+ days delinquent (Yellow, orange and red).
 From the NY Fed: "Overall delinquencies improved in 2012Q2. As of June 30, 9.0% of outstanding debt was in some stage of delinquency, compared with 9.3% at the end of 2012Q1. About $1.02 trillion of debt is delinquent, with $765 billion seriously delinquent (at least 90 days late or “severely derogatory”)."
• Other Economic Stories ...
• NAR: Pending home sales index increased 2.4% in July
• Fed's Beige Book: Economic activity increased "gradually", Residential real estate shows "signs of improvement"
• Chicago PMI declines to 53.0
• Fannie Mae and Freddie Mac Serious Delinquency rates declined in July
• LPS: Mortgage delinquencies decreased in July


