by Calculated Risk on 5/04/2012 08:30:00 AM
Friday, May 04, 2012
April Employment Report: 115,000 Jobs, 8.1% Unemployment Rate
From the BLS:
Nonfarm payroll employment rose by 115,000 in April, and the unemployment rate was little changed at 8.1 percent, the U.S. Bureau of Labor Statistics reported today.This was below expectations of 165,000 payroll jobs added.
...
The civilian labor force participation rate declined in April to 63.6 percent, while the employment-population ratio, at 58.4 percent, changed little.
...
The change in total nonfarm payroll employment for February was revised from +240,000 to +259,000, and the change for March was revised from +120,000 to +154,000.
 Click on graph for larger image.
Job growth started picking up early last year, but then the economy was hit by a series of shocks (oil price increase, tsunami in Japan, debt ceiling debate) - and then growth started picking up again. Now it appears job growth has slowed again. This was a weak month, but the upward revisions to prior months was a small positive.
The second graph shows the employment population ratio, the participation rate, and the unemployment rate. The unemployment rate was declined to 8.1% (red line).
 The Labor Force Participation Rate decreased to 63.6% in April (blue line). This is the percentage of the working age population in the labor force and the participation rate is at a new post bubble low. The participation rate is well below the 66% to 67% rate that was normal over the last 20 years, although some of the recent decline is due to demographics.
The Employment-Population ratio declined slightly to 58.4% in April (black line).
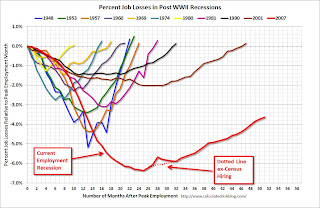
 The third graph shows the job losses from the start of the employment recession, in percentage terms. The dotted line is ex-Census hiring.
This shows the depth of the recent employment recession - worse than any other post-war recession - and the relatively slow recovery due to the lingering effects of the housing bust and financial crisis.
This was weaker payroll growth than expected (expected was 165,000). More later ...
Thursday, May 03, 2012
Look Ahead: April Employment Report, European Elections
by Calculated Risk on 5/03/2012 09:00:00 PM
The focus Friday will be on the April employment report from the Bureau of Labor Statistics (BLS).
• The employment report will be released at 8:30 AM ET. The consensus is for an increase of 165,000 non-farm payroll jobs in April, up from the 120,000 jobs added in March.
The consensus is for the unemployment rate to remain unchanged at 8.2%.
Earlier today I posted a preview of the report.
From Patti Domm at CNBC: Wall Street Has Lowered the Bar for April's Jobs Report
Deutsche Bank chief U.S. economist Joseph LaVorgna ... expects to see 175,000 nonfarm payrolls were added in April.• European elections: On Sunday, France and Greece will hold elections. In France, François Hollande is expected to replace Nicolas Sarkozy as President of the French Republic. Hollande is expected to push for more of a growth agenda, as opposed to austerity only.
Goldman Sachs economists expect to see only 125,000 nonfarm payrolls added in April, and they also see weather as a factor. But Goldman Economist Andrew Tilton agrees that if there’s a surprise, it may be in retail. In the employment reports in February and March, retail showed total layoffs of about 80,000 workers in the general apparel category. About 50,000 of those were in March — a record level — according to Tilton.
No party will win a majority in Greece, and many of the minor parties are expected to get a boost from the anti-auserity vote. However New Democracy will probably receive the most votes, and Pasok will probably finish second. There are some weird rules in Greece - see Greek elections from the Financial Times Alphaville - but it sounds like New Democracy and Pasok will be able to form a government that supports the terms of the recent bailout - although I expect New Democracy will push for some sort of growth agenda.
Freddie Mac: Fixed Mortgage Rates Average New All-Time Record Lows
by Calculated Risk on 5/03/2012 07:12:00 PM
This was released earlier ... from Freddie Mac: Fixed Mortgage Rates Average New All-Time Record Lows
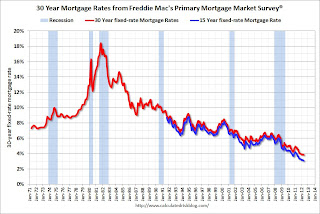
Freddie Mac (OTC: FMCC) today released the results of its Primary Mortgage Market Survey® (PMMS®), showing average fixed mortgage rates finding new all-time record lows ... The 30-year fixed averaged 3.84 percent, down from its previous all-time record low of 3.87 percent last registered on February 9, 2012. The 15-year fixed averaged 3.07 percent, also dropping below its previous all-time record low of 3.11 percent set April 12 of this year. The 1-year ARM also averaged a new all-time record low in the PMMS at 2.70 percent.
30-year fixed-rate mortgage (FRM) averaged 3.84 percent with an average 0.8 point for the week ending May 3, 2012, down from last week when it averaged 3.88 percent. Last year at this time, the 30-year FRM averaged 4.71 percent.
 Click on graph for larger image.
This graph shows the 15 and 30 year fixed rates from the Freddie Mac survey. The Primary Mortgage Market Survey® started in 1971 (15 year in 1991).
The Ten Year treasury yield is near a record low at 1.92%.
NFIB: Small Business hiring was weak in April, "Outlook improves"
by Calculated Risk on 5/03/2012 04:25:00 PM
From the National Federation of Independent Business (NFIB): Job Creation Weakens in April but Prospects Improve
April was another tenuous month for small businesses, sending mixed signals about what the future holds.Note: Small businesses have a larger percentage of real estate and retail related companies than the overall economy.
“On the job creation front, the news was only fair. The net change in employment per firm (seasonally adjusted) came in at 0.1; this is down from March but still positive.
...
“The percent of owners reporting hard to fill job openings rose 2 points to 17 percent, one point below the January 2012 reading which is the highest we’ve reported since June 2008. Hard-to-fill job openings are a strong predictor of the unemployment rate, making the gain in openings a welcome development. The net percent of owners planning to create new jobs is 5 percent, a 5 point increase after taking a plunge in March ...
“Overall, the April NFIB survey anticipates some strength in the job creation number with little change in the unemployment rate. With job creation plans rebounding, the outlook is a bit more optimistic for the second quarter ..."
 Click on graph for larger image.
This graph shows the small business hiring plans index since 1986. Hiring plans increased in April with the index at 5% compared to 0% in March.
According to NFIB: “Not seasonally adjusted, 18 percent plan to increase employment at their firm (up 3 points), and 5 percent plan reductions (unchanged from March)." This is still very low.
Employment Situation Preview
by Calculated Risk on 5/03/2012 01:44:00 PM
Tomorrow the BLS will release the April Employment Situation Summary at 8:30 AM ET. Bloomberg is showing the consensus is for an increase of 165,000 payroll jobs in April, and for the unemployment rate to remain unchanged at 8.2%.
Note on weather:
• The weather was mild in January and February, and it is possible that some hiring was pulled forward. I looked back at previous years with mild weather (using the BLS "not at work, bad weather" measurement), and employment gains in March and April didn't seem to exhibit much "payback" following the mild weather during January and February. However Goldman Sachs analysts think there will be some payback in the April report, they note: "[O]ur current best guess is that weather has boosted the level of payrolls by around 100,000 as of February, and may have shaved about 20,000 from the March report. Going forward, we currently expect payback of about 50,000 in April and the remaining 30,000 in May."
Here is a summary of recent data:
• The ADP employment report showed an increase of 119,000 private sector payroll jobs in April. Although ADP seems to track the BLS over time, the ADP report hasn't been very useful in predicting the BLS report. There has been some discussion about ADP reporting fewer payroll jobs added than the BLS report over the last two years (April 2010 and April 2011) - the argument being that that may happen again. However, in earlier years (2006 - 2009) ADP showed more jobs added (or fewer jobs lost) in April than the BLS, so I'm not sure there is a seasonal pattern.
• The ISM manufacturing employment index increased to 57.3% from 56.1% in March. A historical correlation between the ISM index and the BLS employment report for manufacturing, suggests that private sector BLS reported payroll jobs for manufacturing increased about 22,000 in April.
The ISM service employment index decreased to 54.2% from 56.7% in March. Based on a historical correlation between the ISM non-manufacturing employment index and the BLS employment report for service, this reading suggests the gain of around 170,000 private payroll jobs for services in April.
Combined the ISM surveys suggest an employment report somewhat above the consensus.
• Initial weekly unemployment claims averaged about 384,000 in April, up from 369,000 average in January , February and March.
For the BLS reference week (includes the 12th of the month), initial claims were at 389,000; the highest level this year and about the level of last November when the economy added 157,000 payroll jobs.
• The final April Reuters / University of Michigan consumer sentiment index increased to 76.4, up slightly from the March reading of 76.2. This is frequently coincident with changes in the labor market, but also strongly related to gasoline prices and other factors. This suggests a weak but slightly improving labor market.
• The small business index from Intuit showed 40,000 payroll jobs added, down from 65,000 in March.
• And on the unemployment rate from Gallup: Gallup Seasonally Adjusted U.S. Unemployment Rate Up in April
U.S. unemployment, as measured by Gallup without seasonal adjustment, showed a modest decline to 8.3% in April from 8.4% in March. However, applying the government's historical April adjustment to Gallup's unadjusted number yields a seasonally adjusted April estimate of 8.6%, up from 8.1% in March.Note: Gallup only recently has been providing a seasonally adjusted estimate for the unemployment rate, so use with caution (Gallup provides some caveats), but this does suggest an increase in the headline unemployment rate in April.
• Conclusion: There seems to be a growing sense that the employment report will disappoint tomorrow based on higher initial weekly unemployment claims during the reference period, the weaker than expected ADP employment report, and the weaker than expected ISM services index. Also there could be some "payback" from hiring during the winter due to the mild weather. However the combined ISM reports suggest the consensus is close. On the positive side, Goldman also noted that the retail sector was hit particularly hard over the last two months (possibly due to some large retailer layoffs), and that will probably not happen in April
There always seems to be some randomness to the employment report, but this month I'll take the under (under 165,000 payroll jobs), and I think an increase in the unemployment rate is possible (this depends on the participation rate and if discouraged workers return to the labor force).
Trulia on Houses: Asking Prices increase slightly Year-over-year in April
by Calculated Risk on 5/03/2012 10:28:00 AM
This is an interesting new asking price monitor from Trulia. Usually people report median asking prices, but unfortunately the median is impacted by the mix of homes. However Trulia adjusts the asking prices both for the mix of homes listed for sale and for seasonal factors. Of course this is just asking prices, not sales prices, but this might provide an early hint at changes in house prices.
This has the advantage of giving a much earlier look at prices than the repeat sales indexes. As an example, the recent Case-Shiller report was for "February". But that was really a three month average of December, January and February, and since the index is based on closing prices, some of this index was based on contracts signed last October. That is 6 or even 7 months ago.
From Trulia: Strong Housing Demand and Tightening Inventories Spark Nearly 2 Percent Rise in Asking Prices over Previous Quarter
Asking prices on for-sale homes–which lead sales prices by approximately two or more months–were 0.5 percent higher in April than in March, seasonally adjusted. Together with increases in March and February, asking prices in April rose nationally 1.9 percent quarter over quarter (Q-o-Q), seasonally adjusted. The price increase unadjusted for seasonality was even higher: 4.8 percent Q-o-Q, since prices typically jump in springtime. Year over year (Y-o-Y), asking prices rose 0.2 percent nationally.
...
“Housing prices have already bottomed with asking prices on the rise for three straight months. Aside from a stumble in December, asking prices have been stable or rising for the last eight months,” said Jed Kolko, Trulia’s Chief Economist. “Prices have joined the recovery, alongside sales and construction. But foreclosures threaten prices, especially in judicial-foreclosure states like Florida, New Jersey, Illinois and New York, where many more distressed sales are still to come.”
 Click on graph for larger image.
This graph from Trulia shows the month over month prices changes (seasonally adjusted) as reported by the monitor. This shows asking prices were falling for most of 2011, but have turned up in early 2012.
Here is a list of price and rent changes for the 100 largest metro areas.
This is a small year-over-year increase, up from a 0.7% year-over-year decrease in March. Since asking prices tend to lead the repeat sales indexes by two or more months, this suggests that the repeat sales indexes might turn positive year-over-year in June or July (of course the June index will not be released until the end of August).
ISM Non-Manufacturing Index indicates slower expansion in April
by Calculated Risk on 5/03/2012 10:00:00 AM
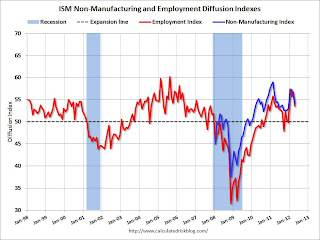
The April ISM Non-manufacturing index was at 53.5%, down from 56.0% in March. The employment index decreased in April to 54.2%, down from 56.7% in March. Note: Above 50 indicates expansion, below 50 contraction.
From the Institute for Supply Management: March 2012 Non-Manufacturing ISM Report On Business®
Economic activity in the non-manufacturing sector grew in April for the 28th consecutive month, say the nation's purchasing and supply executives in the latest Non-Manufacturing ISM Report On Business®.
The report was issued today by Anthony Nieves, C.P.M., CFPM, chair of the Institute for Supply Management™ Non-Manufacturing Business Survey Committee. "The NMI registered 53.5 percent in April, 2.5 percentage points lower than the 56 percent registered in March. This indicates continued growth this month, but at a slower rate in the non-manufacturing sector. The Non-Manufacturing Business Activity Index registered 54.6 percent, which is 4.3 percentage points lower than the 58.9 percent reported in March, reflecting growth for the 33rd consecutive month. The New Orders Index decreased by 5.3 percentage points to 53.5 percent, and the Employment Index decreased by 2.5 percentage points to 54.2 percent, indicating continued growth in employment at a slower rate. The Prices Index decreased 10.3 percentage points to 53.6 percent, indicating prices increased at a significantly slower rate in April when compared to March. According to the NMI, 15 non-manufacturing industries reported growth in April. Respondents' comments affirm the slowing rate of growth. In addition, they remain concerned about rising fuel costs and the impact on shipping, transportation and petroleum-based product costs."
 Click on graph for larger image.
This graph shows the ISM non-manufacturing index (started in January 2008) and the ISM non-manufacturing employment diffusion index.
This was below the consensus forecast of 55.9% and indicates slower expansion in April than in March.
Weekly Initial Unemployment Claims decline to 365,000
by Calculated Risk on 5/03/2012 08:37:00 AM
The DOL reports:
In the week ending April 28, the advance figure for seasonally adjusted initial claims was 365,000, a decrease of 27,000 from the previous week's revised figure of 392,000. The 4-week moving average was 383,500, an increase of 750 from the previous week's revised average of 382,750.The previous week was revised up to 392,000 from 388,000.
The following graph shows the 4-week moving average of weekly claims since January 2000.
 Click on graph for larger image.
The dashed line on the graph is the current 4-week average. The four-week average of weekly unemployment claims increased to 383,500.
This is the highest level for the 4-week moving average since last December.
And here is a long term graph of weekly claims:

This was below the consensus of 378,000. However, even though weekly claims declined, the 4-week average has increased for four straight weeks and is at the highest level this year.
Wednesday, May 02, 2012
Look Ahead: Unemployment Claims, ISM Services, and ECB
by Calculated Risk on 5/02/2012 09:21:00 PM
The focus tomorrow will be on initial weekly unemployment claims, the ISM service index, and the ECB post-meeting press conference.
• Initial weekly unemployment claims will be released at 8:30 AM ET on Thursday. The four week average of weekly claims has been increasing over the last three weeks, possibly indicating some renewed weakness in the labor market, or possibly just noise. The consensus is for claims to decline to 378,000 from 388,000 last week.
• At 10:00 AM, the ISM non-Manufacturing Index (Serives) for April will be released. The consensus is for a slight decline in the index to 55.9 from 56.0 in March (over 50 is expansion). Given the weakness in the Chicago PMI, this index might disappoint (but the ISM service index doesn't move markets like the ISM manufacturing index).
• Also at 10:00 AM, the Trulia House Price & Rent Monitors for April will be released. This is a new index from Trulia that uses asking prices adjusted both for the mix of homes listed for sale and for seasonal factors. For those looking for signs of an inflection point for house prices this is an important index. Asking prices tend to lead the repeat sales indexes by two or more months. This index increased in both February and March (seasonally adjusted), but asking prices were still down 0.7% year-over-year in March. It will be an important change if this index is up year-over-year in April.
• Other data include Productivity and Costs for Q1, and the Ceridian-UCLA Pulse of Commerce Index™, a measure of diesel fuel index consumption for April.
• The European Central Bank (ECB) is meeting tomorrow and no change is expected to interest rates. However the post-meeting briefing might be interesting as ECB President Mario Draghi will probably be asked to clarify his recent support for a "growth pact".
Mortgage Equity Withdrawal update
by Calculated Risk on 5/02/2012 06:39:00 PM
Note: This is not Mortgage Equity Withdrawal (MEW) data from the Fed. The last MEW data from Fed economist Dr. Kennedy was for Q4 2008.
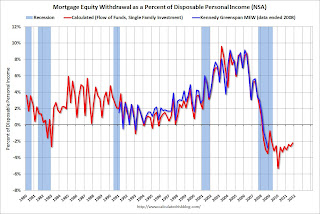
The following data is calculated from the Fed's Flow of Funds data and the BEA supplement data on single family structure investment. This is an aggregate number, and is a combination of homeowners extracting equity - hence the name "MEW", but there is little MEW right now - and normal principal payments and debt cancellation.
For Q4 2011, the Net Equity Extraction was minus $64 billion, or a negative 2.2% of Disposable Personal Income (DPI). This is not seasonally adjusted.
 Click on graph for larger image in new window.
This graph shows the net equity extraction, or mortgage equity withdrawal (MEW), results, using the Flow of Funds (and BEA data) compared to the Kennedy-Greenspan method.
There are smaller seasonal swings right now, perhaps because there is a little actual MEW (this is heavily impacted by debt cancellation right now).
The Fed's Flow of Funds report showed that the amount of mortgage debt outstanding declined sharply in Q4. Mortgage debt has declined by $777 billion over the last four years. This decline is mostly because of debt cancellation per foreclosures and short sales, and some from modifications. There has also been some reduction in mortgage debt as homeowners paid down their mortgages so they could refinance. Note: most homeowners pay down their principal a little each month unless they have an IO or Neg AM loan, so with no new borrowing, equity extraction would always be slightly negative.
For reference:
Dr. James Kennedy also has a new method for calculating equity extraction: "A Simple Method for Estimating Gross Equity Extracted from Housing Wealth". Here is a companion spread sheet (the above uses my simple method).
For those interested in the last Kennedy data included in the graph, the spreadsheet from the Fed is available here.


