 RSS Feed
 by Calculated Risk on 1/05/2012 12:36:00 AM
Thursday, January 05, 2012
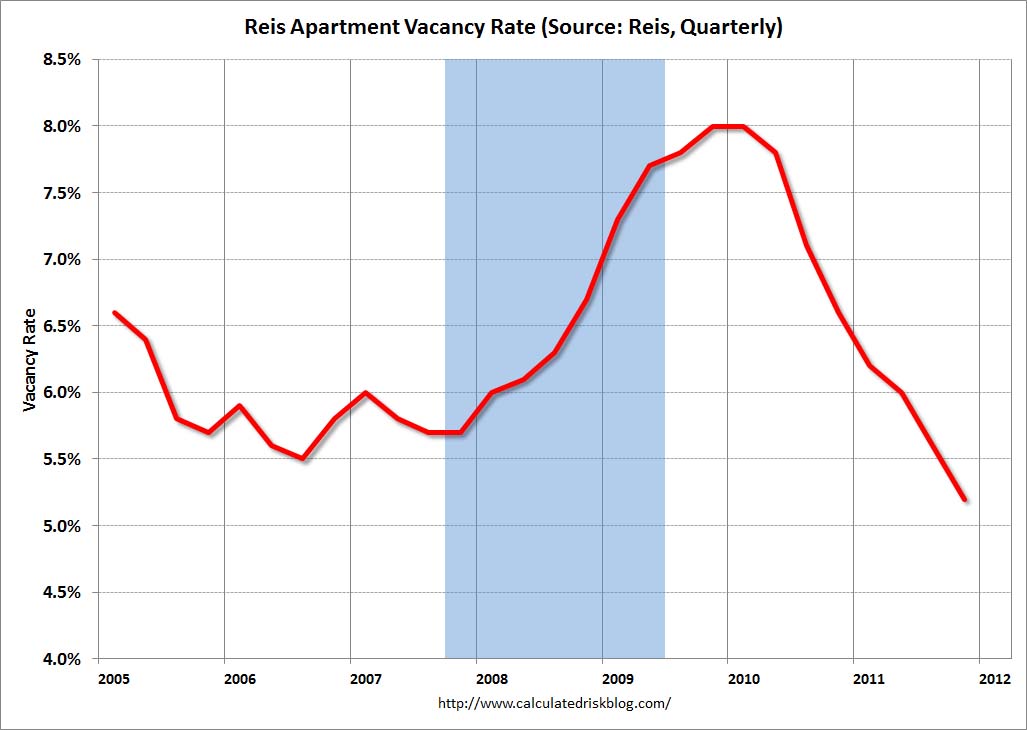
Reis: Apartment Vacancy Rate falls to 5.2% in Q4, Lowest since 2001
Reis reported that the apartment vacancy rate (82 markets) fell to 5.2% in Q4 from 5.6% in Q3. The vacancy rate was at 6.6% in Q4 2010 and peaked at 8.0% at the end of 2009.
From the WSJ: Apartment-Vacancy Rate Tumbles to 2001 Level
The nation's apartment-vacancy rate in the fourth quarter fell to its lowest level since late 2001 ... In the fourth quarter, the vacancy rate fell to 5.2% from 6.6% a year earlier and 5.6% at the end of the third quarter, according to Reis.
During the depths of the downturn, landlords had to offer incentives such as flat-screen TVs and months with no rent to attract tenants. But in the fourth quarter of 2011, landlords in 71 of the 82 of the markets that Reis follows were able to raise rents. ... Nationwide, landlords raised asking rents an average of 0.4% in the fourth quarter, to $1,064 a month. That's up from $1,026 in 2009.
But rent increases showed signs of moderating in some markets and, overall, they were less than Reis had expected.
 Click on graph for larger image.
This graph shows the apartment vacancy rate starting in 2005.
Reis is just for large cities, but this decline in vacancy rates is happening just about everywhere. More from Bloomberg: U.S. Apartment Vacancies Decline to a Decade Low of 5.2%, Rents Increase
“The sector is benefiting from some of the lowest figures for new construction on record,” Calanog said. “By 2013, the influx of new units may begin eroding any benefit the sector derives from tight supply conditions.”A few key points we've been discussing all year:
A total of 8,865 new units became available in the fourth quarter, the second-fewest for any three-month period in Reis records dating to 1999. The first quarter of 2011 had the fewest units, at 7,473.
For all of 2011, 37,678 units were completed, the lowest annual total in 31 years of Reis data. The previous record was 49,303 in 1993 during the savings and loan crisis.
• Apartment vacancy rates are falling fast.
• A record low number of multi-family units were completed in 2011.
• Multi-family starts are increasing, and that is helping both GDP and employment growth this year. These new starts will not be completed until 2012 or 2013, so vacancy rates will probably continue to decline.
Wednesday, January 04, 2012
Misc: ISM Seasonality, Economic predictions with Search Engines and more
by Calculated Risk on 1/04/2012 09:10:00 PM
A few interesting reads ...
• From FT Alphaville: ‘Tis (still) the seasonality, ISM edition. An interesting discussion of seasonality, and how recent the recent ISM survey might be overstating strength.
• From the NY Fed: Forecasting with Internet Search Data. This is an attempt to get more recent information since data is released with a lag. I tried this with "New Homes" and it appears to track, but it is a little too noisy to use to predict new home sales from the Census Bureau.
• From Jon Lansner at the O.C. Register: Van line: Calif. jumps to No. 7 U.S. destination
Allied Van Lines’ 44th annual “Magnet States Report” says that at least by its own business patterns California is back as on the “inbound list” — states with more folks moving in than out. ... Illinois had the most net outbound losses followed by Pennsylvania, Michigan, New Jersey and New York.• From Tim Duy at Fed Watch: Still Cautious Heading Into 2012
Bottom Line: I want to believe the recent improvement in the tenor of economic data signals that activity is set to accelerate substantially in 2012. But the ups and downs on the past two years smoothed out to nothing exciting or catastrophic, just a moderate path of activity that remains woefully insufficient to return the US economy to its pre-recession trend. For now, I will stick to that middle ground, while remaining watchful of the all-too-many downside risks that leave me just a little bit sleepless each night.Earlier:
• U.S. Light Vehicle Sales at 13.56 million SAAR in December
• From the Federal Reserve: The U.S. Housing Market: Current Conditions and Policy Considerations
• Question #6 for 2012: Unemployment Rate
U.S. Light Vehicle Sales at 13.56 million SAAR in December
by Calculated Risk on 1/04/2012 04:44:00 PM
Based on an estimate from Autodata Corp, light vehicle sales were at a 13.56 million SAAR in December. That is up 8.9% from December 2010, and down 0.3% from the sales rate last month (13.60 million SAAR in Nov 2011).
This was at the consensus forecast of 13.6 million SAAR.
This graph shows the historical light vehicle sales (seasonally adjusted annual rate) from the BEA (blue) and an estimate for December (red, light vehicle sales of 13.56 million SAAR from Autodata Corp).
 Click on graph for larger image.
The annualized sales rate was essentially unchanged from November, and the last two months were the strongest since June 2008 excluding cash-for-clunkers.
The second graph shows light vehicle sales since the BEA started keeping data in 1967.
This shows the huge collapse in sales in the 2007 recession. This also shows the impact of the tsunami and supply chain issues on sales, especially in May and June.
 Note: dashed line is current estimated sales rate.
Growth in auto sales should make a strong positive contribution to Q4 GDP. Sales in Q3 averaged 12.45 million SAAR, and sales averaged 13.46 million SAAR in Q4, an increase of 8.1% over Q3.
Fed White Paper: "The U.S. Housing Market: Current Conditions and Policy Considerations"
by Calculated Risk on 1/04/2012 02:53:00 PM
From the Federal Reserve: The U.S. Housing Market: Current Conditions and Policy Considerations. Excerpt on converting REO to rental units:
At the same time that housing demand has weakened, the number of homes for sale is elevated relative to historical norms, due in large part to the swollen inventory of homes held by banks, guarantors, and servicers after completion of foreclosure proceedings. These properties are often called real estate owned, or REO, properties. While the total stock of REO properties is difficult to measure precisely, perhaps one-fourth of the 2 million vacant homes for sale in the second quarter of 2011 were REO properties. The combination of weak demand and elevated supply has put substantial downward pressure on house prices, and the continued flow of new REO properties--perhaps as high as 1 million properties per year in 2012 and 2013--will continue to weigh on house prices for some time. To the extent that REO holders discount properties in order to sell them quickly, the near-term pressure on home prices might be even greater.I suspect the FHFA will announce a bulk sale program of REO to investors within the next month or two.
In contrast to the market for owner-occupied houses, the market for rental housing across the nation has recently strengthened somewhat. Rents have turned up in the past year, and the national vacancy rate on multifamily rental properties has dropped noticeably from its peak in late 2009. These developments have been fairly widespread across metropolitan areas. The relative strength of the rental market reflects increased demand as families who are unable or unwilling to purchase homes are renting properties instead. Rental demand has also been supported by families who have lost their homes to foreclosure--the majority of whom move to rental housing, most commonly to single-family rentals.
The price signals in the owner-occupied and rental housing markets--that is, the decline in house prices and the rise in rents--suggest that it might be appropriate in some cases to redeploy foreclosed homes as rental properties. In addition, the forces behind the decline in the homeownership rate, such as tight credit conditions, are unlikely to unwind significantly in the immediate future, indicating a longer-term need for an expanded stock of rental housing.
Although small investors are currently buying and converting foreclosed properties to rental units on a limited scale, larger-scale conversions have not occurred for at least three interrelated reasons. First, it can be difficult for an investor to assemble enough geographically proximate properties to achieve efficiencies of scale with regard to the fixed costs of a rental program. Second, attracting investors to bulk sales opportunities--whether for rental or resale--has typically required REO holders to offer significantly larger price concessions relative to direct sales to owner occupants through conventional realtor-listing channels, in part because it can be difficult for investors to obtain financing for such sales. Third, the supervisory policy of GSE and banking organization regulators has generally encouraged sales of REO property as early as practicable. We discuss each of these issues in more detail later [in the white paper].
Question #6 for 2012: Unemployment Rate
by Calculated Risk on 1/04/2012 12:54:00 PM
Earlier I posted some questions for next year: Ten Economic Questions for 2012. I'm trying to add some thoughts, and a few predictions for each question.
6) Unemployment Rate: What will the unemployment rate be in December 2012?
Last year, my prediction was for the unemployment rate to still be above 9% in December 2011. As of November, the unemployment rate had fallen to 8.6%. My guess was the participation rate would increase a little in 2011, however the participation rate continued to decline, and that pushed down the unemployment rate.
This is a reminder that forecasting the participation rate is critical in forecasting the unemployment rate.
First a few definitions from the BLS Glossary:
• Civilian noninstitutional population: Included are persons 16 years of age and older residing in the 50 States and the District of Columbia who are not inmates of institutions (for example, penal and mental facilities, homes for the aged), and who are not on active duty in the Armed Forces.
• Labor force: The labor force includes all persons classified as employed or unemployed in accordance with the definitions contained in this glossary.
• Labor force participation rate: The labor force as a percent of the civilian noninstitutional population.
Say the Civilian noninstitutional population was 1 million, and 650,000 participated in the labor force. And say 600,000 were employed leaving 50,000 unemployed. Then the labor force participation rate would be 65%, and the unemployment rate would be 50,000 / 650,000 equals 7.7%.
But if only 640,000 people participated in the labor force, then with the same level of employment (600,000), only 40,000 will be unemployed - and the unemployment rate would be 40,000 / 640,000 equals 6.3%.
So, with the same population and employment level, the participation rate makes a huge difference in the unemployment rate.
There are many reasons why people do not participate in the labor force. Some are in school, some are stay at home spouses, some are retired, and others may have given up looking for a job.
Even before the recent recession started, the participation rate was expected to decline because of the aging of the population. But, with the recession, the participation rate has plummeted.
Here is a graph showing the current unemployment rate (red) and the participation rate (blue).
 Click on graph for larger image.
The unemployment rate is currently at 8.6%, and the Labor Force Participation Rate (blue) was at 64.0% in November.
Although I expect the participation rate to decline over the next couple of decades as the population ages, I think the participation rate will rise a little in 2012.
Below is a table showing the sensitivity of the unemployment rate to various levels of the participation rate and the job creation for 2012.
| Unemployment Rate based on Jobs added and Participation Rate | |||||
|---|---|---|---|---|---|
| Participation Rate | |||||
| 63.5% | 64.0% | 64.5% | 65.0% | ||
| Jobs added per month (000s) | 150 | 7.4% | 8.2% | 8.9% | 9.6% |
| 200 | 7.0% | 7.8% | 8.5% | 9.2% | |
| 250 | 6.7% | 7.4% | 8.1% | 8.8% | |
Although I'm still looking at GDP and employment for 2012, I think the unemployment rate will be mostly unchanged in 2012. A couple of predictions.
• The participation rate will rise slightly in 2012 and probably end the year in the 64.0% to 64.5% range.
• The unemployment rate will still be in the 8% to 9% range in December 2012.
Earlier:
• Question #7 for 2012: State and Local Governments
• Question #8 for 2012: Europe and the Euro
• Question #10 for 2012: Monetary Policy
• Question #9 for 2012: Inflation
Chrysler, Ford and General Motors report December vehicle sales
by Calculated Risk on 1/04/2012 10:25:00 AM
The key number for the economy is the seasonally adjusted annual sales rate (SAAR) compared to the last few months, not the year-over-year comparison provided by the automakers. Once all the reports are released, I'll post a graph of the estimated total December light vehicle sales (SAAR) - usually around 4 PM ET.
From the Detroit Free Press: Chrysler sales up 37% in December; Ford posts 10% gain; GM sees 5% uptick
Chrysler said today sales of new cars and trucks in the U.S. increased 37% in December compared to the same month a year ago ... it sold 138,019 vehicles in December, marking its best month since May 2008.The consensus is for sales to be unchanged from November at around 13.6 million SAAR.
Ford gained a more modest 10% increase in December from a year ago on sales of 210,140 ...
General Motors reported a smaller 5% increase for the month for a total of 234,351 vehicles sold.
MBA: Mortgage Purchase Application Index decreased over Holidays
by Calculated Risk on 1/04/2012 08:16:00 AM
From the MBA: Mortgage Applications Decrease Over Two Week Holiday Period
The Mortgage Bankers Association (MBA) today released its Weekly Mortgage Applications Survey for the weeks ending December 23, 2011 and December 30, 2011.The following graph shows the MBA Purchase Index and four week moving average since 1990.
...
The seasonally adjusted Purchase Index decreased 9.7 percent compared with levels reported two weeks ago. ...
"Mortgage application activity declined over the last two weeks, even after adjusting for the typical seasonal decline in activity. Refinance applications continue to account for the vast majority of total application volume, with the refinance share reaching its highest level in 2011. As part of legislation to extend the payroll tax holiday, guarantee fees for loans purchased by the GSEs and mortgage insurance premiums for FHA loans will eventually increase. Given the announced implementation of this change, we do not expect to see an impact on mortgage rates and application activity until at least February," said Michael Fratantoni, MBA's Vice President of Research and Economics.
 Click on graph for larger image.
The purchase index decreased last week, and the 4-week average decreased slightly. This index has mostly been sideways for the last 2 years - and at about the same level as in 1997.
Tuesday, January 03, 2012
Court Ruling: MBIA wins vs. BofA
by Calculated Risk on 1/03/2012 07:13:00 PM
From Bloomberg: MBIA Wins Judgment Ruling Against Countrywide
MBIA, which says it was duped into guaranteeing payment on Countrywide mortgage bonds, need only show the lender made misrepresentations about the loans backing the bonds, instead of having to prove they caused the losses the insurer is seeking to recover, New York state Judge Eileen Bransten said in a decision.More from the WSJ: MBIA Wins Key Ruling in Mortgage Suit vs. Countrywide
“No basis in law exists to mandate that MBIA establish a direct causal link between the misrepresentations allegedly made by Countrywide and claims made under the policy,” she wrote.
Earlier:
• ISM Manufacturing index indicates faster expansion in December
• Construction Spending increased in November
• FOMC Minutes: Agreement to provide "projections of appropriate monetary policy" in January
• Question #7 for 2012: State and Local Governments
Question #7 for 2012: State and Local Governments
by Calculated Risk on 1/03/2012 04:14:00 PM
Earlier I posted some questions for next year: Ten Economic Questions for 2012. I'm trying to add some thoughts, and a few predictions for each question.
Many of the questions are interrelated. The question on monetary policy depends on inflation (question #9), the unemployment rate (question #6) and what happens in Europe (question #8). And the unemployment rate is related to GDP growth (question #4), and on and on ...
Question #7: State and Local Governments: It is starting to look like there will be less drag in 2012 than in 2011. How much of a drag will state and local budget problems have on economic growth and employment?
How about this headline from Bloomberg this morning: Michigan Fiscal Agency Anticipates $735 Million Budget Surplus for 2011-12? This doesn't mean the cuts are over because the budget assumes further cuts, especially for education. But it suggests progress.
There was a similar article about California a couple of weeks ago in the San Francisco Chronicle: California leaders say time for cuts may be ending. Once again there are more cuts coming, but the end may be in sight.
The National Conference of State Legislatures (NCSL) recently released a report "State Budget Update: Fall 2011,":
State fiscal conditions continue to improve, but at a very slow pace. A fall 2011 survey of state legislative fiscal officers found that the deterioration that dominated state finances in recent years has eased. Revenue performance has improved, expenditures in most states are stable and, in a significant departure from past years, few states are reporting budget gaps in the early months of fiscal year (FY) 2012. However, despite these positive developments, the effects of the Great Recession continue to linger. State tax collections still remain well below pre-recession levels.Note: "Fiscal years for all but four states—Alabama, Michigan, New York, and Texas—begin on July 1.", Source. So the FY 2012 budgets (and associated cuts) will end on June 30, 2012.
With the enactment of their FY 2012 budgets, lawmakers successfully closed a cumulative budget gap of $91 billion. This is on top of shortfalls that states began
addressing in FY 2008. In total, lawmakers have resolved an aggregate gap of more than $500 billion over four consecutive years. But the tide may be turning. Halfway into the second quarter of FY 2012, new gaps are practically non-existent.
Here is a table of the annual change in state and local GDP and payroll employment for the last several years. State and local governments have been a significant drag on both GDP and payroll employment.
| State and Local Government | ||
|---|---|---|
| Change, Employment (000s) | Change in Real GDP | |
| 2008 | 160 | 0.0% |
| 2009 | -132 | -0.9% |
| 2010 | -249 | -1.8% |
| 2011e | -246 | -2.2% |
| 2012f | -100 | -1.0% |
Note: estimate for 2011, forecast for 2012 (aka guess).
It is looking like there will be less drag from state and local governments in 2012, and that most of the drag will be over by the end of Q2 (end of FY 2012). This doesn't mean state and local government will add to GDP in the 2nd half of 2012, just that the drag on GDP and employment will probably end. Just getting rid of the drag will help.
This is a significant improvement from last year!
A final comment: there was a debate last year if there would be a large number of muni defaults in 2011. One analyst predicted "hundreds of billions of dollars' worth of defaults". I disagreed strongly with that prediction, and the total defaults was only a small fraction of that number. With improving finances, the threat of a huge number of muni defaults is even less likely in 2012.
Earlier:
• Question #8 for 2012: Europe and the Euro
• Question #10 for 2012: Monetary Policy
• Question #9 for 2012: Inflation
FOMC Minutes: Agreement to provide "projections of appropriate monetary policy" in January
by Calculated Risk on 1/03/2012 02:00:00 PM
From the Fed: Minutes of the Federal Open Market Committee, December 13, 2011 and conference call on November 28th. Excerpts:
In their discussion of the economic situation and outlook, meeting participants agreed that the information received since their previous meeting indicated that economic activity was expanding at a moderate rate, notwithstanding some apparent slowing in global economic growth.And there was discussion about communication:
...
Regarding the economic outlook, participants continued to anticipate that economic activity would expand at a moderate rate in the coming quarters and that, consequently, the unemployment rate would decline only gradually. The factors that participants cited as likely to restrain the pace of the economic expansion included an expectation that financial markets would remain unsettled until the fiscal and banking issues in the euro area were more fully addressed. Other factors that were expected to weigh on the pace of economic activity were the slowdown of economic activity abroad, fiscal tightening in the United States, high levels of uncertainty among households and businesses, the weak housing market, and household deleveraging. In assessing the economic outlook, participants judged
that strains in global financial markets continued to pose significant downside risks. With the rate of increase in economic activity anticipated to remain moderate, most participants expected that inflation would settle over coming quarters at or below levels consistent with their estimates of its longer-run mandate consistent rate.
After the Committee’s vote, participants turned to a further consideration of ways in which the Committee might enhance the clarity and transparency of its public communications. The subcommittee on communications recommended an approach for incorporating information about participants’ projections of appropriate future monetary policy into the Summary of Economic Projections (SEP), which the FOMC releases four times each year. In the SEP, participants’ projections for economic growth, unemployment, and inflation are conditioned on their individual assessments of the path of monetary policy that is most likely to be consistent with the Federal Reserve’s statutory mandate to promote maximum employment and price stability, but information about those assessments has not been included in the SEP.
...
At the conclusion of their discussion, participants decided to incorporate information about their projections of appropriate monetary policy into the SEP beginning in January. Specifically, the SEP will include information about participants’ projections of the appropriate level of the target federal funds rate in the fourth quarter of the current year and the next few calendar years, and over the longer run; the SEP also will report participants’ current projections of the likely timing of the first increase in the target rate given their projections of future economic conditions. An accompanying narrative will describe the key factors underlying those assessments as well as qualitative information regarding participants’ expectations for the Federal Reserve’s balance sheet.


