 RSS Feed
 by Calculated Risk on 12/31/2011 08:30:00 PM
Saturday, December 31, 2011
Happy New Year!

A cartoon from Eric G. Lewis
My New Year's resolution: Get lost in the mountains for a few weekends this year.
Happy New Year to all!
Earlier:
• Summary for Week Ending December 30th
• Schedule for Week of Jan 1, 2012
Schedule for Week of Jan 1, 2012
by Calculated Risk on 12/31/2011 01:06:00 PM
Earlier:
• Summary for Week Ending December 30th
Happy New Year! The key report for this week will be the December employment report to be released on Friday, Jan 6th. Other key reports include the ISM manufacturing index on Tuesday, vehicle sales on Wednesday, and the ISM non-manufacturing (service) index on Thursday.
Note: Reis is expected to release their Q4 Office, Mall and Apartment vacancy rate reports this week. Last quarter Reis reported falling vacancy rates for apartments, rising vacancy rates for regional malls, and a slight decline in the office vacancy rate.
All US markets will be closed in observance of the New Year's holiday.
10:00 AM: Construction Spending for November. The consensus is for a 0.5% increase in construction spending.
 10:00 AM ET: ISM Manufacturing Index for December.
 Here is a long term graph of the ISM manufacturing index. The consensus is for a slight increase to 53.2 from 52.7 in November.
2:00 PM: FOMC Minutes, Meeting of December 13, 2010.
7:00 AM: The Mortgage Bankers Association (MBA) will release the mortgage purchase applications index. This index has been especially weak all year, although this doesn't include cash buyers.
10:00 AM: Manufacturers' Shipments, Inventories and Orders (Factory Orders) for November. The consensus is for a 1.9% decline in orders.
All day: Light vehicle sales for December. Light vehicle sales are expected to be unchanged at 13.6 million (Seasonally Adjusted Annual Rate).
 This graph shows light vehicle sales since the BEA started keeping data in 1967. The dashed line is the November sales rate.
 Growth in auto sales should make a strong positive contribution to Q4 GDP. Sales in Q3 averaged 12.45 million SAAR, and so far (October and November) sales have averaged 13.42 million SAAR in Q4, an increase of 7.6% over Q3.
Edmunds is forecasting:
[A] projected Seasonally Adjusted Annual Rate (SAAR) of 13.4 million units, forecasts Edmunds.com ... The sales pace is a slight dip from the 13.6 million SAAR recorded last month.And TrueCar is forecasting:
The December 2011 forecast translates into a Seasonally Adjusted Annualized Rate (SAAR) of 13.5 million new car sales
8:15 AM: The ADP Employment Report for December. This report is for private payrolls only (no government). The consensus is for 160,000 payroll jobs added in November, down from the 206,000 reported in November.
8:30 AM: The initial weekly unemployment claims report will be released. The consensus is for a decline to 375,000 from 381,000 last week. Last week was the lowest level for the 4-week average of weekly claims since mid-2008.
 10:00 AM: ISM non-Manufacturing Index for December. The consensus is for an increase to 53.4 from 52.0 in November. Note: Above 50 indicates expansion, below 50 contraction.
This graph shows the ISM non-manufacturing index (started in January 2008) and the ISM non-manufacturing employment diffusion index.
 8:30 AM: Employment Report for December. The consensus is for an increase of 150,000 non-farm payroll jobs in December, up from the 120,000 jobs added in November.
 The consensus is for the unemployment rate to increase slightly to 8.7% in December from 8.6% in November.
This second employment graph shows the percentage of payroll jobs lost during post WWII recessions through November.
 Through the first eleven months of 2011, the economy has added 1.448 million total non-farm jobs or just 131 thousand per month. This is a better pace of payroll job creation than last year, but the economy still has 6.2 million fewer payroll jobs than at the beginning of the 2007 recession. The economy has added 1.711 million private sector jobs this year, or about 156 thousand per month.
Summary for Week Ending December 30th
by Calculated Risk on 12/31/2011 09:00:00 AM
This was a light holiday week in the US. The data was mixed, although generally better than expected. Beating low expectations has been a recent theme.
The Conference Board reported an increase in consumer confidence, the Chicago purchasing managers' index was essentially unchanged (better than expected), and pending home sales increased.
Initial weekly unemployment claims increased somewhat, but the 4-week average is at the lowest level since mid-2008. And Case-Shiller reported house prices are at new post-bubble lows (seasonally adjusted).
Here is a summary of last week in graphs:
• Case Shiller: House Prices fall to new post-bubble low in October
From S&P: The Fourth Quarter Starts with Broad-based Declines in Home Prices According to the S&P/Case-Shiller Home Price Indices
Data through October 2011, released today by S&P Indices for its S&P/Case-Shiller1 Home Price Indices ... showed decreases of 1.1% and 1.2% for the 10- and 20-City Composites in October vs. September. Nineteen of the 20 cities covered by the indices also saw home prices decrease over the month. The 10- and 20-City Composites posted annual returns of -3.0% and -3.4% versus October 2010, respectively.
 Click on graph for larger image.
 This graph shows the nominal seasonally adjusted Composite 10 and Composite 20 indices (the Composite 20 was started in January 2000).
The Composite 10 index is off 32.9% from the peak, and down 0.5% in October (SA). The Composite 10 is at a new post bubble low (Seasonally adjusted), but still above the low NSA.
The Composite 20 index is off 33.0% from the peak, and down 0.6% in October (SA). The Composite 20 is also at a new post-bubble low.
 This graph shows the price declines from the peak for each city included in S&P/Case-Shiller indices.
Prices increased (SA) in 4 of the 20 Case-Shiller cities in October seasonally adjusted (only one city increased NSA). Prices in Las Vegas are off 61.3% from the peak, and prices in Dallas only off 8.8% from the peak.
The NSA indexes are only about 2% above the March 2011 lows - and these indexes will hit new lows in the next few months since prices are falling again. Using the SA data, the Case-Shiller indexes are now at new post-bubble lows!
• Real House Prices and House Price-to-Rent
 This graph shows the quarterly Case-Shiller National Index SA (through Q3 2011), and the monthly Case-Shiller Composite 20 SA and CoreLogic House Price Indexes (through October) in nominal terms (as reported).
In nominal terms, the Case-Shiller National index (SA) is back to Q4 2002 levels, the Case-Shiller Composite 20 Index (SA) is back to March 2003 levels, and the CoreLogic index is back to May 2003.
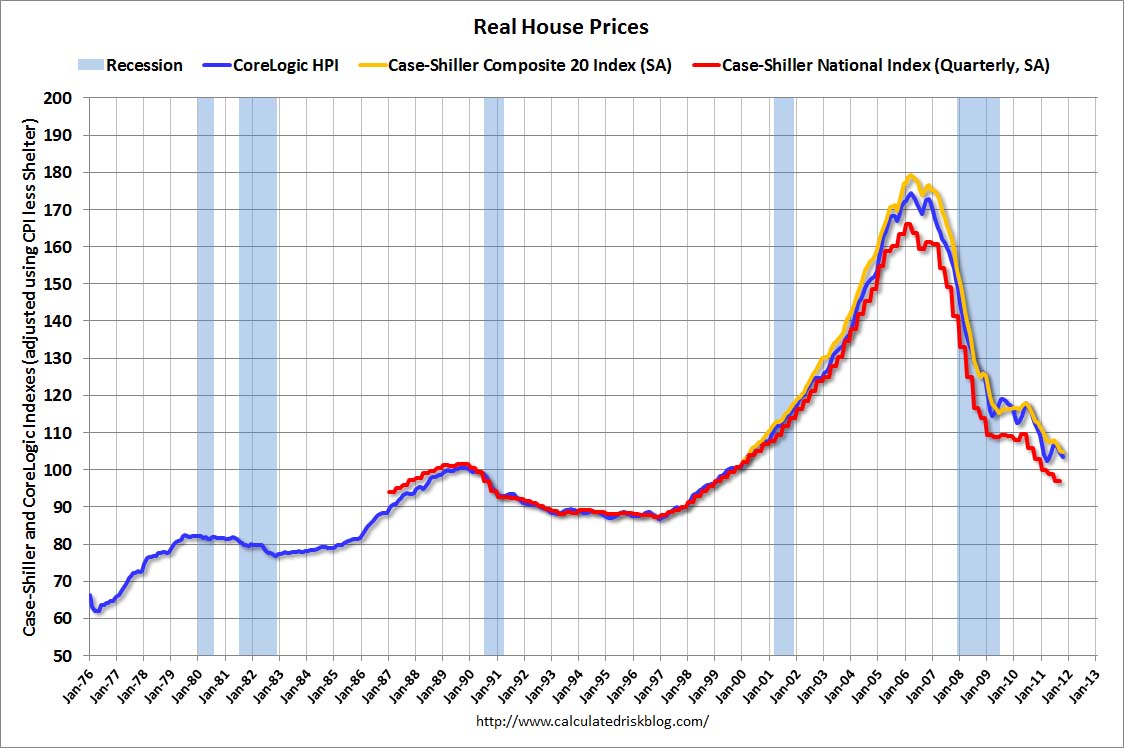 Here are the same three indexes in real terms (adjusted for inflation using CPI less Shelter). Note: some people use other inflation measures to adjust for real prices.
In real terms, the National index is back to Q1 1999 levels, the Composite 20 index is back to April 2000, and the CoreLogic index back to March 2000.
In real terms, all appreciation in the '00s is gone.
In October 2004, Fed economist John Krainer and researcher Chishen Wei wrote a Fed letter on price to rent ratios: House Prices and Fundamental Value. Kainer and Wei presented a price-to-rent ratio using the OFHEO house price index and the Owners' Equivalent Rent (OER) from the BLS.
 Here is a similar graph using the Case-Shiller Composite 20 and CoreLogic House Price Index.
This graph shows the price to rent ratio (January 1998 = 1.0).
On a price-to-rent basis, the Composite 20 index is back to March 2000 levels, and the CoreLogic index is back to May 2000.
In real terms - and as a price-to-rent ratio - prices are mostly back to 2000 levels and will probably be back to 1999 levels in the next few months.
• Regional Fed Surveys and ISM Manufacturing Index
The regional surveys provide a hint about the ISM manufacturing index - and the regional surveys were mixed in December although they showed some improvement in the aggregate.
From the Kansas City Fed: Tenth District Manufacturing Activity Eased Slightly
From the Dallas Fed: Texas Manufacturing Activity Edges Down
 Here is a graph comparing the regional Fed surveys and the ISM manufacturing index.
The New York and Philly Fed surveys are averaged together (dashed green, through December), and five Fed surveys are averaged (blue, through December) including New York, Philly, Richmond, Dallas and Kansas City. The Institute for Supply Management (ISM) PMI (red) is through November (right axis).
The ISM index for December will be released Tuesday, Jan 3rd and the regional surveys suggest another reading in the low to mid 50s for December.
• Weekly Initial Unemployment Claims increase to 381,000
 This graph shows the 4-week moving average of weekly claims since January 2000.
The dashed line on the graph is the current 4-week average. The four-week average of weekly unemployment claims decreased this week to 375,000.
This is the lowest level for the 4-week average since June 2008.
• Other Economic Stories ...
• Chicago PMI: The overall index declined slightly to 62.5 in December from 62.6 in November. "EMPLOYMENT erased November's deceleration; ORDER BACKLOGS expanded to its highest level since April 2011"
• From the NAR: Pending Home Sales Highest in a Year-and-a-Half
• Fannie Mae and Freddie Mac Serious Delinquency Rates: Slight increase for Freddie in November
• Restaurant Performance Index increased in November
• Hotels: Occupancy Rate back to pre-recession levels
Friday, December 30, 2011
Merkel: "Will do everything to strengthen the euro"
by Calculated Risk on 12/30/2011 07:30:00 PM
And another reminder that Europe will remain on the front pages in 2012:
From Bloomberg: Merkel Says She’ll ’Do Everything’ to Save Euro
German Chancellor Angela Merkel said she expects turbulence in 2012 as she does “everything” to save the euro amid the Europe’s sovereign debt crisis.Meanwhile, more the Telegraph: 'Euro will be stable' claim is ridiculed
“The path to overcoming this won’t be without setbacks but at the end of this path Europe will emerge stronger from the crisis than before” ... “Today, you can trust that I will do everything to strengthen the euro,” Merkel said. “This will only succeed if Europe learns from the mistakes of the past. One of these is that a common currency can only be successful if we cooperate more than in the past in Europe.”
[German finance minister] Wolfgang Schauble said he was confident that the currency union will survive and the political measures will underpin the shattered eurozone economies. "We will be far enough along in the next 12 months that we will have banished the dangers of contagion and stabilised the eurozone," he told newspaper Handelsblatt.Unfortunately Schauble has consistently been wrong, and believes the answer is always more austerity.
Question #9 for 2012: Inflation
by Calculated Risk on 12/30/2011 02:56:00 PM
Last weekend I posted some questions for next year: Ten Economic Questions for 2012. I'll try to add some thoughts, and maybe some predictions for each question over the next week.
Many of the questions are interrelated. The question on monetary policy depends on inflation (question #9), the unemployment rate (question #6) and what happens in Europe (question #8). And the unemployment rate is related to GDP growth (question #4), and on and on ...
9) Inflation: Will the inflation rate rise or fall in 2012?
Over the last 12 months, several key measures of inflation have shown increases: CPI (Consumer Price Index) rose 3.4%, the median CPI increased 2.2%, the trimmed-mean CPI increased 2.5%, core CPI (less food and energy) increased 2.2%, and core PCE prices increased 1.6% (Q3 2010 to Q3 2011).
 Click on graph for larger image.
This graph shows core CPI, median CPI and trimmed-mean CPI on a year-over-year basis.
Early in the year there was a spike in energy prices, and it appears there was some spillover into these core measures. However, over the last few months, the rate of inflation has slowed. As an example, core PCE has increased at a 1.5% annual rate over the last 3 months.
In November, on a monthly basis, the median Consumer Price Index increased 1.1% at an annualized rate, the 16% trimmed-mean Consumer Price Index increased 1.0% annualized, and core CPI increased 2.1% annualized.
 Also inflation expectations are not indicating a significant increase in inflation. In fact expectations are for further declines in inflation.
This makes sense because of the slack in the system, and also because deflation is the usual concern following a credit bubble and financial crisis, not inflation.
There are some people who have been predicting an imminent rapid increase in inflation for almost 3 years - in their view, a sharp increase in inflation is always just around the corner. That view has consistently been wrong, although some people also claim the government measures are not correct and that inflation is much higher than reported.
 However private measures show similar results as BEA and BLS measures (see The Billion Prices Project).
The MIT prices are mostly for goods, because as they note: "The price of services, in particular, are not easy to find online and therefore are not included in our statistics." This is important because, according to the BEA, prices of good have increased significantly faster than the price of services over the last year (Prices for goods have increased 3.9%, and prices for service 1.6% from Q3 2010 to Q3 2011). So, if anything, the MIT prices overstate inflation by excluding most services.
The bottom line is the inflation rate will probably stay low in 2012 with high unemployment and low resource utilization. I expect QE3 to be announced before mid-year, and that will probably keep the inflation rate near the Fed's target (as opposed to falling further). But I don't see inflation as a significant threat in 2012.
Earlier:
• Question #10 for 2012: Monetary Policy
Hotels: Occupancy Rate back to pre-recession levels
by Calculated Risk on 12/30/2011 01:38:00 PM
From HotelNewsNow.com: STR: US results for week ending 24 December
The U.S. hotel industry experienced increases in all three key performance metrics during the week of 18-24 December 2011, according to data from STR.This is the weak season for hotel occupancy, but this is a fairly strong improvement over 2010. However ADR is still about 4% below the rate for the same week in 2008. Note: ADR: Average Daily Rate, RevPAR: Revenue per Available Room.
In year-over-year comparisons for the week, occupancy rose 8.1 percent to 37.3 percent, average daily rate increased 2.7 percent to US$89.48 and revenue per available room finished the week with an increase of 11.0 percent to US$33.39.
The following graph shows the seasonal pattern for the hotel occupancy rate using a four week average.
 Click on graph for larger image.
Hotels have seen a solid finish to 2011. The 4-week average of the occupancy rate is back to normal.
Looking forward, the 4-week average will decline until mid-January and then start to increase again (the normal seasonal pattern). February and March are the next key period - that is when business travel usually picks up.
Data Source: Smith Travel Research, Courtesy of HotelNewsNow.com
Restaurant Performance Index increased in November
by Calculated Risk on 12/30/2011 11:39:00 AM
From the National Restaurant Association: Restaurant Industry Outlook Improved in November as Restaurant Performance Index Rose to Five-Month High
The RPI – a monthly composite index that tracks the health of and outlook for the U.S. restaurant industry – stood at 100.6 in November, up 0.6 percent from October. In addition, November represented the second time in the last three months that the RPI stood above 100, which signifies expansion in the index of key industry indicators.
“The November increase in the Restaurant Performance Index was fueled by broad-based gains in both the current situation and forward-looking indicators,” said Hudson Riehle, senior vice president of the Research and Knowledge Group for the Association. “Restaurant operators reported their strongest net positive same-store sales results in more than four years, while customer traffic levels also grew in November.”
...
Restaurant operators reported positive same-store sales for the sixth consecutive month inNovember. ... Restaurant operators also reported stronger customer traffic levels in November. ... Capital spending activity among restaurant operators trended upward in recent months. Forty-six percent of operators said they made a capital expenditure for equipment, expansion or remodeling during the last three months, the highest level in five months.
 Click on graph for larger image.
The index increased to 100.6 in November (above 100 indicates expansion).
Unfortunately the data for this index only goes back to 2002.
Restaurant spending is discretionary and is impacted by the overall economy. This index showed contraction in July and August, but is now positive again.
Fannie Mae and Freddie Mac Serious Delinquency Rates: Slight increase for Freddie in November
by Calculated Risk on 12/30/2011 08:54:00 AM
Fannie Mae reported that the Single-Family Serious Delinquency rate was unchanged at 4.00% in November. This is down from 4.50% in November of 2010. The Fannie Mae serious delinquency rate peaked in February 2010 at 5.59%.
Freddie Mac reported that the Single-Family serious delinquency rate increased to 3.57% in November, up from 3.54% in October. This is down from 3.85% in November 2010. Freddie's serious delinquency rate peaked in February 2010 at 4.20%.
These are loans that are "three monthly payments or more past due or in foreclosure".
 Click on graph for larger image
The increase in November (unchanged for Fannie) is probably seasonal. The serious delinquency rates have been declining, but declining very slowly. The reason for the slow decline is most likely the backlog of homes in the foreclosure process.
The "normal" serious delinquency rate is under 1%, and at this pace of decline, the delinquency rate will not be back to "normal" for a long time.
Early in 2012, a mortgage settlement agreement with the servicers might be reached, and that might lead to more modifications and foreclosures - so the delinquency rate might decline faster. Also Fannie and Freddie are expected to announce a bulk sale of REO to investors (and possible rental program) early next year - and that might also lead to more foreclosures.
Thursday, December 29, 2011
Gasoline Prices and Brent WTI Spread
by Calculated Risk on 12/29/2011 07:53:00 PM
The year is almost over and once again a key downside risk for the economy is high gasoline prices. According to Bloomberg, Brent Crude is up to $108.10 per barrel, while WTI is up to $99.76. These prices have kept gasoline prices high, and pushed down vehicle miles driven in the US.
Although prices were higher in the first half of 2008, it is possible that the average annual price for oil and gasoline in 2012 will see a new record high.
If the global economy really slows, oil and gasoline prices will probably fall - and probably offset some of the impact from lower exports. Unfortunately turmoil in the Middle East (this time with Iran) might be pushing up oil prices.
This following graph shows the prices for Brent and WTI over the last few years. Usually the prices track pretty closely, but the "glut" of oil at Cushing pushed down WTI prices relative to Brent.
 Click on graph for larger image.
The spread has narrowed over the last couple of months following the announcement of a partial reversal of the Seaway pipeline to transport crude oil from Cushing, Oklahoma, to the Gulf Coast (the pipeline is scheduled to be reversed in Q2 2012).
And below is a graph of gasoline prices. Gasoline prices have been slowly moving down since peaking in early May. Note: The graph below shows oil prices for WTI; gasoline prices in most of the U.S. are impacted more by Brent prices.
| Orange County Historical Gas Price Charts Provided by GasBuddy.com |
Labor Force Participation: The Kids are Alright Part 2
by Calculated Risk on 12/29/2011 04:13:00 PM
A few weeks ago, I posted: Labor Force Participation Rate: The Kids are Alright
Catherine Rampell at the NY Times adds some more data: Instead of Work, Younger Women Head to School
Workers are dropping out of the labor force in droves, and they are mostly women. In fact, many are young women. But they are not dropping out forever; instead, these young women seem to be postponing their working lives to get more education.

[M]any of the workers on the sidelines are young people upgrading their skills, which could portend something like the postwar economic boom, when millions of World War II veterans went to college through the G.I. Bill instead of immediately entering, and overwhelming, the job market.The flip side is that many older workers are also going back to school and getting student loans, see: Middle-aged borrowers piling on student debt (ht Ann)
Both men and women are going back to school, but the growth in enrollment is significantly larger for women (who dominated college campuses even before the financial crisis). In the last two years, the number of women ages 18 to 24 in school rose by 130,000, compared with a gain of 53,000 for young men.
...
The main risk in going back to school is the accompanying student loan debt.
Middle-aged borrowers are piling up student debt faster than any other age group, according to a new analysis obtained by Reuters.That is deeply concerning.
But in the long run, more education is a positive for the economy - and Rampell's article suggests the kids (well, young adults) are alright!


