 RSS Feed
 by Calculated Risk on 12/29/2011 11:45:00 AM
Thursday, December 29, 2011
Kansas City Fed manufacturing index "eased slightly" in December
This is the last of the regional Fed surveys for December. The regional surveys provide a hint about the ISM manufacturing index - and the regional surveys were mixed in December although they showed some improvement in the aggregate.
From the Kansas City Fed: Tenth District Manufacturing Activity Eased Slightly
According to Chad Wilkerson, vice president and economist at the Federal Reserve Bank of Kansas City, the survey revealed that Tenth District manufacturing activity eased slightly, but expectations for future months improved somewhat.Here is a graph comparing the regional Fed surveys and the ISM manufacturing index:
“We saw a slight moderation in factory activity in our region in December,” said Wilkerson. “But plant managers continue to expect solid growth in the months ahead and are planning to increase employment and capital spending accordingly.”
...
The month-over-month composite index was -4 in December, down from 4 in November and 8 in October, and the first negative reading since December 2009 ... Most other month-over-month indexes also fell somewhat in December. The production and shipments indexes moved into negative territory, and the new orders and order backlog indexes fell further. The employment index dropped to its lowest level since mid-2009, and the new orders for exports index edged down.
 Click on graph for larger image.
The New York and Philly Fed surveys are averaged together (dashed green, through December), and five Fed surveys are averaged (blue, through December) including New York, Philly, Richmond, Dallas and Kansas City. The Institute for Supply Management (ISM) PMI (red) is through November (right axis).
The ISM index for December will be released Tuesday, Jan 3rd and the regional surveys suggest another reading in the low to mid 50s. for December.
Misc: Chicago PMI at 62.5, Pending Home Sales increase
by Calculated Risk on 12/29/2011 10:10:00 AM
• Chicago PMI: The overall index declined slightly to 62.5 in December from 62.6 in November. This was above consensus expectations of 60.1. Note: any number above 50 shows expansion.
• From the NAR: Pending Home Sales Highest in a Year-and-a-Half
The Pending Home Sales Index, a forward-looking indicator based on contract signings, increased 7.3 percent to 100.1 in November from an upwardly revised 93.3 in October and is 5.9 percent above November 2010 when it stood at 94.5. The October upward revision resulted in a 10.4 percent monthly gain.
The last time the index was higher was in April 2010 when it reached 111.5 as buyers rushed to beat the deadline for the home buyer tax credit.
...
The PHSI in the Northeast rose 8.1 percent to 77.1 in November but is 0.3 percent below November 2010. In the Midwest the index increased 3.3 percent to 91.6 in November and is 9.5 percent above a year ago. Pending home sales in the South rose 4.3 percent in November to an index of 103.8 and remain 8.7 percent above November 2010. In the West the index surged 14.9 percent to 121.2 in November and is 2.9 percent higher than a year ago.
Weekly Initial Unemployment Claims increase to 381,000
by Calculated Risk on 12/29/2011 08:39:00 AM
The DOL reports:
In the week ending December 24, the advance figure for seasonally adjusted initial claims was 381,000, an increase of 15,000 from the previous week's revised figure of 366,000. The 4-week moving average was 375,000, a decrease of 5,750 from the previous week's revised average of 380,750.The following graph shows the 4-week moving average of weekly claims since January 2000.
 Click on graph for larger image.
The dashed line on the graph is the current 4-week average. The four-week average of weekly unemployment claims decreased this week to 375,000.
This is the lowest level for the 4-week average since June 2008.
And here is a long term graph of weekly claims:
 Although initial claims increased this week, the 4-week moving average is still falling and is now well below 400,000.
Wednesday, December 28, 2011
A Pickup for Housing in 2012?
by Calculated Risk on 12/28/2011 06:16:00 PM
Residential investment made a small positive contribution to GDP in 2011, for the first time since 2005. And construction employment turned slightly positive in 2011.
Now the question is what will happen in 2012? I think some pickup is likely, but I'm not as optimistic as some other people ...
From the WSJ: Hedge Funds See Rebirth for U.S. Housing
Hedge funds run by Caxton Associates LP, SAC Capital Advisors LP, Avenue Capital and Blackstone Group LP have been buying housing-related investments, betting on a rebound. And formerly bearish research firm Zelman & Associates now predicts a housing pickup, as does Goldman Sachs Group Inc.Of course there are still housing bears:
...
Even some housing skeptics acknowledge that real estate may no longer be the drag it has been on the economy. ... "I'm sold that it's a bottom," says James Bianco, who runs Bianco Research, in Chicago. "It's gone from a negative to a nothing for the economy," ...
Ivy Zelman [predicts] that rising rents will push would-be buyers to purchase homes. A housing recovery isn't "happening as fast as everyone would like," she says. But there are "a lot of pillars in place to give us some optimism."
"The smartest money in the world has been carried out on stretchers betting on a true recovery for housing," says Mark HansonI think we will probably see some increase in new home sales in 2012, but it will be from a very low level (around 300 thousand new homes will be sold in 2011, a record low since the Census Bureau started tracking new home sales in 1963). I'll have more on housing and residential investment soon.
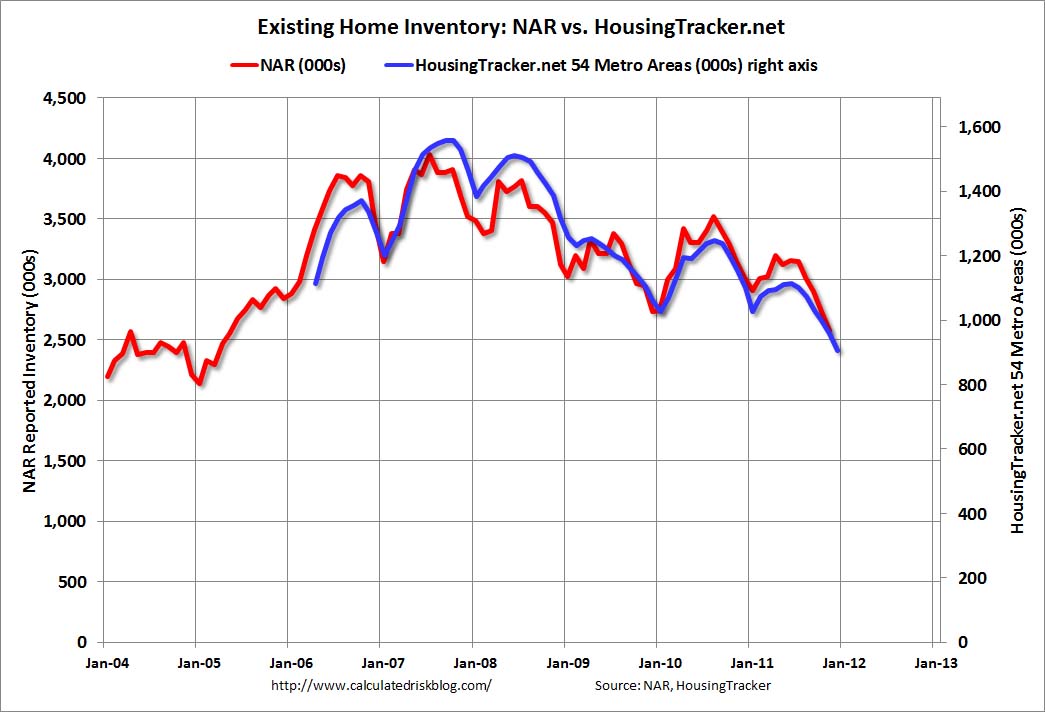
Existing Home Inventory declines 18% year-over-year in December
by Calculated Risk on 12/28/2011 01:45:00 PM
Another update: I've been using inventory numbers from HousingTracker / DeptofNumbers to track changes in inventory. Tom Lawler mentioned this back in June.
According to the deptofnumbers.com for monthly inventory (54 metro areas), listed inventory is probably back to early 2005 levels. Unfortunately the deptofnumbers only started tracking inventory in April 2006.
This graph shows the NAR estimate of existing home inventory through November (left axis) and the HousingTracker data for the 54 metro areas through December.
 Click on graph for larger image.
This is the first update since the NAR released their revisions for sales and inventory. Now the NAR and HousingTracker are pretty close.
There is a seasonal pattern for inventory, bottoming in December and January and peaking during the summer months. So inventory will probably decline again next month and then start increasing in February.
The second graph shows the year-over-year change in inventory for both the NAR and HousingTracker.
 HousingTracker reported that the December listings - for the 54 metro areas - declined 17.6% from the same month last year. For the final week in December, inventory is down 18.4% from a year ago.
This is just inventory listed for sale, sometimes referred to as "visible inventory". There is also a large "shadow inventory" that is currently not on the market, but is expected to be listed in the next few years. Shadow inventory could include bank owned properties (REO: Real Estate Owned), properties in the foreclosure process, other properties with delinquent mortgages (both serious delinquencies of over 90+ days, and less serious), condos that were converted to apartments (and will be converted back), investor owned rental properties, and homeowners "waiting for a better market", and a few other categories - as long as the properties are not currently listed for sale. Some of this "shadow inventory" will be forced on the market, such as completed foreclosures, but most of these sellers will probably wait for a "better market".
However listed inventory has clearly declined in many areas. And it is the listed months-of-supply combined with the number of distressed sales that mostly impacts prices. (note: there are still 7 months of supply because both sales and inventory have declined).
Question #10 for 2012: Monetary Policy
by Calculated Risk on 12/28/2011 11:46:00 AM
Over the weekend I posted some questions for next year: Ten Economic Questions for 2012. I'll try to add some thoughts, and maybe some predictions for each question over the next week.
Many of the questions are interrelated. The question on monetary policy depends on inflation (question #9), the unemployment rate (question #6) and what happens in Europe (question #8). And the unemployment rate is related to GDP growth (question #4), and on and on ...
10) Monetary Policy: Will the Fed introduce QE3? Will the Fed change their communication strategy and include the likely future path of the Fed Funds rate?
Last year many analysts were arguing that the Fed would end QE2 early and raise rates before the end of 2011. That seemed very unlikely. Not only didn't the Fed raise rates, but they went a step further at the August meeting and dropped the somewhat ambiguous "extended period" language and replaced it with a time frame: "economic conditions ... are likely to warrant exceptionally low levels for the federal funds rate at least through mid-2013."
Now it appears the FOMC will drop the time frame from the FOMC statement and replace it with a forecast of the likely future path of the Fed Funds rate. There have been several recent articles suggesting this change (see the WSJ: Federal Reserve Prepares to Make Itself Perfectly Clear and Fed Could Keep Rates Near Zero Into 2014)
When the Fed revises its communications approach, there is a good chance it will cease offering a fixed date for the timing of rate increases. Instead, officials could signal their intentions by publishing a range of their forecasts for rates along with their quarterly economic projections.This change in communication strategy will probably happen at the two day January FOMC meeting on the 24th and 25th.
There is also a good chance the Fed will embark on another round of Large Scale Asset Purchases (LSAP or QE3) in 2012. The Fed will probably take a wait and see approach early in the year, and QE3 would be dependent on the unemployment rate and inflation (the Fed's dual mandate).
If the economy tracks the most recent projections, QE3 would seem likely at either the April or June meetings. Others are arguing that QE3 could happen at the March meeting. If the economy performs better than expected, then the Fed will probably wait longer. QE3 will probably be focused on purchases of agency Mortgage Backed Securities (MBS).
Of course, if the economy performs worse than projected early in the year - or Europe implodes - the Fed would probably move quickly on QE3.
To summarize my views:
• I expect the Fed will change their communication strategy and add a likely future path of the Fed Funds rate to the quarterly economic forecasts.
• I think QE3 is likely, but more towards mid-year - and is data dependent.
Italian bond yields decline
by Calculated Risk on 12/28/2011 08:53:00 AM
From the NY Times: Italy's Borrowing Costs Drop Sharply at Auction
The sale of €9 billion, or $11.8 billion, of six-month Treasury bills was seen as the first post-holiday pointer to condition of the beleaguered euro zone.The Italian 2 year yield is down to 4.95% - the lowest level since October, but the 10 year yield is still at 6.86%.
The bills were sold at a yield of 3.251 percent, sharply down from 6.504 percent at a previous auction in late November. ... In an auction of two-year bonds, which raised €1.7 billion, the yield fell to 4.853 percent from 7.814 percent last month.
The Spanish 2 year yield is down sharply to 3.26%, and the 10 year yield is down to 5.09%.
But the Italian economy is weak:
Italy suffered its biggest decline in Christmas retail sales in 10 years, according to data released this week by the consumer group Codacons, reflecting the impact of the souring economy.
It was a similar picture in Greece, headed for a fourth year of recession in 2012. The country’s near-record unemployment was reflected in a 30 percent drop in pre-Christmas sales, the ESEE retail federation said Tuesday.
Tuesday, December 27, 2011
Lawler: Completed Foreclosure Sales in 2011 to Fall Well Below 2010 Levels
by Calculated Risk on 12/27/2011 09:36:00 PM
From economist Tom Lawler:
While data on the number of loans either seriously delinquent or in the foreclosure process suggested that an increase in the number of residential properties lost to foreclosure this year was a “slam dunk,” incoming data suggest that in fact the numbers will be down significantly from 2010, and will in fact probably come in at the lowest level since 2007!
Of course, there are no “official” data on completed foreclosure sales. However, estimates both from RealtyTrac through November and Hope Now through October suggest that this will in fact be the case.
Moreover, estimates from Hope Now on the number of completed foreclose sales on owner-occupied properties suggest that such foreclosures will be down very sharply this year. Unfortunately, Hope Now only started reporting the breakout by occupancy status in December 2009.
Short sales and DILs, in contrast are likely to be up in 2011 compared to 2010, at least according to estimates derived from Hope Now data. Unfortunately, Hope Now data doesn't allow for an estimate of SS/DILs by occupancy type, and HN didn’t start releasing data that allowed one to derive estimated short sales/DILs until early 2010.
Here is a table of what completed foreclosure sales and short sales/DILs for residential first-lien mortgages might end up looking like for 2011, compared to the last 3 years.
Completed foreclosure sales are estimates from Hope Now, and the 2010 and 2011 short sales/DILs estimates are derived from Hope Now data. 2008 and 2009 short sales/DILs are my own estimates derived from Fannie, Freddie, FHA, and OCC mortgage metrics data. The data on the number of seriously delinquent loans and loans in the process of foreclosure are from LPS analytics (whose estimate might differ from Hope Now’s, if HN produced such estimates).
| Completed Foreclosure Sales And Short Sales/DILs (thousands, estimates) | ||||
|---|---|---|---|---|
| 2008 | 2009 | 2010 | 2011(E) | |
| Completed Foreclosure Sales | 914 | 949 | 1,070 | 815 |
| Owner-occupied | N.A. | N.A. | 785 | 608 |
| Non-owner-occupied | N.A. | N.A. | 285 | 207 |
| Short Sales/DILs | 105 | 270 | 354 | 380 |
| Foreclosures plus Short Sales/DILs | 1,019 | 1,219 | 1,424 | 1,195 |
| Outstanding first liens: | Jan-08 | Jan-09 | Jan-10 | Jan-11 |
| Seriously Delinquent (90+) | 1,016 | 1,983 | 3,061 | 2,168 |
| In Process of Foreclosure | 860 | 1,386 | 2,110 | 2,203 |
Given the number of loans either seriously delinquent or in the process of foreclosure at the beginning of the year, the number of completed foreclosure sales in 2011 is almost absurdly low, reflecting the complete screw-up of the mortgage servicing industry, and the resulting dramatic slowdown in foreclosure resolutions. As of the end of October, 2011 LPS estimated that there were 1.759 million seriously delinquent loans with the average number of days delinquent at 388 (compared to 192 days in January 2008), and there were 2.210 million loans in the foreclosure process that had been on average delinquent for 631 days.
While there are no data that I know of that break out the number of seriously delinquent loans or loans in the foreclosure process backed by properties that are vacant (or rented out by owners not paying on the mortgage), at least one industry consultant who has looked at some (unfortunately confidential) data told me that the % of loans in the foreclosure process that are not occupied by the owner of the property is “shockingly” large.
CR Note: It would really be helpful to have an official count of foreclosures and short sales.
Earlier:
• Case Shiller: House Prices fall to new post-bubble lows in October (seasonally adjusted)
• Real House Prices and House Price-to-Rent
Treasury: China not a currency manipulator, however "movement of the RMB is insufficient"
by Calculated Risk on 12/27/2011 06:00:00 PM
From Reuters: U.S. says China is not a currency manipulator
[T]he Treasury, in a semi-annual report, said that statutes covering a designation of currency manipulator "have not been met with respect to China."Here is the report from Treasury: Report to Congress on International Economic and Exchange Rate Policies (includes a discussion of the global economy).
Even so, Treasury said appreciation in the yuan has been too slow. The value of the yuan, which Beijing manages closely, has risen by 4 percent against the dollar this year and 7.7 percent since China dropped a firm peg against the greenback in June 2010.
And from Treasury:
The Report highlights the need for greater exchange rate flexibility, most notably by China, but also in other major economies. Based on the ongoing appreciation of the RMB against the dollar since June 2010, the decline in China's current account surplus, and China's official commitments at the G-20, APEC, and the U.S.-China Strategic and Economic Dialogue (S&ED) that it will move more rapidly toward exchange rate flexibility, Treasury has concluded that the standards identified in Section 3004 of the Act during the period covered in this Report have not been met with respect to China. Nonetheless, the movement of the RMB to date is insufficient. Treasury will closely monitor the pace of RMB appreciation and press for policy changes that yield greater exchange rate flexibility, a level playing field, and a sustained shift to domestic demand-led growth.
DOT: Vehicle Miles Driven declined 2.3% in October
by Calculated Risk on 12/27/2011 02:55:00 PM
The Department of Transportation (DOT) reported:
• Travel on all roads and streets changed by -2.3% (-6.0 billion vehicle miles) for October 2011 as compared with October 2010.The following graph shows the rolling 12 month total vehicle miles driven.
• Travel for the month is estimated to be 254.0 billion vehicle miles.
• Cumulative Travel for 2011 changed by -1.4% (-36.0 billion vehicle miles).
 Click on graph for larger image.
In the early '80s, miles driven (rolling 12 months) stayed below the previous peak for 39 months.
Currently miles driven has been below the previous peak for 47 months - so this is a new record for longest period below the previous peak - and still counting! And not just moving sideways ... the rolling 12 months is declining.
The second graph shows the year-over-year change from the same month in the previous year.
 This is the eight straight month with a year-over-year decline in miles driven.
 This decline is probably due to high gasoline prices and the sluggish economy. Maybe habits are changing ...


