 RSS Feed
 by Calculated Risk on 7/31/2010 10:18:00 PM
Saturday, July 31, 2010
How do you put recession bars on graphs using Excel?
Something a little different for a Saturday evening. This is a common question, using excel, how do you get from this:
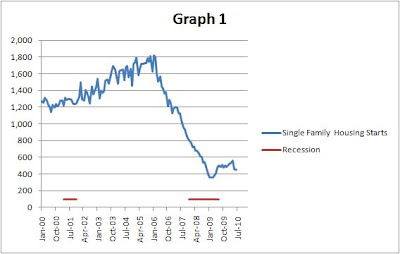
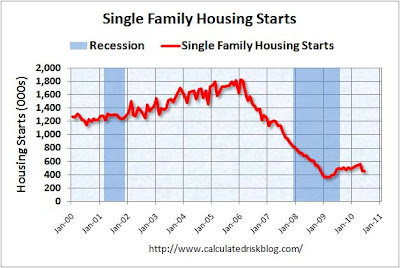
After the jump is a simple step-by-step example on one way to do it:
Growth of Problem Banks (Unofficial)
by Calculated Risk on 7/31/2010 05:19:00 PM
With the number of institutions on the unofficial problem bank list now over 800, here is a review of the growth of the unofficial list ...
We started posting the Unofficial Problem Bank list in early August 2009 (credit: surferdude808). The FDIC's official problem bank list is comprised of banks with a CAMELS rating of 4 or 5, and the list is not made public (just the number of banks and assets every quarter). Note: Bank CAMELS ratings are not made public.
CAMELS is the FDIC rating system, and stands for Capital adequacy, Asset quality, Management, Earnings, Liquidity and Sensitivity to market risk. The scale is from 1 to 5, with 1 being the strongest.
As a substitute for the CAMELS ratings, surferdude808 is using publicly announced formal enforcement actions, and also media reports and company announcements that suggest to us an enforcement action is likely, to compile a list of possible problem banks in the public interest. Some of this data is released with a lag, for example the FDIC announced the June enforcement actions yesterday. Click on graph for larger image in new window.
This graph shows the number of banks on the unofficial list. The number of institutions has more than doubled since early August 2009 - even with all the bank failures (failures are removed from the list). The number of assets is up 50 percent.
On August 7, 2009, we listed 389 institutions with $276 billion in assets, and now the list has 808 institutions and $415 billion in assets.
Note: For Q2 2009, the FDIC listed 416 institutions and $299.8 billion in assets (slightly more than the unofficial list a month later). The FDIC Q2 2010 Quarterly Banking Profile will be released in a few weeks.
The four red dots are the number of banks on the official problem bank list as announced in the FDIC quarterly banking profile for Q2 2009 through Q1 2010. The dots are lagged one month because of the delay in announcing formal actions.
The unofficial count is close, but is slightly lower than the official count - probably mostly due to timing issues.
Based on the current trend, there is still a reasonable chance that the unofficial problem bank list will be over 1,000 banks later this year ...
Negative Equity Breakdown
by Calculated Risk on 7/31/2010 11:40:00 AM
Here is some data from a recent congressional briefing by Mark Zandi, Chief Economist of Moody's Economy.com, and Yale Professor Robert Shiller. I believe all of this negative equity data was presented by Zandi.
A few key points, as of Q1 2010:
 Click on graph for larger image in new window.
This graph shows the percent of homeowners with negative equity (dashed line), percent of homeowners with mortgages with negative equity (blue), and the mortgage debt for homes with negative equity - all since Q1 2006.
The good news is the percent of homeowners with negative equity, and the mortgage debt for homes with negative equity, peaked in 2009.
The bad news is the declines have been relatively small even with all the distress sales, minor price increases, and some principal reduction modifications. As prices start to fall later this year (as I expect), the number of homeowners with negative equity will probably increase again (offset by foreclosures, short sales, and some modifications with principal reduction).
 The second graph shows the number of homeowners in negative equity, by the percent of negative equity.
There are 4.1 million homeowners with more than 50% negative equity, and another 5 million homeowners with 20% to 50% negative equity.
If prices fall 5%, the columns will essentially shift one to the left (ignoring remedies), and there will be 10.2 million homeowners with 20% or more negative equity.
 The third graph shows the percent of homeowners with mortgages in negative equity for 33 states and D.C.
This is shown in three categories: >50%, 20% to 50%, and 0 to 20%.
If you look at Nevada, 17.0% of homeowners (with mortgages) are more than 50% underwater, and another 35.2% are 20% to 50% underwater. These are the homeowners most at risk for foreclosure.
Note: the Q2 CoreLogic negative equity report will be released soon, but that report doesn't provide this level of detail.
Restaurant Index shows contraction in June
by Calculated Risk on 7/31/2010 08:56:00 AM
This is one of several industry specific indexes I track each month.  Click on graph for larger image in new window.
Same store sales and customer traffic both declined in June (on a year-over-year basis). This is the third consecutive month of declines.
Unfortunately the data for this index only goes back to 2002.
Note: Any reading above 100 shows expansion for this index.
From the National Restaurant Association (NRA): Industry Outlook Softened in June as the Restaurant Performance Index Declined for the Third Consecutive Month
As a result of a dampened outlook among restaurant operators, the National Restaurant Association's comprehensive index of restaurant activity declined for the third consecutive month in June. The Association's Restaurant Performance Index (RPI) - a monthly composite index that tracks the health of and outlook for the U.S. restaurant industry - stood at 99.5 in June, down 0.3 percent from May and the lowest index level since February.Restaurants are a discretionary expense, and this contraction could be because of the sluggish recovery or might suggest further weakness in consumer spending in the months ahead.
In addition, the RPI stood below 100 for the second consecutive month, which signifies contraction in the index of key industry indicators.
...
Restaurant operators reported a net decline in same-store sales for the third consecutive month in June, though the results were a modest improvement from the May performance.
...
Restaurant operators also reported a net decline in customer traffic levels in June.
...
Along with soft sales and traffic results, restaurant operators reported a dip in capital spending activity.
...
Restaurant operators are also not as optimistic about the direction of the overall economy. ... Restaurant operators’plans for capital expenditures fell to a six-month low this month.
emphasis added
Friday, July 30, 2010
Unofficial Problem Bank List over 800 Institutions
by Calculated Risk on 7/30/2010 11:59:00 PM
Note: this is an unofficial list of Problem Banks compiled only from public sources.
Here is the unofficial problem bank list for July 30, 2010.
Changes and comments from surferdude808:
FDIC actions this week led to many changes in the Unofficial Problem Bank List as they closed five institutions and finally released their enforcement actions for June 2010. The list total finally pushes through the much anticipated 800 level and finishes the week at 808 with aggregate assets of $414.8 billion.
Along with the five failures -- LibertyBank ($768 million), The Cowlitz Bank ($537 million Ticker: CWLZ), Coastal Community Bank ($378 million), Northwest Bank & Trust ($168 million), and Bayside Savings Bank ($66 million) -- there were four other removals because of action termination-- Domestic Bank ($234 million), Plaza Bank ($178 million Ticker: PLZB), Citizens State Bank ($114 million), and Libertad Bank SSB ($41 million); and three other removals because of unassisted mergers -- Pamrapo Savings Bank ($551 million), Sterling Bank ($369 million Ticker: STBK), and Colorado Mountain Bank ($82 million).
There are 28 additions this week with aggregate assets of nearly $9 billion. Most notable among the additions are Communityone Bank, National Association, Asheboro, NC ($2.0 billion Ticker: FNBN); The Palmetto Bank, Laurens, SC (1.3 billion Ticker: PLMT); Prosperity Bank, Saint Augustine, FL ($929 million); Jefferson Bank and Trust Company, Eureka, MO ($845 million); and Oxford Bank & Trust, Oak Brook, IL ($643 million). Geographically among the 28 additions are four based in Florida, three in Minnesota, and two in Illinois, Montana, and Wisconsin. The other change to report is a Prompt Corrective Action Order issued against Los Padres Bank ($902 million Ticker: HWFG) by the OTS.
Bank Failure #107 & 108: Washington and Oregon
by Calculated Risk on 7/30/2010 09:49:00 PM
Udderly Ridiculous!
Their milk shake was drank.
For whom the bell tolls?
Liberty pushed out to sea
Farewell to assets.
by Soylent Green is People
From the FDIC: Heritage Bank, Olympia, Washington, Assumes All of the Deposits of The Cowlitz Bank, Longview, Washington
As of March 31, 2010, The Cowlitz Bank had approximately $529.3 million in total assets and $513.9 million in total deposits. Heritage Bank paid the FDIC a premium of 1.0 percent for the deposits of The Cowlitz Bank. ...From the FDIC: Home Federal Bank, Nampa, Idaho, Assumes All of the Deposits of LibertyBank, Eugene, Oregon
The FDIC estimates that the cost to the Deposit Insurance Fund (DIF) will be $68.9 million. ... The Cowlitz Bank is the 107th FDIC-insured institution to fail in the nation this year, and the eighth in Washington. The last FDIC-insured institution closed in the state was Washington First International Bank, Seattle, on June 11, 2010.
As of March 31, 2010, LibertyBank had approximately $768.2 million in total assets and $718.5 million in total deposits. Home Federal Bank paid the FDIC a premium of 1.0 percent for the deposits of LibertyBank. ...That makes 5 today.
The FDIC estimates that the cost to the Deposit Insurance Fund (DIF) will be $115.3 million. .... LibertyBank is the 108th FDIC-insured institution to fail in the nation this year, and the third in Oregon. The last FDIC-insured institution closed in the state was Home Valley Bank, Cave Junction, on July 23, 2010.
Estimate of July Decennial Census impact on payroll employment: minus 144,000
by Calculated Risk on 7/30/2010 08:20:00 PM
The Census Bureau released the weekly payroll data for the week ending July 17th this week (ht Bob_in_MA). If we subtract the number of temporary 2010 Census workers in the week containing the 12th of the month, from the same week for the previous month - this provides a close estimate for the impact of the Census hiring on payroll employment.
The Census Bureau releases the actual number with the employment report.  Click on graph for larger image in new window.
This graph shows the number of Census workers paid each week. The red labels are the weeks of the BLS payroll survey.
The Census payroll decreased from 344,157 for the week ending June 12th to 200,346 for the week ending July 17th.
So my estimate for the impact of the Census on July payroll employment is minus 144 thousand (this will probably be close). The employment report will be released on August 6th, and the headline number for July - including Census numbers - will probably be negative again. But a key number will be the hiring ex-Census (so we will add back the Census workers again this month).
The following table compares the weekly payroll report estimate to the monthly BLS report on Census hiring (the weekly report is revised slightly, so the correlation looks better than in real time):
| Weekly Pay Period | Change (based on weekly report) | Monthly BLS | Change (monthly) | |
|---|---|---|---|---|
| Jan | 25 | 24 | ||
| Feb | 41 | 16 | 39 | 15 |
| Mar | 96 | 55 | 87 | 48 |
| Apr | 156 | 61 | 154 | 67 |
| May | 574 | 418 | 564 | 410 |
| Jun | 344 | -230 | 339 | -225 |
| Jul | 200 | -144 | ||
| All thousands | ||||
There will be one more large decline in temporary Census workers in August, and then most of the remaining workers will be let go over the next several months. I'll have more on July employment this Sunday in the weekly "Look ahead".
Bank Failures #105 & 106: Florida
by Calculated Risk on 7/30/2010 06:10:00 PM
Ghostly towers of failure
Like area banks
by Soylent Green is People
From the FDIC: Centennial Bank, Conway, Arkansas, Acquires All of the Deposits of Two Institutions in Florida
As of March 31, 2010, Bayside Savings Bank had total assets of $66.1 million and total deposits of $52.4 million. Coastal Community Bank had total assets of $372.9 million and total deposits of $363.2 million.Three down today.
...
The FDIC estimates that the cost to the Deposit Insurance Fund (DIF) will be $16.2 million for Bayside Savings Bank and $94.5 million for Coastal Community Bank. ... These two closings bring total closures for the year to 106 banks in the nation, and the 19th and 20th in Florida. Prior to these failures, the last bank closed in Florida was Sterling Bank, Lantana, on July 23, 2010.
Note: The FDIC released the June enforcement actions today, and the unofficial list will be over 800 tonight.
Bank Failure #104: NorthWest Bank and Trust, Acworth, Georgia
by Calculated Risk on 7/30/2010 05:30:00 PM
Bankers pray for sweet relief.
Survival in doubt
by Soylent Green is People
From the FDIC: State Bank and Trust Company, Macon, Georgia, Assumes All of the Deposits of NorthWest Bank and Trust, Acworth, Georgia
As of March 31, 2010, NorthWest Bank and Trust had approximately $167.7 million in total assets and $159.4 million in total deposits. ...It is Friday!
The FDIC estimates that the cost to the Deposit Insurance Fund (DIF) will be $39.8 million. ... NorthWest Bank and Trust is the 104th FDIC-insured institution to fail in the nation this year, and the 11th in Georgia. The last FDIC-insured institution closed in the state was Crescent Bank and Trust Company, Jasper, on July 23, 2010.
Existing Homes: Double Digit Months-of-Supply Watch
by Calculated Risk on 7/30/2010 03:44:00 PM
How the NAR calculates existing home inventory is a bit of a mystery. However housing economist Tom Lawler has been tracking inventory several different ways. For July, Lawler reports listings totaled 4,038,133, up about 1.6% from June (using Realtor.com). And this brings us to the double digit months-of-supply watch ...
For June, the NAR reported sales were at a 5.37 million seasonally adjusted annual rate (SAAR), and inventory was at 3.992 million.
To calculated the months of supply, divide 3.992 by 5.37 and multiply by 12 months.
This gives 8.92 months-of-supply (note: there is a seasonal pattern for inventory, but the NAR uses the NSA data). Click on graph for larger image in new window.
This graph shows the 'months-of-supply' metric.
The NAR reported that the months-of-supply increased to 8.9 months in June.
Since we know sales collapsed in July (based on pending home sales and other reports), and using Lawler's estimate for the level of inventory, we can calculate how far sales would have had to fall in July to hit double digits months-of-supply:
| For: Months of Supply | Then: July Sales (millions, SAAR) |
|---|---|
| 10 | 4.85 |
| 11 | 4.40 |
| 12 | 4.04 |
For 12 months of supply, the sales rate (SAAR) would equal inventory.
My initial guess is we will see double digit months-of-supply in July, and for a number of the months thereafter. We might even break the cycle high of 11.2 months set in 2008. If months-of-supply increases sharply as I expect, then there will be additional downward pressure on house prices.


