 RSS Feed
 by Calculated Risk on 3/25/2010 08:30:00 AM
Thursday, March 25, 2010
Weekly Initial Unemployment Claims Decrease
The DOL reports on weekly unemployment insurance claims:
In the week ending March 20, the advance figure for seasonally adjusted initial claims was 442,000, a decrease of 14,000 from the previous week's revised figure of 456,000. The 4-week moving average was 453,750, a decrease of 11,000 from the previous week's revised average of 464,750.
...
The advance number for seasonally adjusted insured unemployment during the week ending March 13 was 4,648,000, a decrease of 54,000 from the preceding week's revised level of 4,702,000.
 Click on graph for larger image in new window.
This graph shows the 4-week moving average of weekly claims since 1971.
The four-week average of weekly unemployment claims decreased this week by 11,000 to 453,750.
The dashed line on the graph is the current 4-week average. The current level of 442,000 (and 4-week average of 453,750) is still high, and suggests continuing weakness in the jobs market. Note: There is no way to compare directly between weekly claims, and net payrolls jobs.
Note: by request, next week I'll post a graph as a percent of covered employment.
Wednesday, March 24, 2010
China Official: "Will not adjust exchange rate"
by Calculated Risk on 3/24/2010 11:58:00 PM
From Sewell Chan at the NY Times: China Says It Will Not Adjust Policy on the Exchange Rate
After meeting with officials at the Treasury and Commerce Departments on Wednesday, China’s deputy commerce minister, Zhong Shan, told reporters, “The Chinese government will not succumb to foreign pressures to adjust our exchange rate."This is more posturing before the Treasury releases the worldwide currencies report on April 15th that might name China a "currency manipulator".
...
“It is wrong for the United States to jump to the conclusion that China is manipulating currency from the sheer fact that China is enjoying a trade surplus,” Mr. Zhong told reporters in a meeting at the Chinese Embassy. “Besides, it’s wrong for the United States to press for the appreciation of the renminbi and threaten to impose punitive tariffs on Chinese experts. This is unacceptable to China.”
Fed Vice Chairman Assigns Homework for Monetary Policymakers
by Calculated Risk on 3/24/2010 08:01:00 PM
From Fed Vice Chairman Donald Kohn: Homework Assignments for Monetary Policymakers
Kohn's assignments:
1) "One assignment is to evaluate the implications of the changing character of financial markets for the design of the liquidity tools the Federal Reserve has at its disposal when panic-driven runs on banks and other key financial intermediaries and markets threaten financial stability and the economy."
2) "In addition to providing liquidity on an unprecedented scale, we reduced our policy interest rate (the target for the rate on overnight loans between banks) effectively to zero, and then we continued to ease financial conditions and cushion the effect of the financial shock on the economy by making large-scale purchases of several types of securities. My second assignment involves improving our understanding of the effects of those purchases and the associated massive increase in bank reserves."
3) "Number three involves considering whether central banks should use their conventional monetary policy tool--adjusting the level of a short-term interest rate--to try to rein in asset prices that seem to be moving well away from sustainable values, in addition to seeking to achieve the macroeconomic objectives of full employment and price stability."
4) "The fourth and final assignment concerns whether central banks should adjust their inflation targets to reduce the odds of getting into a situation again where the policy interest rate reaches zero."
All four topics are interesting ... Kohn believes that the inflation target should be around 2%, and that the impact on rates from the MBS purchase program "comes mainly from the total amount we purchase relative to the total stock of debt outstanding", not the flow of purchases - suggesting little increase in mortgage rates when the Fed stops buying MBS in a week.
New Home Sales, Modifications, and Other News
by Calculated Risk on 3/24/2010 04:11:00 PM
1) New Home sales. New Home sales were at a record low in February. The weather might be partially to blame for the February record, but the reality is there are just too many existing home units available - so new home sales and single family housing starts will be under pressure for some time - and also housing related employment.
New home sales will probably get a boost in March and April from the homebuyer tax credit. To qualify, homebuyers must sign a contract by the end of April and close by the end of June. Since new home sales are counted when the contract is signed, any boost will happen in March or April. For existing home sales, the boost will come when the deal closes, so the boost to sales will come in May or June.
2) Modification Programs
The reason this program is so important though is because we know something is in the works over at Treasury to do something like it. We may even get news of that later this week, according to some of my sources.
3) And in other news today:
4) And on the Consumer financial protection agency from Jodi Kantor at the NY Times: Behind Consumer Agency Idea, a Fiery Advocate
Ask Elizabeth Warren, scourge of Wall Street bankers, how they treat consumers, and her no-nonsense bob will shake with indignation. She will talk about morality, about fairness, about what she calls their “let them eat cake” attitude towards taxpayers. If she is riled enough, she might even spit out the Warren version of an expletive.
“Dang gummit, somebody has got to stand up on behalf of middle-class families!” she exclaimed in a recent interview in her office here.
BofA's Principal Reduction Plan
by Calculated Risk on 3/24/2010 01:15:00 PM
Here is the BofA plan mentioned last night ... this is for specific loans only (Countrywide subprime, Option ARMs and a few others), and BofA estimates this will apply to about 45,000 borrowers for a total of about $3 billion in principal reduction.
From BofA: Bank of America Introduces Earned Principal Forgiveness Among Enhancements to Its National Homeownership Retention Program
Bank of America announced it will look first at principal forgiveness – ahead of an interest rate reduction – when modifying certain subprime, Pay-Option and prime two-year hybrid mortgages qualifying for its National Homeownership Retention Program (NHRP). Several enhancements are being made to the program, including the introduction of an earned principal forgiveness approach to modifying mortgages that are severely underwater.
...
Bank of America developed and launched the NHRP in 2008, in cooperation with state attorneys general, to provide assistance to Countrywide borrowers who financed their home with certain subprime and Pay-Option adjustable rate mortgages (ARMs). Bank of America removed these from the Countrywide product line upon acquiring Countrywide in July 2008.
These new components of the agreement apply to certain NHRP-eligible loans that also meet the basic qualifications for the government's Home Affordable Modification Program. They include:
• A first look at principal reductions in calculating an affordable payment through an earned principal forgiveness approach to severely underwater loans."The centerpiece of these enhancements is a program of earned principal forgiveness that addresses severely underwater mortgages with some of the highest rates of delinquency – specifically subprime loans, Pay-Option ARMs and prime two-year hybrid ARMs that are 60 days or more delinquent with a principal balance of 120 percent or more," said Barbara Desoer, president of Bank of America Home Loans.
• Principal forgiveness through a reduction of negative-amortization on certain Pay-Option ARMs.
• Conversion of certain Pay-Option ARMs to fully amortizing loans prior to a recast.
• Addition of certain prime two-year hybrid ARMs as eligible for the NHRP mortgage modification programs.
• Inclusion of Countrywide mortgages originated on or before January 1, 2009, as eligible for modifications under the terms of the NHRP.
• A six-month extension of the term of the NHRP program to December 31, 2012.
Home Sales: Distressing Gap
by Calculated Risk on 3/24/2010 12:38:00 PM
The following graph shows existing home sales (left axis) and new home sales (right axis) through February. I jokingly refer to this as the "distressing gap". Click on graph for larger image in new window.
The initial gap was caused by the flood of distressed sales. This kept existing home sales elevated, and depressed new home sales since builders couldn't compete with the low prices of all the foreclosed properties.
The spike in existing home sales last year was due primarily to the first time homebuyer tax credit.
Notice that there was also a bump last year in new home sales from the tax credit.
NOTE: New home sales and existing home sales are reported at different times: new home sales are reported when the contract is signed, and existing home sales are reported when the deal closes. So the bump in new home sales last year happened earlier than the spike in existing home sales.
The same thing will happen over the next few months. Any bump in new home sales from the tax credit will happen in March and April - when the contract is signed. Any bump in existing home sales will probably happen in May and June when escrow closes.
The second graph shows the same information as a ratio - new home sales divided by existing home sales - through February 2010. (In previous posts about this ratio, I graphed existing home sales divided by new home sales - this is the same ratio inverted). This ratio is near the all time low set last November. In November existing home sales were artificially boosted by the first time home buyer tax credit - but as mentioned above - the bump in new home sales had happened earlier.
Eventually this ratio will return to the historical range of new home sales being around 15% to 20% of existing home sales. However it will probably take a number of years to return to a more normal market.
New Home Sales at Record Low in February
by Calculated Risk on 3/24/2010 10:00:00 AM
The Census Bureau reports New Home Sales in February were at a seasonally adjusted annual rate (SAAR) of 308 thousand. This is a new record low and a decrease from the revised rate of 315 thousand in January (revised from 309 thousand). Click on graph for larger image in new window.
The first graph shows monthly new home sales (NSA - Not Seasonally Adjusted).
Note the Red columns for 2010. In February 2010, 24 thousand new homes were sold (NSA).
This is below the previous record low of 29 thousand hit three times; in February 2009, 1982 and 1970. The second graph shows New Home Sales vs. recessions for the last 45 years. New Home sales fell off a cliff, but after increasing slightly, are now 6% below the previous record low in January 2009.
Sales of new single-family houses in February 2010 were at a seasonally adjusted annual rate of 308,000, according to estimates released jointly today ... This is 2.2 percent (±15.3%)* below the revised January rate of 315,000 and is 13.0 percent (±12.2%) below the February 2009 estimate of 354,000.And another long term graph - this one for New Home Months of Supply.
 There were 9.2 months of supply in February. Rising, but still significantly below the all time record of 12.4 months of supply set in January 2009.
The seasonally adjusted estimate of new houses for sale at the end of February was 236,000. This represents a supply of 9.2 months at the current sales rate.
 The final graph shows new home inventory.
 Note that new home inventory does not include many condos (especially high rise condos), and areas with significant condo construction will have much higher inventory levels.
New home sales are far more important for the economy than existing home sales, and new home sales will remain under pressure until the overhang of excess housing inventory declines much further. Obviously this is another extremely weak report.
MBA: Mortgage Applications Decrease, Rates Rise
by Calculated Risk on 3/24/2010 08:52:00 AM
The MBA reports: Mortgage Refinance Applications Decrease in Latest MBA Weekly Survey
The Market Composite Index, a measure of mortgage loan application volume, decreased 4.2 percent on a seasonally adjusted basis from one week earlier. ...
The Refinance Index decreased 7.1 percent from the previous week and the seasonally adjusted Purchase Index increased 2.7 percent from one week earlier. ...
The refinance share of mortgage activity decreased to 65.0 percent of total applications from 67.3 percent the previous week. This is the lowest refinance share observed in the survey since the week ending October 30, 2009. ...
The average contract interest rate for 30-year fixed-rate mortgages increased to 5.01 percent from 4.91 percent, with points decreasing to 0.76 from 1.30 (including the origination fee) for 80 percent loan-to-value (LTV) ratio loans.
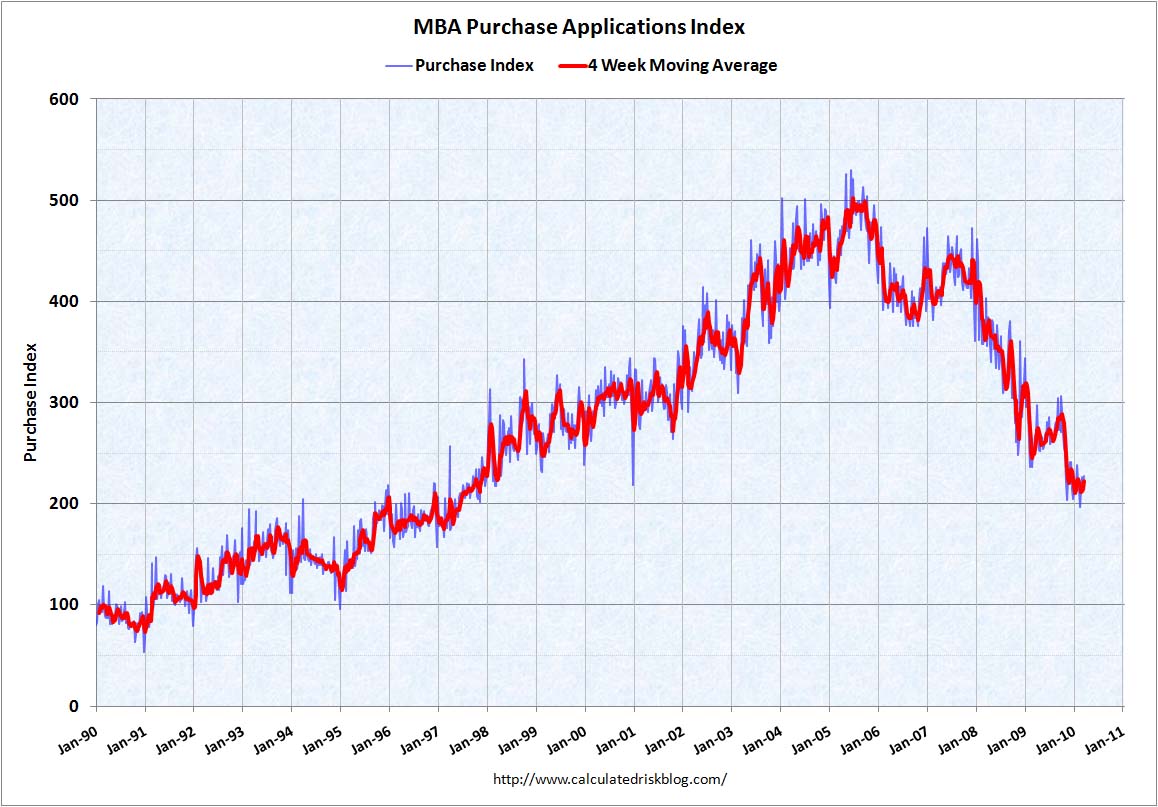 Click on graph for larger image in new window.
This graph shows the MBA Purchase Index and four week moving average since 1990.
There was a slight increase in purchase applications last week, but the 4-week average is still near the levels of 1997 - after falling sharply at the end of last year. This index shows no indication yet of the expected increase in home sales due to the expiration of the home buyer tax credit.
Report: BofA to Announce Mortgage Principal Reduction Plan
by Calculated Risk on 3/24/2010 05:35:00 AM
From Reuters: BofA to start reducing mortgage principal-sources
Bank of America will ... announce plans to start forgiving mortgage loan principal for troubled homeowners who owe more than 120 percent of their home's value or are battling ever-expanding "negative amortization" loans.Apparently under the plan, the mortgage debt will be reduced to 100% of the house's value over 5 years. The details should be released today by BofA.
According to a summary of the program obtained by Reuters, Bank of America pledged to offer an "earned principal forgiveness" of up to 30 percent in two stages. The lender will first offer an interest-free forbearance of principal that the homeowner can turn into forgiven principal annually over five years, provided they stay current on their payments.
Tuesday, March 23, 2010
AIA: Architecture Billings Index Shows Contraction in February
by Calculated Risk on 3/23/2010 11:59:00 PM
Note: This index is a leading indicator for Commercial Real Estate (CRE) investment. Any reading below 50 indicates contraction.
The WSJ reports that the American Institute of Architects’ Architecture Billings Index increased to 44.8 in February from 42.5 in January.
The ABI press release is not online yet. Click on graph for larger image in new window.
This graph shows the Architecture Billings Index since 1996. The index has remained below 50, indicating falling demand, since January 2008.
The second graph compares the Architecture Billings Index with the year-over-year change in non-residential structure investment.  Historically, according to the AIA, there is an "approximate nine to twelve month lag time between architecture billings and construction spending" on non-residential construction. This suggests further significant declines in CRE investment through all of 2010, and probably longer.
Note: Nonresidential construction includes commercial and industrial facilities like hotels and office buildings, as well as schools, hospitals and other institutions.


