by Calculated Risk on 2/15/2010 08:42:00 AM
Monday, February 15, 2010
NY Times: Worries Grow as Government Housing Support "Winds Down"
From David Streitfeld at the NY Times: U.S. Housing Aid Winds Down, and Cities Worry
Streitfeld discusses the Fed's MBS purchase program (95% complete and scheduled to end next month), the housing tax credit (contracts must be signed by the end of April, and deals closed by the end of June), and the slight tightening of FHA requirements.
Here is a list compiled in December of many Government housing support programs. Some have already ended (like the extension of the HAMP trial mods on Jan 31, 2010), and, as Streitfeld noted, others will end over the next few months.
One program that is being ramped up is Home Affordable Foreclosure Alternatives (HAFA: short sales and deed-in-lieu) that starts on April 5, 2010.
Retail Vacancy Rate: "Improvement by Subtraction"
by Calculated Risk on 2/15/2010 12:20:00 AM
Here is a solution for some of the vacant retail space ...
From the Columbus Dispatch: Razing cuts retail vacancy rate
Fewer storefronts were empty last year in Columbus than the year before, but only because two white-elephant malls were torn down ... The demolition of the Columbus City Center mall Downtown and Consumer Square East in the Brice Road area took 1.1 million square feet of empty retail space out of the market. That cut retail vacancies to 15.1 percent in 2009 from 16.9 percent in 2008.That helped a little, but the forecast is for the vacancy rate to stay in the 14% to 15% range through 2012. Maybe they can demolish a few more malls ...
Sunday, February 14, 2010
Five Million Workers to Exhaust Unemployment Benefits by June
by Calculated Risk on 2/14/2010 08:48:00 PM
Note: Scroll down or click here for a look ahead and weekly summary.
Back in December, the qualification dates for existing tiers of unemployment benefits were extended for an additional two months. Time is up at the end of February.
Now another extension is needed or millions of workers will lose benefits over the next few months.
The National Employment Law Project (NELP) released a new report last week showing that ...
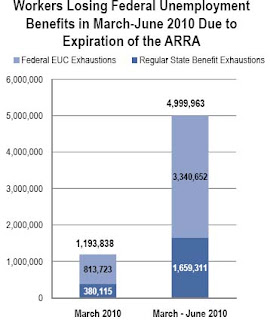
1.2 million jobless workers will become ineligible for federal unemployment benefits in March unless Congress extends the unemployment safety net programs from the American Recovery and Reinvestment Act (ARRA). By June, this number will swell to nearly 5 million unemployed workers nationally who will be left without any jobless benefits.
...
Currently, 5.6 million people are accessing one of the federal extensions (34-53 weeks of Emergency Unemployment Compensation; 13-20 weeks of Extended Benefits, a program normally funded 50 percent by the states).
 This table shows the NELP's projections:
 Of the almost 1.2 million workers facing a cut off of benefits in March alone:The following graph is based on the January employment report and shows the number of workers unemployed for 27 weeks or more ...380,000 workers will exhaust their 26 weeks of state benefits without accessing the temporary EUC extension program or the permanent federal program of Extended Benefits. Another 814,000 workers will not be eligible to continue receiving EUC past their current tier of benefits.
 Click on graph for larger image in new window.
The blue line is the number of workers unemployed for 27 weeks or more. The red line is the same data as a percent of the civilian workforce.
According to the BLS, there are a record 6.31 million workers who have been unemployed for more than 26 weeks (and still want a job). This is a record 4.1% of the civilian workforce. (note: records started in 1948).
The current qualification dates extension being considered is for another three months. Cynics might argue that some Senators want to limit the extension to an additional three months, so they can use the popular benefit extension in May to once again extend the homebuyer tax credit - hopefully the cynics are wrong!
Housing Market Index, Housing Starts and the Expiring Tax Credit
by Calculated Risk on 2/14/2010 04:43:00 PM
The NAHB Housing Market Index for February, and Housing Starts for January will both be released this week, see: Weekly Summary and a Look Ahead.
As a review, here is a graph showing the relationship between the two series: Click on graph for larger image in new window.
This graph compares the NAHB HMI (left scale) with single family housing starts (right scale). This includes the January release for the HMI and the December data for single family starts.
This shows that the HMI and single family starts mostly move in the same direction - although there is plenty of noise month-to-month. Since the NAHB index declined in January (it is released a month ahead of starts), we usually wouldn't expect much of an increase in January single family housing starts.
However there might be an increase in starts (single family) in January since many builders started a few extra homes in anticipation of the expiration of the first time home buyer tax credit. It takes about six months to build an average home, so the builders can't wait until the expected buying rush in April to start building a home - they have to close by the end of June.
Here are some comments from the Feb 2nd D.R. Horton conference call:
In [Q2 2010], we expect strong closings since homes must close by June 30th for the extended tax credit. ... We expect [Q3] will be the most challenging as the tax credit for home sales will have expired. As we move past the selling season, we'll be able to get a better read on core demand and we'll adjust our business accordingly.”Residential investment1 is one of the best leading indicators for the economy, and the best indicators for RI are the NAHB HMI, housing starts, and new home sales. Usually housing starts lead changes in unemployment too - see Housing Starts, Vacant Units and the Unemployment Rate - so the sideways movement in the NAHB HMI and housing starts suggest unemployment will stay elevated for some time.
...
We are prepared for the spring selling season and for current demand created by the Federal home buyer tax credit with our current spec level.
We will continue to manage our spec levels very closely as we move closer to the April 30th sales contract deadline for the home buyer tax credit.
Note 1: The largest components of residential investment are new home construction, and home improvement. This also includes brokers' commissions and some minor categories.
Weekly Summary and a Look Ahead
by Calculated Risk on 2/14/2010 12:11:00 PM
The U.S. markets will be closed on Monday for Presidents' Day, but there might be some more news from Europe and China.
On Tuesday, the Empire Manufacturing Survey (February) and the NAHB Housing Market Index survey (February) will be released. The consensus is for a slight uptick in builder confidence to 16 or 17 from 15 in January.
On Wednesday, the Census Bureau will release Housing Starts for January. The consensus is for an increase to close to 600,000 since many homebuilders started a few extra spec homes trying to beat the deadline for the homebuyer tax credit. As an example, here is a quote from Andrew Konovodoff, president of Town and Country Homes (from Daily Herald):
"Last year 50 percent of our buyers purchased homes using a tax credit and so far this year 35 percent of buyers have used one," Konovodoff said. "We are not a spec builder, but even we have started spec homes in anticipation of a rush this spring. Currently we have 30 homes that can close by the end of June."Also on Wednesday, the Fed will release the Industrial Production and Capacity Utilization numbers for January. The consensus is for a 0.8% increase. The FOMC minutes for the January meeting will also be released.
On Thursday the Producer Price Index, initial weekly Unemployment Claims, and the Philly Fed Survey will all be released.
And on Friday, the Consumer Price Index and more bank failures.
There will be several Fed speeches during the week, and the West Coast port data and the Department of Transportation vehicle miles driven for December will probably be released.
And a summary of last week ...
The Census Bureau reported that the U.S. trade deficit increased to $40.2 billion, up from $36.4 billion in November.
 Click on graph for larger image.
The first graph shows the monthly U.S. exports and imports in dollars through December 2009.
Both imports and exports increased in December. On a year-over-year basis, exports are up 7.4% and imports are up 4.6%. This is an easy comparison because of the collapse in trade at the end of 2008.
 The MBA reported that the "seasonally adjusted Purchase Index decreased 7.0 percent from one week earlier".
 This graph shows the MBA Purchase Index and four week moving average since 1990.
The decline in mortgage applications since October appears significant.
The BLS released the Job Openings and Labor Turnover Summary for December.
 This graph shows job openings (yellow line), hires (purple Line), Quits (light blue bars) and Layoff, Discharges and other (red bars) from the JOLTS. Red and light blue added together equals total separations.
According to the JOLTS report, there were 4.073 million hires in December, and 4.238 million separations, or 165 thousand net jobs lost. The comparable CES report showed a loss of 150 thousand jobs in December (after revisions).
Separations have declined sharply from earlier in 2009, but hiring has not picked up. Quits (light blue on graph) are at a new low too. Usually "quits" are employees who have already found a new job (as opposed to layoffs and other discharges).
The low turnover rate is another indicator of a very weak labor market.
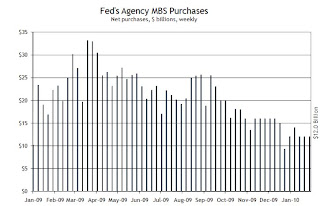
The following graph is from the Atlanta Fed Financial Highlights, and shows the Fed MBS purchases by week:
 From the Atlanta Fed:
 The Fed purchased an additional $11 billion net in MBS through the week of Feb 10th, bringing the total to $1.188 trillion or just over 95% complete.The Fed purchased a net total of $12 billion of agency-backed MBS through the week of February 3, bringing its total purchases up to $1.177 trillion, and by the end of the first quarter 2010 the Fed will have purchased $1.25 trillion (thus, it is 94% complete).
"Optimism has clearly stalled in spite of the improvements in the economy in the second half of 2009. Small business owners entered 2010 the same way they left 2009 – depressed. The quarterly Index readings have been below 90 for 7 quarters, indicative of the severity and pervasiveness of this recession."
Best wishes to all.


