by Calculated Risk on 10/26/2009 08:37:00 AM
Monday, October 26, 2009
ING to Raise $11.3 Billion, Lloyds to Raise $38 Billion
Two articles from the NY Times Dealbook:
ING to Split in Two Amid $11.3 Billion Rights Issue
ING Group, the Dutch financial services company, said Monday that it planned to break up its insurance and banking businesses and raise up to 7.5 billion euros, or $11.3 billion, in a stock issue, after reaching a deal with the government to repay ahead of schedule half the money it received in a bailout last year, The New York Times’s Chris V. Nicholson reported.Lloyds Said Set to Raise $38 Billion
ING was propped up with 10 billion euros in emergency funds from the Dutch government in October 2008, which helped cushion the company’s core Tier One capital, a measure of financial strength, during the global financial crisis.
Lloyds Banking Group plans to will announce within days a 23 billion pound ($38 billion) fundraising plan to shore up its balance sheet and avoid a U.K. government debt insurance program, The Times of London reported.Some pretty amazing numbers ... obviously some banks think now is the time to raise capital.
...
The fundraising comes as Lloyds seeks to escape taking part a costly government insurance scheme, that would give the British government a controlling 60 percent stake in the bank ...
Sunday, October 25, 2009
Capmark Files Bankruptcy
by Calculated Risk on 10/25/2009 07:39:00 PM
No surprise ...
Press Release: Capmark Financial Group Inc. Seeks To Restructure Balance Sheet Through Chapter 11 Reorganization Process
Capmark Financial Group Inc. ("Capmark") today announced that Capmark and certain of its subsidiaries have filed voluntary petitions for relief under Chapter 11 of the U.S. Bankruptcy Code in the U.S. Bankruptcy Court for the District of Delaware. Capmark intends to use the reorganization process to implement a restructuring that reduces its corporate debt and maximizes value for its stakeholders. Capmark`s businesses are continuing to operate in the ordinary course.More from Bloomberg: Lender Capmark Financial Group Files for Bankruptcy
Capmark Bank, which recently received $600 million of new equity from Capmark, is not part of the filing.
Summary and more ...
by Calculated Risk on 10/25/2009 02:49:00 PM
It will be a busy week ... a few coming highlights:
A few articles and graphs from last week:
 Click on graph for larger image in new window.
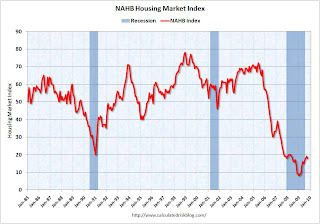
This graph shows the builder confidence index from the National Association of Home Builders (NAHB).
The housing market index (HMI) decreased to 18 in October from 19 in September. The record low was 8 set in January. Note that Traffic of Prospective Buyers declined sharply.
This is still very low - and this is what I've expected - a long period of builder depression.
From NAHB: Builder Confidence Decreases Slightly in October
 This graph shows a comparison of the Moodys/REAL Commercial Property Price Index (CPPI) and the Case-Shiller composite 20 index. CRE prices only go back to December 2000.
The Case-Shiller Composite 20 residential index is in blue (with Dec 2000 set to 1.0 to line up the indexes).
This shows residential leading CRE (although we usually talk about residential investment leading CRE investment, but in this case also for prices), and this also shows that prices tend to fall faster for CRE than for residential.
From Bloomberg: U.S. Commercial Property Values Fall 3% in August
The Moody’s/REAL Commercial Property Price Indices fell 3 percent in August from July, bringing the market’s decline to almost 41 percent since its peak in October 2007, Moody’s Investors Service said in a statement today.From Moody’s: CRE Prices Off 41 Percent from Peak, Off 3% in August
 Total housing starts were at 590 thousand (SAAR) in September, up 0.5% from the revised August rate, and up sharply from the all time record low in April of 479 thousand (the lowest level since the Census Bureau began tracking housing starts in 1959). Starts had rebounded to 590 thousand in June, and have move sideways for four months.
Single-family starts were at 501 thousand (SAAR) in September, up 3.9% from the revised August rate, and 40 percent above the record low in January and February (357 thousand). Just like for total starts, single-family starts have been at this level for four months.
From Housing Starts in September: Moving Sideways
 This graph shows the Architecture Billings Index since 1996. The index has remained below 50, indicating falling demand, since January 2008.
Note: Nonresidential construction includes commercial and industrial facilities like hotels and office buildings, as well as schools, hospitals and other institutions.
Historically there is an "approximate nine to twelve month lag time between architecture billings and construction spending" on commercial real estate (CRE). This suggests further dramatic declines in CRE investment through most of 2010, if not longer.
From AIA: Architectural Billings Index Shows Contraction
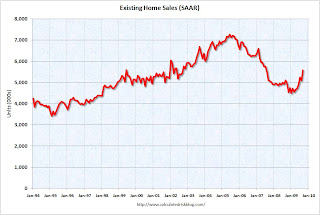
 This graph shows existing home sales, on a Seasonally Adjusted Annual Rate (SAAR) basis since 1993.
Sales in Sept 2009 (5.57 million SAAR) were 9.4% higher than last month, and were 9.2% higher than Sept 2008 (5.1 million SAAR).
From Existing Home Sales Increase in September
From Philly Fed State Coincident Indicators Show Widespread Weakness in September
More on the "Job Loss" Recovery
by Calculated Risk on 10/25/2009 11:29:00 AM
From Carolyn Lochhead at the San Francisco Chronicle: Experts see rebounding economy shedding jobs
Forget a jobless recovery. The economy may be entering a recovery with job losses.As I noted earlier this week, so far the current recovery is even worse than "jobless"; it is a "job-loss" recovery.
...
"It's not even a jobless recovery; it's a recovery with more job losses," said UCLA economist Lee Ohanian. "The idea of having essentially no net job creation after a remarkably severe recession is a real pathology for the U.S. economy."
...
Alarms are ringing at the White House and in Congress. But with a mind-boggling $1.4 trillion deficit this year, Democrats have used up their bullets. The word stimulus has such a bad connotation that the term has been banished from new efforts to goose the economy and help workers, such as extending unemployment benefits, sending $250 checks to seniors and a program the White House announced to help small businesses get loans.
This will be hot topic over next couple of months. Maybe the forecasts will be too pessimistic, but without jobs, it isn't much of a recovery.
Seattle Times: "Reckless strategies doomed WaMu"
by Calculated Risk on 10/25/2009 08:33:00 AM
From Drew DeSilver at the Seattle Times: Reckless strategies doomed WaMu
This is the first of two parts. Here is a section on loose lending:
"The big saying was 'A skinny file is a good file,' " said Nancy Erken, a WaMu loan consultant in Seattle. She recalled helping credit-challenged borrowers collect canceled checks, explanatory letters and other documentation that they could afford their loans.And on risk management:
"I'd take the files over to the processing center in Bellevue and they'd tell me 'Nancy, why do you have all this stuff in here? We're just going to take this stuff and throw it out,' " she said.
In time, WaMu even began allowing low- or no-documentation option ARMs, piling risk on risk. The loose standards spread through the company like a flu virus.
In an internal newsletter dated Oct. 31, 2005, and obtained by The Seattle Times, risk managers were told they needed to "shift (their) ways of thinking" away from acting as a "regulatory burden" on the company's lending operations and toward being a "customer service" that supported WaMu's five-year growth plan.Ouch. There is much more in the article - on Option ARMs, switching to originate-to-sell and more ... WaMu was definitely "doomed".
Risk managers were to rely less on examining borrowers' documentation individually and more on automated processes, Melissa Martinez, WaMu's chief compliance and risk oversight officer, wrote in the memo.
...
"The whole tone it set was that 'Maybe the next file I review I should pull back, hold off on downgrading (a loan), not take a sharp pencil to what production was doing,' " [Dale George, a former senior credit-risk officer in Irvine, Calif.] said.
"They weren't going to have risk management get in the way of what they wanted to do, which was basically lend the customers more money."
Saturday, October 24, 2009
Hutton: "Mervyn King is right"
by Calculated Risk on 10/24/2009 11:55:00 PM
From Will Hutton at the Observer: Mervyn King is right – the time has come to break up the megabanks (ht Jonathan)
Will Hutton reviews the competing proposals to reform the banking system and suggests a combination of the two ...
The first proposal, championed by BofE Governor Mervyn King and former Fed Chairman Paul Volcker is to break up the banks and separate the commercial parts from the "casino banking":
If the status quo is untenable and unfair because it leaves us with banks so big they have to be bailed out in a crisis, and if the proposed increases in bank capital advanced by the government are unlikely to act as a restraint, then there is only one course of action left: we have to break up the megabanks. The speculative, risky parts of banks must be separated from the commercial parts which lend to business, consumers and home buyers.The second proposal, championed by Lord Turner in the U.K., and I believe favored by the Obama Administration in the U.S., is to have capital requirements based on the riskiness of the business:
This, after all, is what the Americans did after the 1929-33 crash. Under the famous Glass-Steagall Act, commercial banks were forbidden to offer any form of collateral, underwriting or loan that financed stocks and shares. The same could be done today. The banking the economy needs – so-called narrow banking – could be closely regulated and casino banking could be left to its separate, freewheeling devices.
The way forward, [Lord Turner] repeated, is more capital, especially more capital for the casino parts of any bank's business. On top, banks should make "living wills", setting out how they would wind themselves up without any cost to the taxpayer.Either way - I think the time has for action.
Silicon Valley Office Vacancy Rate over 19 Percent
by Calculated Risk on 10/24/2009 08:23:00 PM
From the Mercury News: Silicon Valley office vacancies near 20 percent
Nearly one-fifth of Silicon Valley office space stood empty last quarter, while landlords lowered rents to try to retain tenants and attract new ones, according to a [report from commercial real estate firm Grubb & Ellis] released Friday.Some of the increase in the vacancy rate was because of new office space coming online, but it sounds like Grubb & Ellis expects a significant amount of sublease space to come on the market too. That is usually a bad sign for rents - and also suggests companies don't expect much growth.
...
The rising vacancy rate is "re-emphasizing that this is the slowest commercial real estate market the valley has seen since the dot-com bust in 2001," the report stated.
Empty space for research and development, the one- to three-story buildings where so many smaller tech companies reside, is also beginning to pile up, said Dick Scott, Grubb & Ellis' managing director in Silicon Valley. ...
"There was a temporary period of time where we all were naively optimistic that R&D would hold up. But it's taking a hit now," he said.
...
Said the Grubb & Ellis report: "Expect asking rents to decrease as companies put unoccupied space onto the market."
Report: Capmark May File Bankruptcy this Weekend
by Calculated Risk on 10/24/2009 02:41:00 PM
This has been coming for some time ...
From the NY Times Dealbook: Capmark, Big Commercial Lender, May File for Bankruptcy
The Capmark Financial Group, the big commercial real estate finance company cobbled together from pieces of GMAC, may file for bankruptcy as soon as this weekend ... The company is only the latest to fall victim to continued trouble in the commercial real estate market ... Capmark has about $10 billion in assets, with another $10 billion in a Utah bank the company owns that would not be subject to a bankruptcy filing.Capmark bank in Utah is in trouble too, and is the fifth largest bank (in assets) on the unofficial problem bank list.
From a Capmark press release in September:
The FDIC has notified Capmark Bank that it intends to issue an administrative order, which will impose certain requirements and restrictions on Capmark Bank, including requiring submission of capital and liquidity plans, restrictions on affiliated party transactions and other activities.
Goldman: Government Policies Boosted House Prices 5%
by Calculated Risk on 10/24/2009 11:45:00 AM
From James Hagerty at the WSJ: Uncle Sam Adds 5% to Prices of Homes, Goldman Says
Uncle Sam’s interventions in the housing market have pushed home prices 5% higher on a national average than they would have been otherwise, Goldman Sachs estimates in a report released late Friday.In the research note, Phillips discussed how policies have reduced foreclosures, and stimulated demand with both the first-time home buyer tax credit and "abnormally low mortgage rates". Phillips wrote (no link):
...
But these artificial props won’t last forever and may have created a false bottom in the market. “The risk of renewed home-price declines remains significant,” Goldman economist Alec Phillips writes in the report, “and our working assumption is a further 5% to 10% decline by mid-2010.”
"In 2010, we expect some of these supports to fade. Fed and Treasury purchases of mortgage-backed securities will taper off, and the pause in foreclosures created by federal mortgage modification programs may end.Based on Goldman's estimates, the first-time home buyer tax credit probably cost around $80,000 per additional home sold. Ouch.
The federal tax credit for first-time homebuyers appears likely to be extended for at least a few months, but probably no longer than through the first half of 2010."
The report isn't all negative. Goldman believes "the brunt of the price decline is behind us" and the outlook is uncertain: "the cloudy policy outlook adds to our already considerable uncertainty of where house prices will ultimately bottom".
This is very close to my view, see: The Uncertain Housing Outlook
FDIC Bank Failure Update
by Calculated Risk on 10/24/2009 08:29:00 AM
The FDIC closed seven more banks on Friday, and that brings the total FDIC bank failures to 106 in 2009. The following graph shows bank failures by week in 2009. Click on graph for larger image in new window.
Note: Week 1 on graph ends Jan 9th.
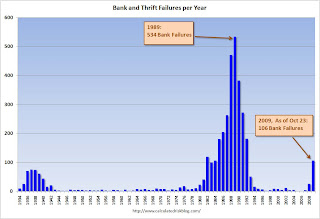
After a busy summer, the FDIC slowed down in late September and early October with only five bank failures in four weeks. Perhaps the pace is about to pick up again. With 10 weeks to go, it seems 130 or so bank failures is likely this year.  The 2nd graph covers the entire FDIC period (annually since 1934).
This is the most failures per year since 1992 (181 failures).
As far as failures per week - there were 28 weeks during the S&L crisis when regulators closed 10 or more banks, and the peak was April 20, 1989 with 60 bank closures (there were 7 separate weeks with more than 30 closures in the late '80s and early '90s).
For a graph that includes the 1920s and early '30s (before the FDIC was enacted) see the 3rd graph here.
Of course the number of banks isn't the only measure. Many banks today have more branches, and far more assets and deposits. Also the cumulative estimated losses for the DIF, since early 2007, is now about $45 billion.
And a message from Sheila Bair:
The FDIC era source data is here - including by assets (in most cases) - under Failures and Assistance Transactions
The pre-FDIC data is here.


