by Calculated Risk on 10/04/2009 07:41:00 AM
Sunday, October 04, 2009
Weekly Summary
Consumer spending was up in August because of Cash-for-Clunkers, but auto sales were down sharply in September.
 Click on graph for larger image in new window.
This graph shows the historical light vehicle sales (seasonally adjusted annual rate) from the BEA (blue) and an estimate for September (red, light vehicle sales of 9.22 million SAAR from AutoData Corp).
This is the third lowest vehicle sales this year.
Industrial indicators stalled:
Housing: House Prices increased, meanwhile delinquencies and foreclosure are rising.
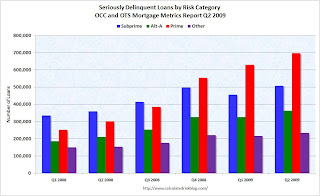
 This data is from the Office of the Comptroller of the Currency and the Office of Thrift Supervision: OCC and OTS Release Mortgage Metrics Report for Second Quarter 2009
 Seriously delinquent loans continue to rise rapidly, especially for prime loans.
About 25% to 30% of modifications fail in the first three months. For Q1 and Q2 2008, about 55% of borrowers have re-defaulted. Q3 2008 will probably be worse, and Q4 2008 and Q1 2009 about the same.
The Labor Market was very weak.
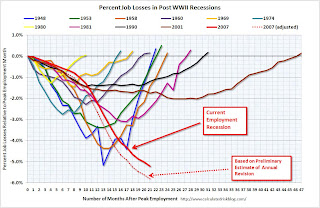
 The graph compares the job losses from the start of the employment recession in percentage terms (as opposed to the number of jobs lost).
The dashed line is an estimate of the impact of the large benchmark revision (824 thousand more jobs lost).
Instead of 7.2 million net jobs lost since December 2007, the preliminary benchmark estimate suggests the U.S. has lost over 8.0 million net jobs during that period.
Saturday, October 03, 2009
On Extending the Safety Net
by Calculated Risk on 10/03/2009 08:00:00 PM
Proposals:
If this is just a safety net extension, then the "first-time" homebuyer tax credit doesn't qualify. And if this is the "Next Stimulus Package", providing more aid to the unemployed (13 weeks won't last long), or aid to the states, would be a far more effective use of money than the homebuyer tax credit ...
A couple of stories, first from the WSJ: Democrats Weigh Extending Key Parts of Stimulus
Obama administration economists said they would like the enhanced unemployment-insurance program to extend beyond its Dec. 31 expiration date. They also want to maintain a program that offers tax credits to pay 65% of the cost of health insurance policies under the COBRA program, which allows laid-off workers to purchase the health plans they had through their previous employer.From the NY Times: After More Job Losses, Democrats Move to Extend Benefits
White House officials said they also are examining whether to extend a soon-to-expire tax credit for first-time homebuyers, but that provision faces a stiffer headwind.
The House on Friday approved legislation that would provide 13 more weeks of benefits to states with unemployment rates of 8.5 percent or higher. Democratic leaders in the Senate are pushing a measure that would also provide aid to states that do not meet the threshold.
Senator Harry Reid of Nevada, the majority leader, is promoting legislation that would provide four more weeks of unemployment coverage to all states, while states over the 8.5 percent threshold would get 12 more weeks.
Lawrence H. Summers, director of the National Economic Council, said in an interview with The Atlantic online that the administration should “continue to support people who are in need, whether it’s unemployment insurance, or the Cobra program,” which provides health insurance for the unemployed.
The Impact of the Declining Homeownership Rate
by Calculated Risk on 10/03/2009 05:00:00 PM
This is an update to a 2007 post: Home Builders and Homeownership Rates1
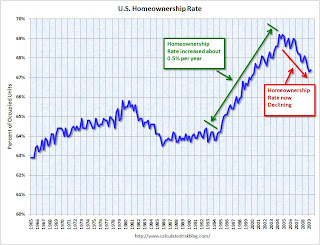
From 1995 to 2005, the U.S. homeownership rate climbed from 64% to 69%, or about 0.5% per year. Click on graph for larger image in new window.
The first graph shows the homeownership rate since 1965. Note the scale starts at 60% to better show the recent change.
The reasons for the change in homeownership rate are discussed in the 2007 post ( a combination of demographics and changes in mortgage "innovation"), but here are two key points: 1) During the boom, the change in the homeownership rate added about half a million new homeowners per year, as compared to a steady homeownership rate, 2) the homeownership rate (red arrow is trend) is now declining.
The U.S. population has been growing at close to 3 million people per year on average, and there are about 2.4 people per household. Assuming no change in these rates, there would be close to 1.25 million new households formed per year in the U.S. (The are just estimates, and fewer households are formed during a recession - a key problem right now).
Since about 2/3s of all households are owner occupied, an increase of 1.25 million households per year would imply an increase in homes owned of about 800K+ per year. If an additional 500K per year moved to homeownership - as indicated by the increase in the homeownership rate from 1995 to 2005 - then the U.S. would have needed 1.3 million additional owner occupied homes per year.
Important note: these number can't be compared directly to the Census Bureau housing starts and new home sales. There are many other factors that must be accounted for to compare the numbers.
During that same period, since about 1/3 of all households rent, the U.S. would have needed about 400K+ new rental units per year, minus the 500K per year of renters moving to homeownership. So the U.S. needed fewer rental units per year from 1995 to 2005. The second graph shows the number of occupied (blue) and vacant (red) rental units in the U.S. (all data from the Census Bureau).
Sure enough, the number of rental units in the U.S. peaked in early 1995 and declined slowly until 2005. The builders didn't stop building apartment units in 1995, instead the decline in the total units came from condo conversions and units being demolished (a fairly large number of rental and owner owned units are demolished every year).
Even though the total number of rental units was declining, this didn't completely offset the number of renters moving to homeownership, so the rental vacancy rate started moving up - from about 8% in 1995 to over 10% in 2004.
Since 2004 there has been a surge in rental units. Most of this increase is not new apartment buildings, rather a combination of investors buying REOs for cash flow, condo "reconversions", builders changing the intent of new construction (started as condos but became rentals), flippers becoming landlords, or homeowners renting their previous homes or 2nd homes instead of selling. This increase in rental units is more than offsetting the decline in the homeowership rate, and the rental vacancy rate was at a record 10.6% in Q2. (and will probably be over 11% soon because of the "first-time" homebuyer tax credit).
This increase in the homeownership rate, from 1995 through 2005, meant the homebuilders had the wind to their backs. Instead of 800K of new owner demand per year (plus replacement of demolished units, and second home buying), the homebuilders saw an additional 500K of new owner demand during the period 1995 to 2005. This doesn't include the extra demand from speculative buying. Some of this demand was satisfied by condo conversions and owner built units, but the builders definitely benefited from the increase in homeownership rate.
Looking ahead, if the homeownership rate stays steady, the demand for net additional homeowner occupied units would fall back to 800K or so per year (assuming steady population growth and persons per household). However the homeownership rate is declining, and this is now a headwind for the builders.
It appears the rate is declining at about 0.5% per year. This means the net demand for owner occupied units would be 833K minus about 500K per year or about 333K per year - about 25% of the net demand for owner occupied units for the period 1995 to 2005. (Not including replacing demolished units and 2nd home buying).
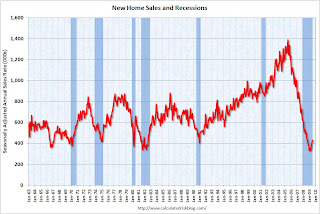
Although we can't compare this number directly to new home sales (because of 2nd home buying, replacement of demolished units, and other factors) this does suggest new home sales will probably remain at a low level until the homeownership rate stops declining. The third graph shows New Home Sales for the last 45 years. the Census Bureau reported: "Sales of new one-family houses in August 2009 were at a seasonally adjusted annual rate of 429,000."
Once the homeownership rate stops declining - probably at about the same time the excess existing home units are mostly absorbed - new home sales will probably increase to a steady state rate based on population growth. However this level will be substantially below the average for the period from 1995 to 2005 when the homebuilders benefited from the increasing homeownership rate.
The "first-time" homebuyer tax credit (and new homebuyer tax credit in California) probably boosted new home sales a little this year, so the homeownership rate might increase in the 2nd half of 2009. However that increase will probably be temporary, and the homeownership rate will probably start declining again.
Key points:
1 A special thanks to Jan Hatzius. Several of the ideas for this post are from his piece: "Housing (Still) Holds the Key to Fed Policy", Nov 27, 2007
NY Times: Retailers Expect No Growth in Holiday Spending
by Calculated Risk on 10/03/2009 01:43:00 PM
From the NY Times: Retailers Expect Flat Christmas Sales This Year
[A] lot of people are thinking about it, and taking surveys to test the mood of the American consumer, and deciding that this Christmas will be as bad as last — which is to say, one of the worst on record.And that suggests that seasonal retail hiring will be weak too. Here is a repeat of a graph from a post a couple weeks ago: Seasonal Retail Hiring
Retailers are relieved to hear that prediction. Flat sales this holiday season would at least mean that things had stopped getting worse ... several reports published in the last few days, including surveys by Nielsen and Deloitte, forecast no change in holiday sales from last year to this year.
Typically retail companies start hiring for the holiday season in October, and really increase hiring in November. This graph shows the historical net retail jobs added for October, November and December by year.
 Click on graph for larger image in new window.
This really shows the collapse in retail hiring in 2008. This also shows how the season has changed over time - back in the '80s, retailers hired mostly in December. Now the peak month is November, and many retailers start hiring seasonal workers in October.
Given the expectation of no growth in holiday spending, retailers will probably be very cautious hiring again this year.
Comparing Employment Recessions including Revision
by Calculated Risk on 10/03/2009 08:56:00 AM
Here is a graph with an estimate of the impact of the preliminary estimate of the annual benchmark revision. (ht John) Click on graph for larger image.
The dashed line is an estimate of the impact of the large benchmark revision (824 thousand more jobs lost).
The graph compares the job losses from the start of the employment recession in percentage terms (as opposed to the number of jobs lost).
Instead of 7.2 million net jobs lost since December 2007, the preliminary benchmark estimate suggests the U.S. has lost over 8.0 million net jobs during that period.
Even before the annual revision, the current employment recession was already the worst recession since WWII in terms of percent of job losses. The benchmark revision shows this recession was even deeper. The revision will be reported in February ... just something to remember over the next few months.


