by Calculated Risk on 10/04/2009 07:41:00 AM
Sunday, October 04, 2009
Weekly Summary
Consumer spending was up in August because of Cash-for-Clunkers, but auto sales were down sharply in September.
 Click on graph for larger image in new window.
This graph shows the historical light vehicle sales (seasonally adjusted annual rate) from the BEA (blue) and an estimate for September (red, light vehicle sales of 9.22 million SAAR from AutoData Corp).
This is the third lowest vehicle sales this year.
Industrial indicators stalled:
Housing: House Prices increased, meanwhile delinquencies and foreclosure are rising.
 This data is from the Office of the Comptroller of the Currency and the Office of Thrift Supervision: OCC and OTS Release Mortgage Metrics Report for Second Quarter 2009
 Seriously delinquent loans continue to rise rapidly, especially for prime loans.
About 25% to 30% of modifications fail in the first three months. For Q1 and Q2 2008, about 55% of borrowers have re-defaulted. Q3 2008 will probably be worse, and Q4 2008 and Q1 2009 about the same.
The Labor Market was very weak.
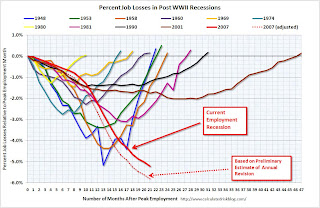
 The graph compares the job losses from the start of the employment recession in percentage terms (as opposed to the number of jobs lost).
The dashed line is an estimate of the impact of the large benchmark revision (824 thousand more jobs lost).
Instead of 7.2 million net jobs lost since December 2007, the preliminary benchmark estimate suggests the U.S. has lost over 8.0 million net jobs during that period.


