 RSS Feed
 by Calculated Risk on 12/11/2006 06:35:00 PM
Monday, December 11, 2006
Office of Thrift Supervision: The National Housing Forum
The Office of Thrift Supervision hosted a National Housing Forum today. An archived recording will be available soon.
The forum included four panels:
Panel 1: Outlook for the U.S. Housing Market and Potential Impact on Banks and Thrifts
Panel 2: Challenges & Emerging Risks in the Home Mortgage Business
Panel 3: Critical Consumer Protection Issues in Housing Finance Today
Panel 4: Mortgage Fraud
Here are some excerpts from an AP article: Mortgage delinquencies a rising threat
Mortgage delinquency and foreclosure rates are on the rise, and the impact could be greatest on low-income families that took out higher-interest loans for risky borrowers, some experts said Monday.
...
Some experts are concerned that the increase in mortgage foreclosure rates could affect the banking system's financial health.
There have started to be "early signs of credit distress" in financial institutions' holdings of so-called "subprime" mortgages, especially in California, Richard Brown, chief economist for the Federal Deposit Insurance Corp., said at the conference.
...
William Longbrake, a senior policy adviser to the Financial Services Roundtable, an industry group, said he is among a minority of experts "who believe the worst is still ahead in the housing market" for home prices to continue to fall.
"There is worse to come. ... The bottom is probably still many months ahead," Longbrake said. He noted that the rise in delinquencies and foreclosures in subprime mortgages particularly affects low-income families.
Mortgage defaults could snowball in the coming months, a situation that bears close watching, he said.
LA Times: A loan that'll get ugly fast
by Calculated Risk on 12/11/2006 10:55:00 AM
From David Streitfeld, Times Staff Writer: A loan that'll get ugly fast
EVERY day, Will Hertzberg owns a little less of his three-bedroom house in Corona.And here are his payment options:
Like hundreds of thousands of other homeowners around the state, Hertzberg has a mortgage that lets him choose how much he pays each month.
Like many of them, he always chooses to pay as little as possible.
For the moment, this allows the 56-year-old Hertzberg to continue living in his tract home despite being only marginally employed. But his debt is swelling, and his mortgage company controls his fate.
"I am rather screwed," he said.
One of his options is to pay $2,513 a month. That would cover the principal and interest as if it were a traditional 30-year loan.Hertzberg is not alone. The use of option ARMs have really taken off, especially in California:
A second possibility is to pay $2,279, which would cover only the interest.
But each month he always takes the cheapest option: paying $1,106 and promising to make up the shortfall later.
In 2003, only about 8 of every 1,000 people buying a home or refinancing a mortgage in California got a pay option loan ...But the impact is a still a "big unknown":
Last year, 1 in 5 loan applicants got one.
In the first eight months of 2006... Nearly 1 in 3 California loan applicants are now choosing them.
Just how many of these homeowners will end up in trouble is the big unknown for the housing market and the economy. Although many economists expect the loans to prompt a certain degree of turmoil, they don't think it would cause a recession.UPDATE: And from Reuters: U.S. home lenders brace for bad news, legislation
During the recent U.S. housing boom, mortgage lenders touted so-called exotic mortgages that allowed people to buy houses they could not otherwise afford. Now those lenders are bracing for the not-so-happy story of borrowers...
...
A mortgage survey due on Wednesday is expected to show that more and more Americans are in danger of losing their homes. The quarterly report from the Mortgage Bankers Association is also expected to show that the same mortgage products that helped send the housing market into the stratosphere are now weighing homeowners down.
In a hint at Wednesday's data, October saw more foreclosure actions than any other month this year ...
Saturday, December 09, 2006
Northern Trust Economic Outlook
by Calculated Risk on 12/09/2006 07:25:00 PM
Congratulations to Paul Kasriel, the recipient of the 2006 Lawrence R. Klein Award for Blue Chip Forecasting Accuracy:
"Kasriel [was] honored for having the most accurate economic forecast among the Blue Chip survey participants for the years 2002 through 2005."From the Northern Trust December Economic Outlook:
We continue to expect sub-2% annualized real GDP growth in the final quarter of this year and have revised down our first-quarter 2007 forecast to 1.8% from 2.0% -- not much more than a rounding error. In addition to the fifth consecutive quarterly decline in real residential investment expenditures, we expect a considerable deceleration in the growth of real business expenditures for capital equipment and software in the fourth quarter, based on the weak October shipments data for nondefense capital goods excluding aircraft. ...
Based on the excesses of the past real estate boom, the considerable supply overhang and the typical peak-to-trough behavior of residential investment expenditures, we continue to expect that the trough of the housing recession is not near at hand....
 Click on graph for larger image.
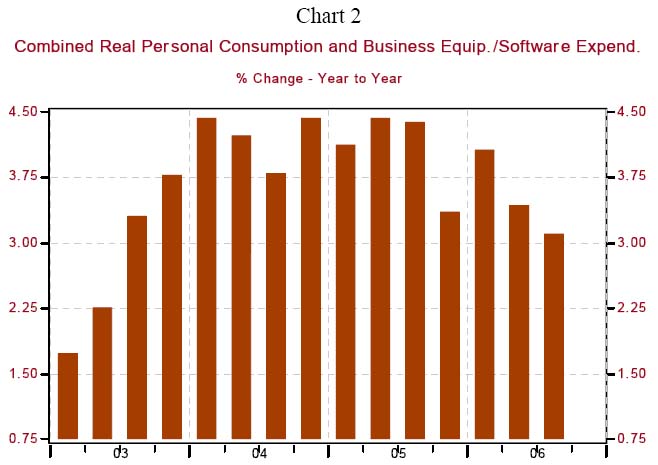
We continue to hear that the weakness in housing has not spread to other parts of the economy. To that we say “Not so” and “You ain’t seen nothin’ yet.” As Chart 2 shows, the year-over-year growth in combined real personal consumption and business equipment/software expenditures, at 3.1% in the third quarter, is the slowest since the second quarter 2003 and is down 130 basis points from its year-ago growth. That takes care of the “not so.”
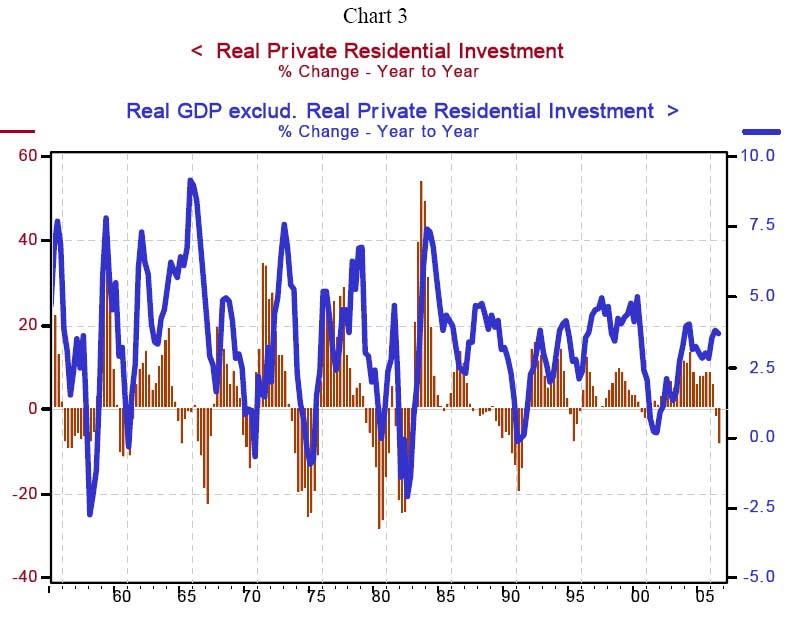
With regard to the “you-ain’t-seen-nothin’-yet” argument, take a look at Chart 3. You don’t have to examine it closely to see that the year-over-year behavior of residential investment expenditures leads the behavior of the rest of the economy. If you did look closely, you would see that the lead time tends to be about two calendar quarters. This implies that even if the trough of the housing recession is at hand, the full ripple effects from the weak housing sector have yet to lap up on the shore of the rest of the economy. Moreover, if the housing-recession trough lies ahead, the wave action from this sector will continue through most of 2007.Currently Northern Trust is forecasting 1.6% real annualized GDP growth in Q4, and 1.8%, 2.0%, 2.4% and 3.0% for each successive quarter in 2007. This is a forecast for sluggish growth in 2007, without a recession, and is similar to the Anderson forecast.
Another reason we believe the recession in housing will have a lingering retarding effect on economic activity concerns its impact on the “home ATM”, i.e., mortgage equity withdrawal (MEW). With home prices either falling or advancing more slowly, depending on the price series used, it stands to reason that growth in homeowners’ equity would be slowing.... So, the home ATM is not refilling as rapidly as it has in recent years. The slower growth in home equity along with the higher level of mortgage and home equity loan interest rates is slowing MEW, an important source of funding for household spending in recent years.
Friday, December 08, 2006
Freddie Mac: Anatomy of a Housing Recovery
by Calculated Risk on 12/08/2006 03:20:00 PM
From Freddie Mac chief economist Frank Nothaft, et al: Anatomy of a Housing Recovery
"The housing market has been central to the economic outlook for the past several years. A buoyant residential sector provided critical support in the recovery from the 2001 recession. More recently, the housing slowdown since mid-2005 has been instrumental in helping realize the Fed's goal of moderating economic growth, in order to nip inflationary pressures in the bud. Over the next several quarters, housing will again be key to the outlook, as a prolonged downturn could threaten more severe consequences for the overall economy, while a housing recovery could engender a broader upturn. Given the importance of housing at the current juncture, two key questions arise: What will a housing recovery look like; and, When will it arrive?
Previous housing booms help provide a historical context. Residential investment as a share of GDP, a broad indicator of overall housing activity, rose to nearly 6 percent in both 1973 and 1978, compared to a long-run average of 4 ½ percent. The investment share subsequently slid to approximately 4 percent over the ensuing six to eight quarters, before stabilizing. After reaching a trough, real residential investment rose in the following four quarters. Price appreciation (as measured by the yearly change in repeat-sales indexes) tends to slow after a peak, but did not turn negative on a national basis after these booms. Rather, the boom periods are generally followed by extended sluggish price gains, though economically depressed local and regional markets may register outright declines."
 Click on graph for larger image.
Residential investment (RI) has now fallen to 5.7% of GDP from the peak of 6.3% in the second half of 2005.
"During the recent boom, residential investment rose to a slightly higher share of GDP, reaching 6 ¼ percent in the second half of 2005. Investment has been declining rapidly since then, however, falling at an 18 percent annual rate (adjusted for inflation) in the third quarter, and is on track to a similar decline in the current period. This trend would reduce residential investment relative to GDP to 4 ½ percent in the second quarter of 2007, a change in line with declines in previous episodes, and over a similar six- to eight-quarter time frame."In the previous cycles mentioned, starting in 1973 and 1978, residential investment as a percent of GDP eventually declined to 3.7% and 3.2% respectively. To reduce residential investment relative to GDP to 4%, the current trend would have to continue through all of 2007. The Freddie Mac analysis excludes the early '90s bust: residential investment peaked at only 5.0% of GDP and declined over 13 quarters to 3.3% of GDP in early 1991.
I'm not sure why Nothaft is suggesting residential investment will only decline to the long-run average of 4 ½ percent. Also, for the previous residential investment downturns, the period from peak to trough were: early '70s - 8 quarters, late 70's, early '80s - 16 quarters, and late 80's, early '90s - 18 quarters. So the "six to eight quarters" timeframe seems optimistic.
"By contrast, forecasts of a more serious and prolonged housing slowdown fall well outside the range of post-war experience. For example, consider an annualized 18 percent decline in residential construction every quarter through end-2008. Under such a scenario, the drop in residential investment relative to GDP would be 50 percent greater than what occurred during the 1973-74 recession, reaching roughly 3 percent, a result worse than during even the most severe post-war recessions."The bottom of three previous troughs were: 3.7%, 3.3% and 3.2% relative to GDP. At the current rate of decline, the current downturn could last to about mid-2008 to reach about the same level. And the duration would only be about 11 quarters - shorter than two of the three previous downturns.
"... We expect housing markets to stabilize some time during the first half of 2007...."At each step of this analysis, Dr. Nothaft has shaded to the most positive view. The three previous cycles lasted from seven to eighteen quarters, and that became "six to eight quarters". The three previous bottoms were all in the mid 3% range (3.2% to 3.7%), yet Dr. Nothaft forecast the bottom of the current decline at the long-run average of 4 ½ percent. And, as Nothaft noted, a decline at the current pace to the long-run average would persist through mid-2007, but then Nothaft forecast the market to "stabilize some time during the first half of 2007".
If we are using a "historical context", why not forecast a more normal cycle downturn of 11 quarters and a bottom of 3.4%? Of course the bottom wouldn't occur until Q2 2008 at the current pace.
Mortgage Equity Withdrawal Declines in Q3
by Calculated Risk on 12/08/2006 11:55:00 AM
A few comments on Mortgage Equity Withdrawal (MEW):
1) The reason we are interested in MEW is that a portion of MEW is probably flowing to consumption and boosting GDP. As MEW declines, consumption growth will likely slow. Unfortunately MEW is difficult to calculate, and the percentage of MEW that flows to consumption is uncertain.
2) MEW is not an official statistic. Many people refer to the work of Greenspan and Kennedy: Estimates of Home Mortgage Originations, Repayments, and Debt On One-to-Four-Family Residences.
3) MEW could be calculated as the quarterly increase in mortgage debt minus the following: investment in new homes, investment in home improvements, commissions on homes sold, loan origination fees (including points), miscellaneous fees, capital gains (on homes) and other home sale related taxes. The result would be the total amount available for consumption. Some of this data is readily available, some is not.
4) I've suggested a simple and quick method of calculating MEW. I use the quarterly increase in the mortgage debt, and subtract 70% of Residential Investment (from the BEA). This is just a rough estimate of MEW.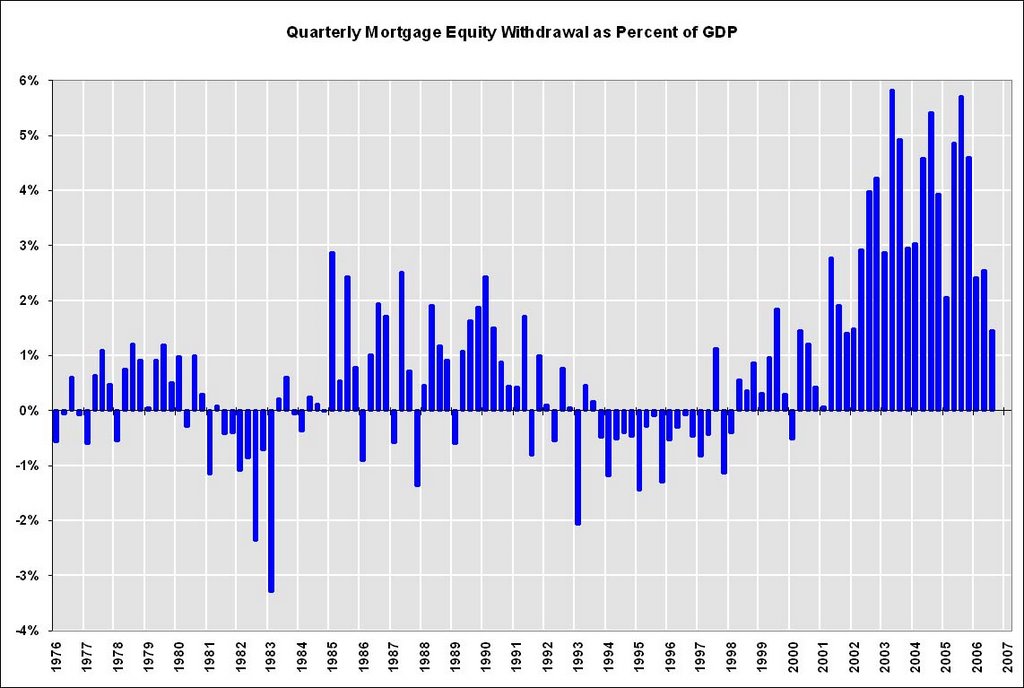 Click on graph for larger image.
Using the simple approach, this graph shows quarterly MEW (not SAAR) as a percent of GDP. This shows MEW has dropped to about 1.5% of GDP in Q3 2006, from close to 6% in Q3 2005.
Since MEW flows to consumption over the next few quarters, this might indicate a slowdown in consumer spending in the near future.
November Employment Report
by Calculated Risk on 12/08/2006 09:44:00 AM
The BLS reports: U.S. nonfarm payrolls rose by 132,000 in November, after a revised 79,000 gain in October. The unemployment rate rose to 4.5% in November, compared to 4.4% in October.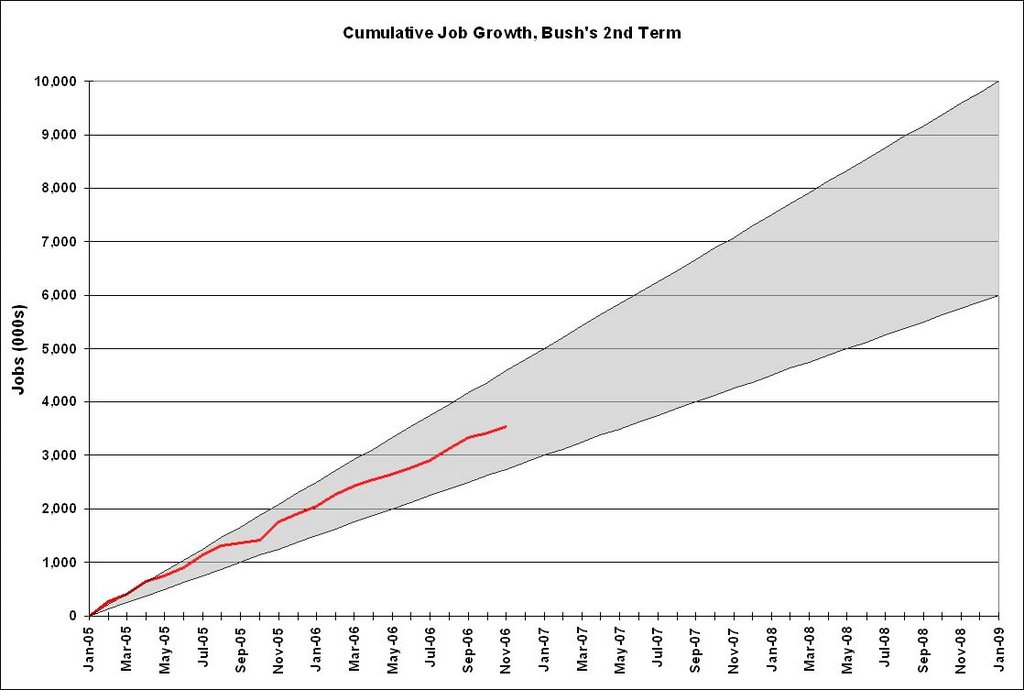 Click on graph for larger image.
Here is the cumulative nonfarm job growth for Bush's 2nd term. The gray area represents the expected job growth (from 6 million to 10 million jobs over the four year term). Job growth is about in the middle of the expected range.
The following two graphs are the areas I've been watching closely: residential construction and retail employment.
Residential construction employment decreased by 15,500 jobs in November and is down 110 thousand, or about 3.3%, from the peak in February. This is the beginning of the loss of several hundred thousand residential construction jobs over the next year or so.
Note the scale doesn't start from zero: this is to better show the change in employment.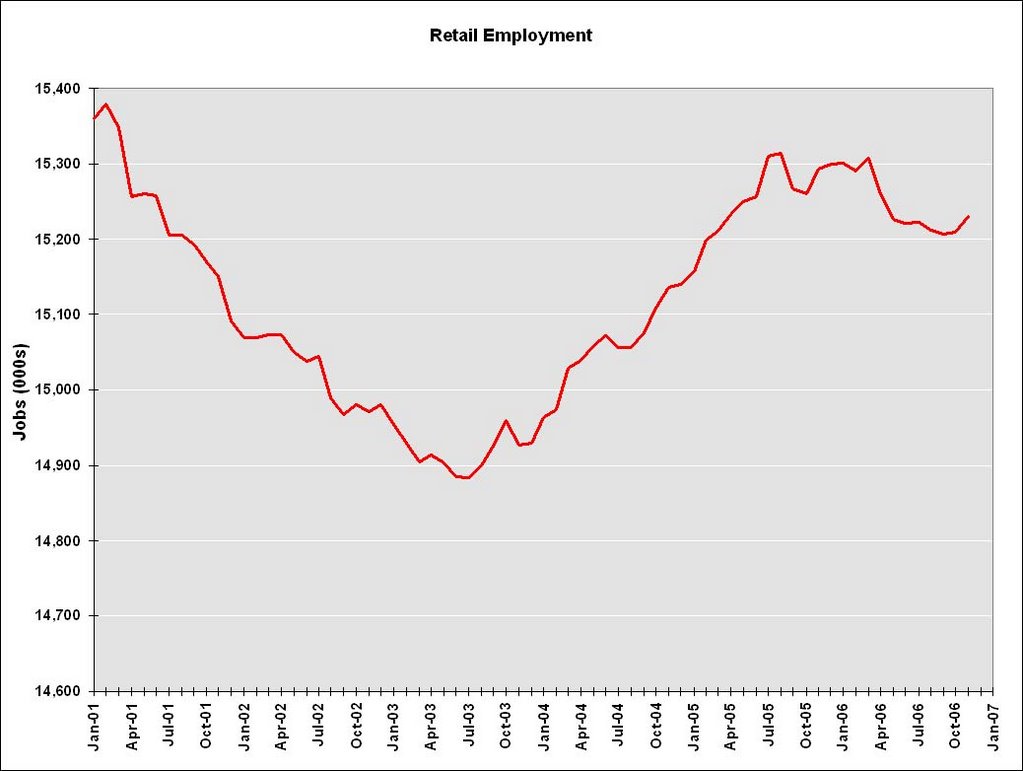
Retail employment increased 20,400 jobs in November. The YoY change in retail employment is now -0.4%.
The YoY decrease in retail employment is concerning: see Retail Employment
Overall this is a solid report, but there are weaknesses. It appears nonresidential construction might have peaked too:
Construction employment declined by 29,000 in November, following a loss of similar size in October. The November decline was spread across all component industries.And other weak areas:
Manufacturing employment continued to trend down (-15,000) in November. Motor vehicles and parts lost 7,000 jobs. Employment continued to fall in two construction-related industries: wood products (-6,000) and furniture and related products (-5,000).The expected job losses in residential construction employment has just started, but the spillover to retail isn't significant yet. I expect the rate of residential construction job losses to increase over the next few months.
Thursday, December 07, 2006
Credit Suisse on Homebuilders
by Calculated Risk on 12/07/2006 09:26:00 PM
In a research note titled: "Not So Fast", Credit Suisse' Zelman, et al, offered their top ten reason to downgrade the homebuilding sector.
Some of the reasons were technical or based on valuations, but mostly it was more supply and less demand.
I'm surprised at the percentage of respondents that are expecting to expand next year - I expect 2007 will be worse in every way for the homebuilders than 2006; fewer sales, fewer starts, less employment, lower prices, smaller margins, more homebuilders going under, etc..
Fed: Record Low Percentage Homeowner Equity
by Calculated Risk on 12/07/2006 01:43:00 PM
The Fed reported today that houseowner equity, as a percent of market value, fell to a record low 53.6%, compared to 54.0% in Q2, and 54.6% one year ago.
Homeowners borrowed almost the entire amount that their homes increased in value in Q3. Homeowner equity market value increased $194.5 Billion in Q3, to $20.48 trillion. Meanwhile homeowners mortgage debt increased $180 Billion. So homeowners borrowed 92% of the increase in market value. 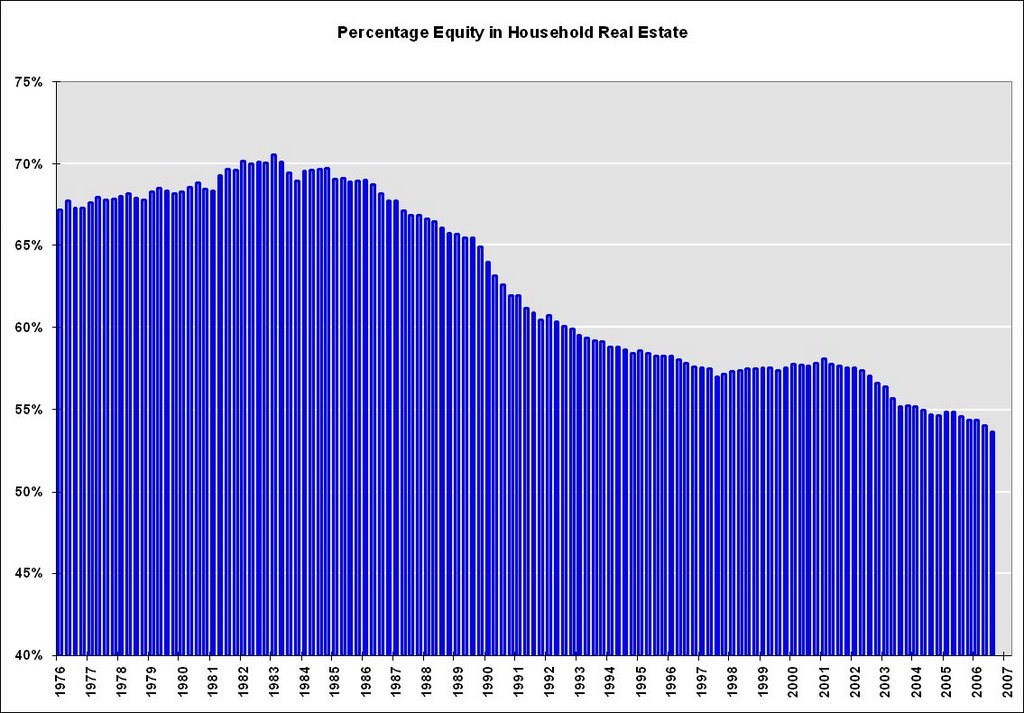 Click on graph for larger image.
Note: Graph doesn't start at zero to better show change in percent equity.
This may sound like a high percentage of equity, but according to Robert Broeksmit, Chairman of the Residential Board of Governors, Mortgage Bankers Association (from the Senate hearing on Wednesday):
"More than a third of homeowners, approximately 34 percent, own their homes free and clear."So many of the remaining homeowners have a very low percentage of equity. Note: Typically free and clear homes are older and have a lower market value than newer homes - so you can't just subtract 34% from 53.6% to find the percent equity of homeowners with mortgages. But this probably indicates that more and more homeowners have maxed out their "home ATM".
If house prices stabilize or fall over the next few years, the percentage equity will drop sharply (see 1990). This will make it more difficult for homeowners to extract equity from their homes.
Fed Flow of Funds: Mortgage Debt Increases $180 Billion in Q3
by Calculated Risk on 12/07/2006 12:10:00 PM
 Click on graph for larger image.
The Federal Reserve released the Q3 2006 Flow of Funds report today.
Household mortgage debt increased $180.0 Billion in Q3.
Much more to come.
Fun with the AP
by Calculated Risk on 12/07/2006 10:57:00 AM
After listening to the Toll conference call, I referred to Credit Suisse analyst Ivy Zelman as she. Now from the AP:
In conjunction with the sector downgrade, Zelman upgraded KB Home to "Neutral" from "Underperform." He's still concerned KB Home expanded too aggressively during the bubble and that the company's assets are at risk of declining in value. However, Zelman said he thinks that risk is reflected in the stock."He"?

An excerpt from a short bio of Ms. Zelman:
Ivy Zelman is a Managing Director at Credit Suisse First Boston, where she is also an Equity Research Analyst responsible for covering a total of 23 homebuilding, building products and furniture companies. For the last four years she has earned honors as the highest rated housing analyst in the nation by both the Institutional Investors All American Research Team and the Greenwich Associates Institutional Research Services Poll.And how about this headline from AP on Unemployment Claims: Jobless Claims Fall by Most in 6 Months
The total number of claims filed last week fell to 324,000, a decline of 34,000 from the previous week, the Labor Department reported Thursday. That represented the biggest one-week drop since the first week in June.The numbers are correct, but the hook is misleading.
 Click on graph for larger image.
Weekly claims are very noisy, so most analysts follow the 4-week moving average of weekly claims. The 4-week moving average has been moving up and is now at 328,750.
For claims, the trend is important, and the recent trend is an increase in claims.
Note: weekly claims isn't a reliable leading indicator for recessions. If a recession occurs, the 4-week moving average will probably be above 350K (dashed line on graph), but a rise above 350K could also be a false positive.


