 RSS Feed
 by Calculated Risk on 11/30/2006 01:14:00 PM
Thursday, November 30, 2006
Historical: Existing Home Sales and Inventory
The following graphs show existing home sales and inventory for the last 30+ years. The data is from NAR (via HUD, see table 7) Click on graph for larger image.
The first graph shows unit sales and inventory. Inventory is only available since 1982, and 2006 is estimated at 6.5 million sales, and 3.85 million homes for sale (current inventory numbers).
From 1978 to 1982, sales declined by 50%, from almost 4 million units per year to under 2 million units per year. In 1982, inventory almost equaled sales; the months of inventory was 11.5 (compared to 7.4 currently).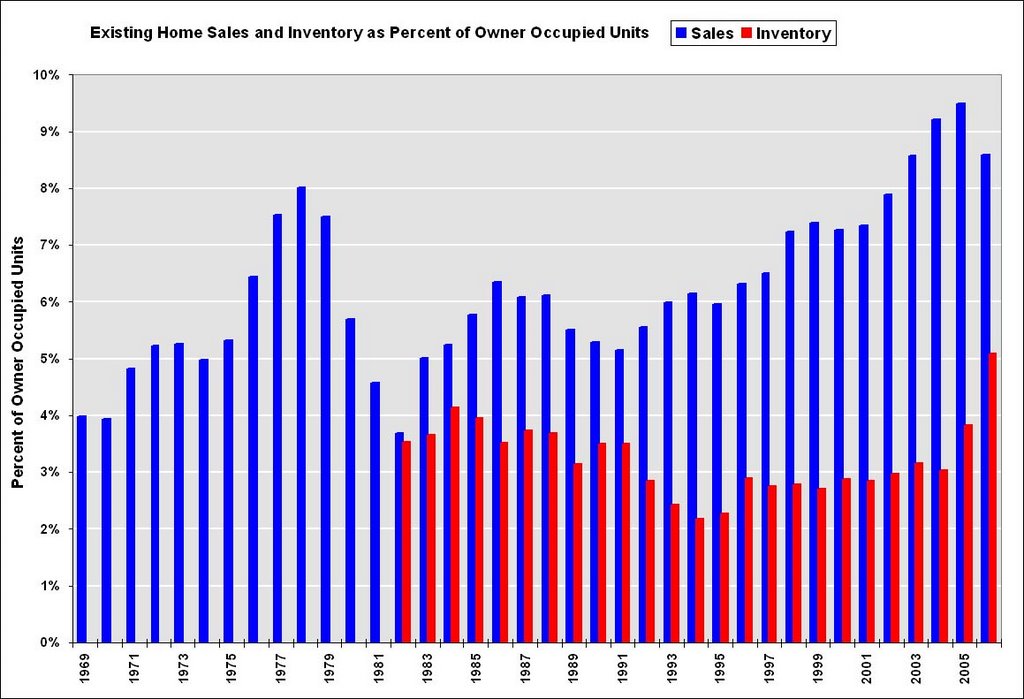 For the second graph, sales and inventory are normalized by the number of owner occupied units. This shows the extraordinary level of sales for the last few years, reaching 9.5% of owner occupied units in 2005. The median level is 6.0% for the last 35 years.
Some of the sales were for investment and second homes, but normalizing by owner occupied units probably provides a good estimate of normal turnover.
Credit Suisse (Nov 27, 2006) is are projecting existing home sales will fall to 5.9 million units in 2007. If inventories stay at the current level that would be about 8 months of inventory.
If sales fall back to 6% of owner occupied units that would be 4.5 million units per year - a significant decline from current levels.
Weak Chicago PMI, Weak Retail, and Rising Claims
by Calculated Risk on 11/30/2006 11:51:00 AM
I guess we could call today "Roubini Thursday".
From MarketWatch: Chicago economy weakens further in November
Business activity in the key Chicago area decelerated to its slowest pace in more than three years in November, raising fears of a broader slowdown in the U.S. economy, according to the National Association of Purchasing Management Chicago on Thursday.And on retail: Weak November start hurt retailers' sales
The closely-watched Chicago PMI, which measures activity in northern Illinois and parts of Indiana, unexpectedly fell to 49.9% on a seasonally adjusted basis from 53.5% in October.
Readings below 50% in the diffusion index indicate most firms that were surveyed are contracting. The regional economy had expanded for 42 straight months.
The nation's largest retailers turned in mostly disappointing sales results for November as sluggish sales at the beginning of the month outweighed a largely robust post-Thanksgiving start to the holiday shopping season.And on claims: U.S. weekly jobless claims highest in over a year (kudos to charts for predicting the jump in claims in the comment last night!)
Across the board, retailers ranging from Wal-Mart Stores and Costco Wholesale to J.C. Penney and Abercrombie & Fitch turned in weaker-than-expected numbers, according to sales reports issued Thursday.
With 48 of 56 retailers reporting, Thomson Financial said 54% had fallen short of expectations for same-store sales, the industry benchmark of growth measuring receipts rung up at stores open longer than a year.
First time claims for state unemployment benefits rose by 34,000 to 357,000 for the week ending Nov. 25. The rise in claims is up from a revised 323,000 the prior week, the Labor Department said.For claims, the number to follow is the 4-week moving average - currently 325K - and the key level is about 350K, possibly indicating a recession.
OFHEO: House Price Appreciation Slows Further
by Calculated Risk on 11/30/2006 10:13:00 AM
OFHEO released the Q3 House Price Index today: House Price Appreciation Slows Further
U.S. home prices rose in the third quarter of this year, but the rate of increase continued to slow and some areas experienced actual price declines. Nationally, home prices were 7.73 percent higher in the third quarter of 2006 than they were one year earlier. Appreciation for the most recent quarter was 0.86 percent, or an annualized rate of 3.45 percent. This reflects a further slowdown from that reported for the second quarter when the quarterly appreciation rate was 1.3 percent and the annualized rate was 5.1 percent. The quarterly increase is the lowest since the second quarter of 1998.
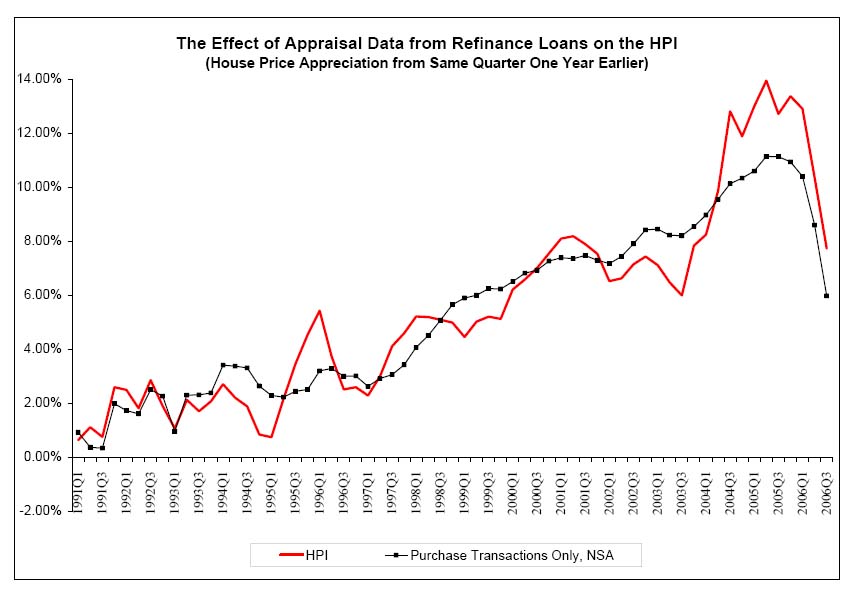 Click on graph for larger image.
This graph shows the effect of refinance data on the HPI. The purchase only index has increased 6.0% over the last four quarters, and increased 0.3% in Q3 (compared to 7.73% and 0.86% for the standard HPI).
The HPI is a lagging price indicator, but clearly shows price appreciation has slowed.
Wednesday, November 29, 2006
Dallas Fed: Making Sense of the U.S. Housing Slowdown
by Calculated Risk on 11/29/2006 11:15:00 PM
Dallas Fed Economic Letter: Making Sense of the U.S. Housing Slowdown (hat tip: Mark Thoma at Economist's View)
A nice overview. As Professor Thoma notes:
"The Dallas Fed analyzes the slowdown in the housing market and finds it difficult to make strong predictions about how it will play out."The author touches on several key topics, and uses an approach similar to mine to calculate MEW. Clearly MEW will fall, but Dr. Duca is unsure of the impact on consumption:
"Given these uncertainties, predicting how much a slowing housing market will affect consumption is difficult. This warrants monitoring of home prices, MEW and underlying consumption trends."I guess I'll keep monitoring prices, MEW and consumption trends!
More on October New Home Sales
by Calculated Risk on 11/29/2006 03:08:00 PM
Please see the previous post: October New Home Sales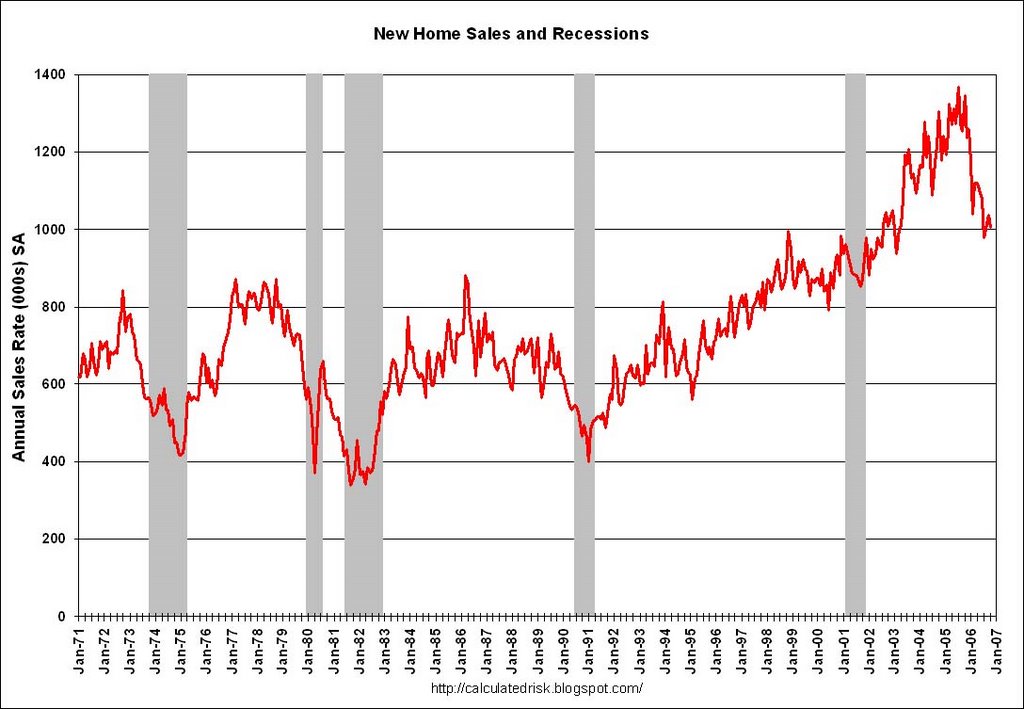 Click on graph for larger image.
One of the most reliable economic leading indicators is New Home Sales.
New Home sales were falling prior to every recession of the last 35 years, with the exception of the business investment led recession of 2001. This should raise concerns about a possible consumer led recession in the months ahead.
The second graph shows YTD New Home sales through October. It now appears that 2006 will finish as the 4th best year behind 2003. Sales for the most recent months have fallen back to the 2002 level.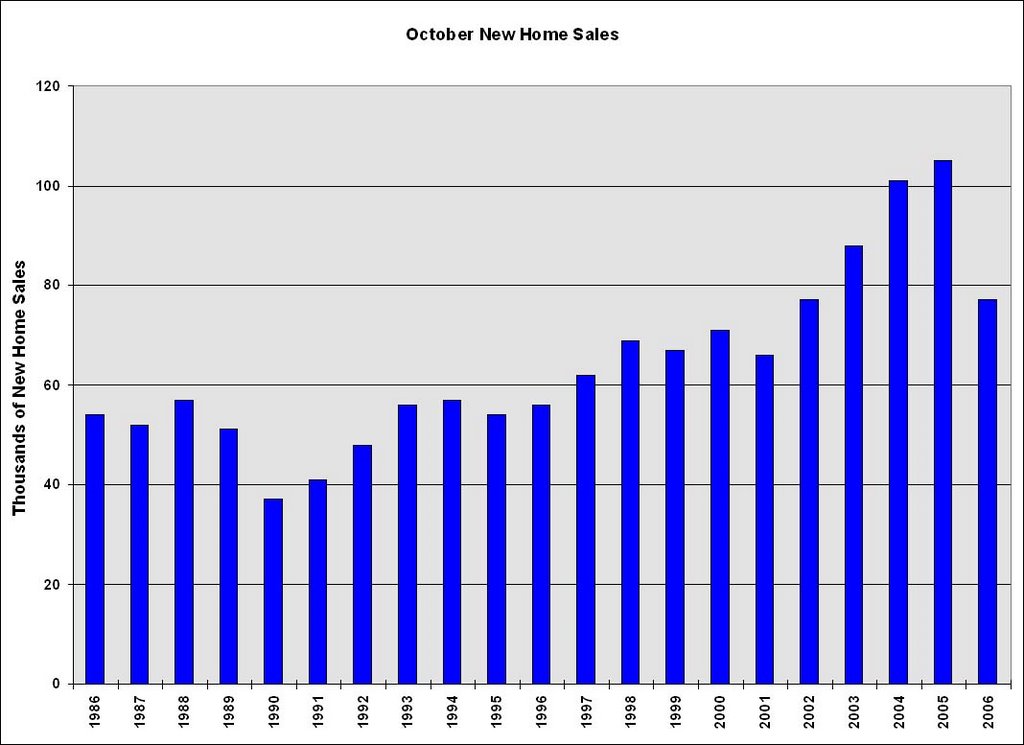
The third graph shows October New Home sales for the last 20 years. The recent sharp drop in sales is even worse than the decrease at the start of the 1990s housing bust.
October sales have fallen back to the 2002 levels.
Update: State Version of Nontraditional Mortgage Guidance
by Calculated Risk on 11/29/2006 11:58:00 AM
This web page, from the Conference of State Bank Supervisors (CSBS) and the American Association of Residential Mortgage Regulators (AARMR), tracks the states that have implemented the new Nontraditional Mortgage Guidance. As of this morning, there are eleven states listed. More are expected to be added this week.
From the CSBS this morning: The CSBS expects that all 50 states will adopt the guidance. Some states will issue regulations:
"So far, the majority of the states that have adopted have issued as regulatory guidelines. A few states (Massachusetts, for example) have or are going to begin their process to make a new regulation. This option takes longer to adopt, but is a much stronger regulatory tool. We have also had states indicate that they are issuing as guidance now, but if their regulated entities do not comply with the guidance, they will propose the guidance as a regulation."Note: This is the state version of the Federal Financial Regulatory Agencies guidance released in September. Here is the state version: GUIDANCE ON NONTRADITIONAL MORTGAGE PRODUCT RISKS
October New Home Sales: 1.004 Million SAAR
by Calculated Risk on 11/29/2006 10:14:00 AM
According to the Census Bureau report, New Home Sales in October were at a seasonally adjusted annual rate of 1.004 million. Sales for September were revised down to 1.037 million, from 1.075 million. Numbers for July and August were also revised down.
Click on Graph for larger image.
Sales of new one-family houses in October 2006 were at a seasonally adjusted annual rate of 1,004,000 ... This is 3.2 percent below the revised September rate of 1,037,000, and is 25.4 percent below the October 2005 estimate of 1,346,000.
The Not Seasonally Adjusted monthly rate was 77,000 New Homes sold. There were 105,000 New Homes sold in October 2005.
On a year over year NSA basis, October 2006 sales were 26.7% lower than October 2005. Also, October '06 sales were below October 2004 (101,000) and October 2003 (88,000) sales. This is the lowest October since 2002 when 77,000 new homes were also sold.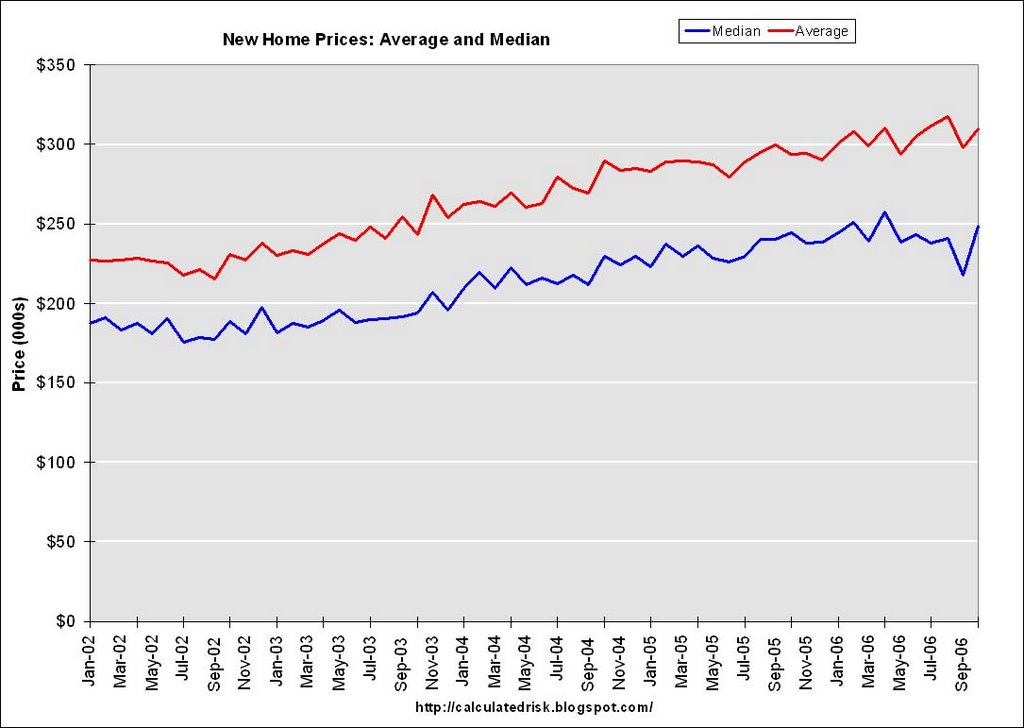
The median and average sales prices were up sharply. Caution should be used when analyzing monthly price changes since prices are heavily revised.
The median sales price of new houses sold in October 2006 was $248,500; the average sales price was $309,700.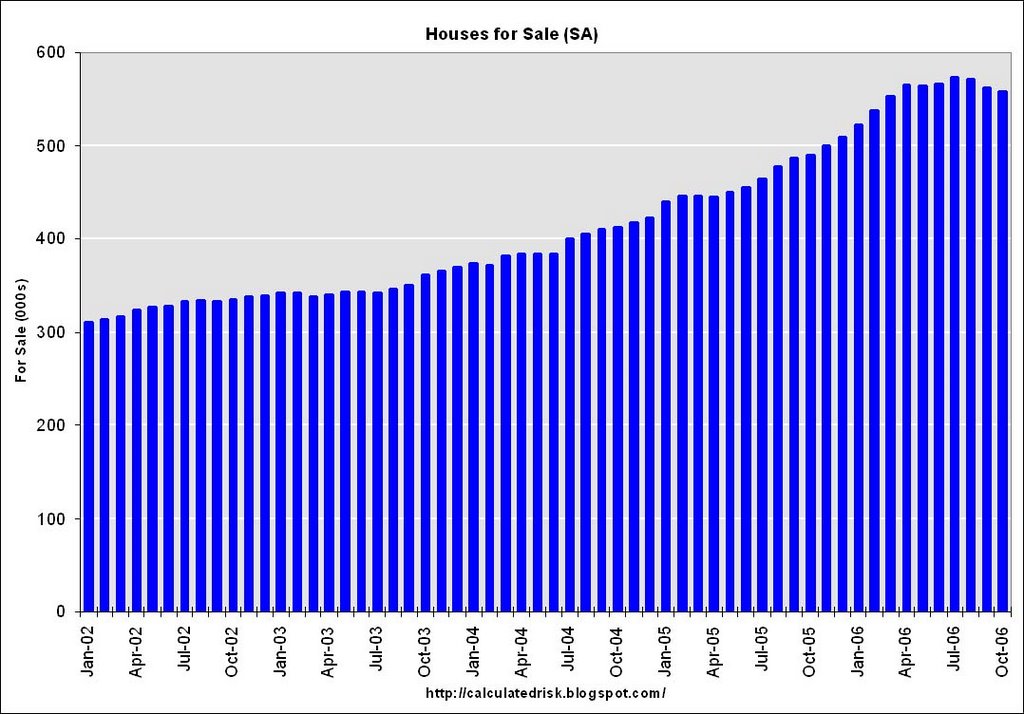
The seasonally adjusted estimate of new houses for sale at the end of October was 558,000. This represents a supply of 7.0 months at the current sales rate.
The 558,000 units of inventory is about the same as the last six months. Inventory numbers from the Census Bureau do not include cancellations - and cancellations are at record levels. Actual New Home inventories are much higher - some estimate about 20% higher.
On a months of supply basis, inventory is above the level of recent years.
This another very weak report, especially considering the strong downward revisions for the previous months.
More later today on New Home Sales.
MBA: Mortgage Applications Fall
by Calculated Risk on 11/29/2006 12:21:00 AM
The Mortgage Bankers Association (MBA) reports: Mortgage Applications Fall in Latest Survey 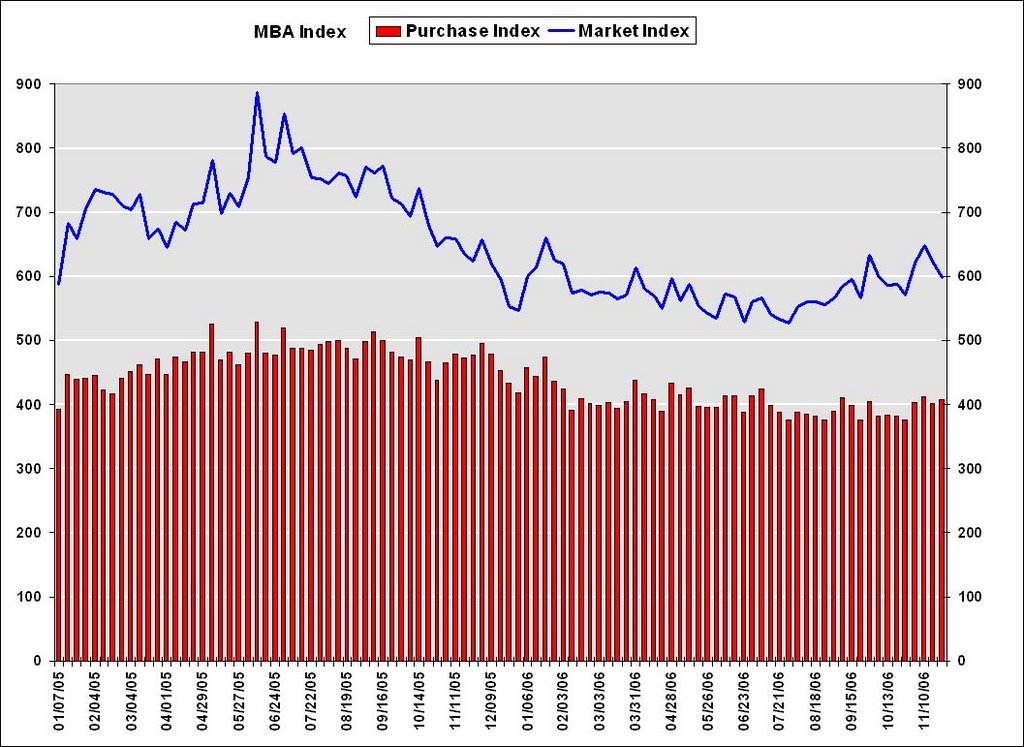 Click on graph for larger image.
The week was shortened due to the Thanksgiving holiday.Mortgage rates were stable:
The Market Composite Index, a measure of mortgage loan application volume, was 599, a decrease of 3.9 percent on a seasonally adjusted basis from 623.6 one week earlier. On an unadjusted basis, the Index decreased 34.4 percent compared with the previous week and was down 1.6 percent compared with the same week one year earlier.
The seasonally-adjusted Refinance Index decreased by 9.6 percent to 1749.6 from 1935.3 the previous week and the Purchase Index increased by 1.3 percent to 406.7 from 401.4 one week earlier.
The average contract interest rate for 30-year fixed-rate mortgages remained at 6.13 percent ...
The average contract interest rate for one-year ARMs decreased to 5.87 percent from 5.88 ...
 The second graph shows the Purchase Index and the 4 and 12 week moving averages since January 2002. The four week moving average is up 2 percent to 405.8 from 398 for the Purchase Index.
Although overall mortgage applications have declined, seasonally adjusted purchase applications have moved up slightly over the last few weeks.
Tuesday, November 28, 2006
OFHEO: Conforming Loan Limit Remains at $417,000
by Calculated Risk on 11/28/2006 11:30:00 PM
As expected, OFHEO announced today: 2007 Conforming loan limit to remain at $417,000
Office of Federal Housing Enterprise Oversight Director James B. Lockhart today announced the maximum 2007 conforming loan limit for single-family mortgages purchased by Fannie Mae and Freddie Mac (the Enterprises) will remain at the 2006 level of $417,000 for one-unit properties for most of the U.S.If OFHEO sticks to their earlier announcement, the maximum decline in the 2008 limit will be 0.16 percent.
The conforming loan limit determines the maximum size of a mortgage that an Enterprise can buy or guarantee. By law the maximum conforming loan limit is based on the October-to-October change in the average house price in the Monthly Interest Rate Survey (MIRS) of the Federal Housing Finance Board (FHFB). The FHFB reported the decline in the average price was $501, or 0.16 percent, from $306,759 in October 2005 to $306,258 in October 2006. This is the first decline in the MIRS since 1992-93.
OFHEO announced November 15 it would keep the limit at 2007 levels if there was a decrease in October-to-October house prices and would defer that decline for one year.
“This amount is in keeping with OFHEO’s recent announcement of an orderly and transparent process for any downward adjustment,” said Lockhart. “We made this decision so as not to disrupt the end-of-the-year pipeline of mortgages or the market for mortgage-backed securities,” said Lockhart.
OFHEO also stated previously that additional guidance for the 2008 limits would be issued early next year.
Conforming Loan Limit Percentage Increase
2007 $417,000 0%
2006 $417,000 15.9%
2005 $359,650 7.8%
Prior to this year’s decrease, the average increase in the FHFB survey over the previous five years was 8.8 percent.
OFHEO assumed responsibility for establishing the conforming loan limit with a February 2004 guidance.
The conforming loan limit is based on the FHFB monthly survey and not OFHEO’s quarterly House Price Index (HPI), which will be released November 30.
Bernanke, Roubini Revise Down Q4 Estimates
by Calculated Risk on 11/28/2006 05:23:00 PM
I watched Bernanke's speech, and my reaction was that he was very worried about future U.S. economic weakness. To my surprise, the always worth reading WSJ's Greg Ip wrote (see Economist's View for excerpts):
Mr. Bernanke's hawkish remarks on inflation and upbeat view of the economy contrast with the emerging view on Wall Street that the economy is weakening and inflation risks have faded.Upbeat view? Sure, Bernanke was fairly positive looking forward, but reading between the lines, I believe Bernanke is very worried. Just last week, CEA Chairman Ed Lazear forecast Q4 GDP at 2.7%:
"We are projecting real GDP to grow at 3.1 percent in 2006, and that's on a Q4, quarter four to quarter four basis."The annualized GDP for Q4 would have to be 2.7% to achieve 3.1% on a "quarter four to quarter four basis".
Today, Fed Chairman Bernanke projected Q4 GDP in the 1.6% to 2.6% range:
"... the indicators in hand suggest that real GDP growth this quarter is likely to be in the same general range that it was in the second and third quarters."Although the Fed and the CEA are separate, Bernanke's forecast is clearly below Lazear's.
In additional to revising down Q4 GDP estimates, Bernanke made several comments that shows he is following housing very closely. Bernanke pointed out that housing prices have fallen more than reported due to incentives, noted that new home inventories are higher than reported - and by extension, new home sales are lower - due to significant cancellations. Contrast these comments with Fed Vice Chairman Kohn's recent comments from October 4th:
"... any overbuilding in 2004 and 2005 was small enough to be worked off over coming quarters at close to the current level of housing starts."At that time housing starts were close to 1.7 million units (SAAR), and I suggested starts might have to fall to a rate of 1.1 million to work off the recent overbuilding. Since then, starts have already fallen to under 1.5 million (SAAR) and Bernanke is now suggesting there is more to come. Bernanke today:
"... we should keep in mind that even if demand stabilizes in its current range, reducing the inventory of unsold homes to more normal levels will likely involve further adjustments in production."But one of the most telling comments from Bernanke was when he tried to offer some possibilities for an upside surprise in 2007:
"... economic growth could rebound more vigorously than now expected. The solid rate of job growth, the decline in the unemployment rate, and the healthy pace of capital investment could be signals that underlying economic fundamentals are stronger than generally recognized. Moreover, to date there is little evidence that the weakness in housing markets is spilling over more broadly to consumer spending or aggregate employment."The rate of job growth and the unemployment rate are lagging indicators, and tell us nothing about future economic growth. Non-residential investment trails residential investment, so that is a weak argument too. Of course Bernanke's argument is that we are missing something and the strength in these areas is a reflection of that underlying strength. On the spillover from the housing bust into the general economy: any impact is ahead of us, not behind us.
Since Dr. Bernanke knows this, and chose to feature these indicators anyway, I'd guess that he thinks there is very little upside potential to his forecast. And plenty of downside risk.
Not to be outdone by Bernanke (just joking), Roubini lowered his Q4 estimate too:
"I have ... been arguing for months now that Q4 growth will be even lower than Q3 at between 0% and 1%. I am now comfortable to forecast that Q4 GDP growth will be closer to 0% than 1%."And Roubini notes Deutsche Bank has also lowered their forecast:
In light of continued weakness in the economic data, we are cutting our fourth quarter real GDP growth forecast to zero from the +1.0% that we were originally predicting.Bernanke looked like a deer in the headlights to me. Except this deer seems to have a good idea of what is coming.


