 RSS Feed
 by Calculated Risk on 11/28/2006 12:33:00 PM
Tuesday, November 28, 2006
Bernanke: Economic Outlook
Chairman Bernanke spoke today in New York: The Economic Outlook . A few excerpts, first on Q4 GDP:
At this juncture, information about economic activity in the fourth quarter is limited, and the range of plausible outcomes remains wide. But the indicators in hand suggest that real GDP growth this quarter is likely to be in the same general range that it was in the second and third quarters.On housing:
... a slowing in the pace of house-price appreciation was inevitable. Moreover, the sustained rise in prices, together with some increase in mortgage interest rates, sowed the seeds of the correction by making housing progressively less affordable. Declining affordability ultimately served to limit the demand for housing, leading to a deceleration in house prices and slowing home purchases.A reasonable description of the current housing situation.
The drop in home sales that began earlier this year has led homebuilders to curtail the rate of new construction. Indeed, single-family housing starts are down about 35 percent since their peak earlier this year. Obtaining a precise read on home prices is difficult: During a period of weak demand, potential sellers often choose to leave their homes on the market longer or even to remove them from the market, rather than accept price offers that are below their expectations. The timeliest data on house prices do not fully account for changes in the composition of home sales by location, size, and other characteristics. Moreover, the data do not capture hidden price cuts, as when builders try to stimulate sales through the use of "sweeteners" such as paying the customer's mortgage points or upgrading features of the house at no additional cost. Nevertheless, there can be little doubt that the rate of home-price appreciation has slowed significantly for the nation as whole. Some areas have continued to experience gains--albeit smaller ones than before--while other markets have seen outright price declines.
Notwithstanding the sharp reduction in starts of new single-family houses, inventories of both new and existing homes for sale have increased markedly this year. For example, according to the most recent data, homebuilders currently have about 550,000 new homes for sale, roughly half again the number that has been typical during the past decade. Moreover, the official statistics likely understate the full extent of the inventory buildup, as many homebuilders have reported a sharp increase this year in the number of buyers canceling signed contracts. A home for which the sales contract is cancelled becomes available for sale once again but is not included in the official data on the inventory of unsold new homes. To reduce this inventory overhang, builders are likely to continue to limit the number of new homes under construction.
Although residential construction continues to sag, some indications suggest that the rate of home purchase may be stabilizing, perhaps in response to modest declines in mortgage interest rates over the past few months and lower prices in some markets. Sales of new homes ticked up in August and increased a bit further in September. The University of Michigan's survey of consumers shows an increase in the share of respondents who believe that now is a good time to buy a home, from 57 percent in September to 67 percent in November. Meanwhile, an index of applications for mortgages for home purchases has been trending up since July. Although these developments are encouraging, we should keep in mind that even if demand stabilizes in its current range, reducing the inventory of unsold homes to more normal levels will likely involve further adjustments in production. The slowing pace of residential construction is likely to be a drag on economic growth into next year. emphasis added
Bernanke also acknowledges the slowdown in manufacturing:
Growth in some manufacturing industries has also slowed of late, and data prepared by the Federal Reserve show that aggregate manufacturing production declined in September and October. The motor vehicle sector in particular has experienced weaker demand and an accompanying buildup in stocks of unsold cars and trucks over the past year.Bernanke also notes the downside risks:
Like all economic forecasts, this one is provisional, and risks exist in both directions. On the downside, the correction in the housing market could turn out to be more severe and widespread than seems most likely at present. A deeper correction would directly affect economic activity through additional cutbacks in housing starts and through its effects on employment in construction and housing-related industries. More indirectly, it might also impose greater restraint on consumer spending by reducing homeowners' equity and thus household wealth, and perhaps by affecting consumer confidence as well. Because consumption makes up more than two-thirds of aggregate expenditure, any significant effect on consumer spending arising from further weakness in housing would have important implications for the economy.The downside is clearly more likely.
On the other hand, economic growth could rebound more vigorously than now expected. The solid rate of job growth, the decline in the unemployment rate, and the healthy pace of capital investment could be signals that underlying economic fundamentals are stronger than generally recognized. Moreover, to date there is little evidence that the weakness in housing markets is spilling over more broadly to consumer spending or aggregate employment. If these trends continue, growth in real activity might return to a pace that could intensify upward pressures on resource utilization.
NAR: Sales Up, Inventory Up
by Calculated Risk on 11/28/2006 10:26:00 AM
The National Association of Realtors (NAR) reports: Existing Home Sales Rise in October, Market Stabilizing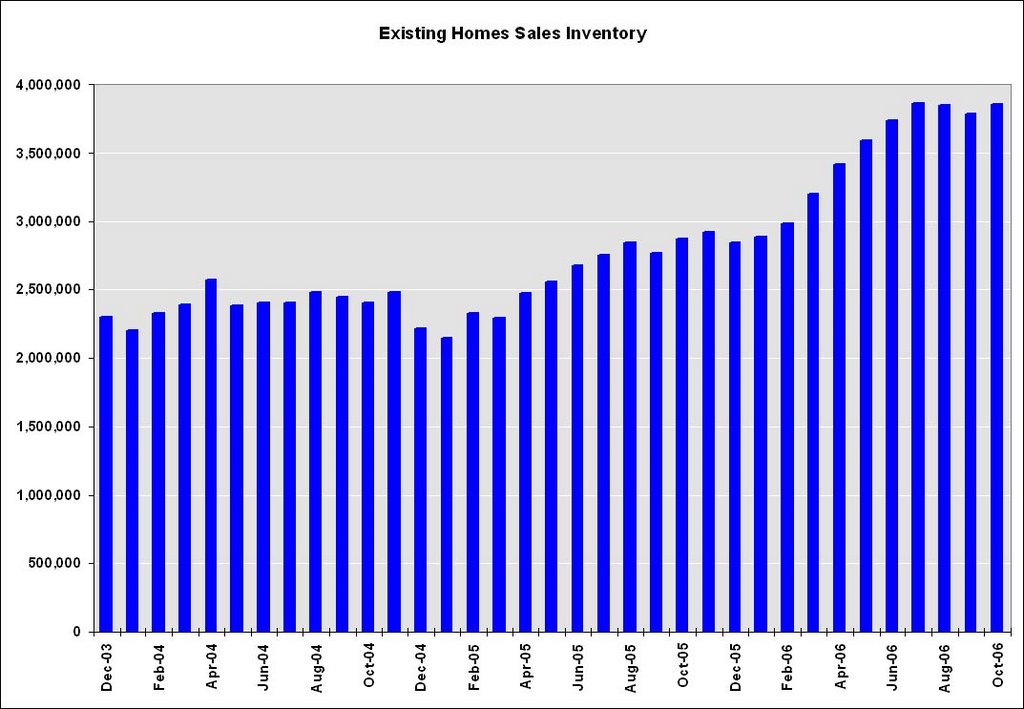
Click on graph for larger image.
Total existing-home sales – including single-family, townhomes, condominiums and co-ops – rose 0.5 percent to a seasonally adjusted annual rate1 of 6.24 million units in October from an upwardly revised pace of 6.21 million in September, but were 11.5 percent below the 7.05 million-unit level in October 2005.

Total housing inventory levels increased 1.9 percent at the end of October to 3.85 million existing homes available for sale, which represents a 7.4-month supply at the current sales pace.Existing Home Sales are a trailing indicator. The sales are reported at close of escrow, so October sales reflects agreements reached in August and September.

As I've noted before, usually 6 to 8 months of inventory starts causing pricing problem - and over 8 months a significant problem. With current inventory levels at 7.4 months of supply, inventories are now well into the danger zone and prices are falling in most regions.
Monday, November 27, 2006
Ameriquest Mortgage For Sale
by Calculated Risk on 11/27/2006 04:24:00 PM
Dow Jones reports: Ameriquest Mortgage Hires JPMorgan To Advise On Sale
A reminder for CEOs: Never name a stadium, it's bad luck.
Ameriquest Field (named in May 2004), Arlington, Texas. Home of the Texas Rangers.

Fed Expressed Concern About "Housing Bubble" in 2002
by Calculated Risk on 11/27/2006 12:31:00 PM
Via the WSJ Markebeat: Distant Early Warning (hat tip: K-Dawg)
The Federal Reserve had some idea of the problems posed by inflated housing values back in 2002, according to summaries of meetings held by the Federal Advisory Council, a group comprised of the Fed governors and a dozen representatives from regional and national banks. The FAC meets quarterly to discuss monetary policy, financial regulation and other matters — summaries are released with a three-year lag — and in December 2002, during Alan Greenspan’s tenure, the council was already warning of problems related to housing. Although the signs were limited, the summary shows that the Fed was already discussing the possibility of a housing bubble as much as four years ago, not long after the technology-stock bubble burst.
“Whereas evidence of a ‘housing bubble’ is anecdotal and regionalized, the Council does express concern that housing prices will not be able to rise at this pace forever,” the summary says. “Levels of home equity have been supported by these increased housing values but should those values begin to fall, lenders will be faced with higher loan to value ratios and with little room for the problems created by a potential downturn in the economy.”
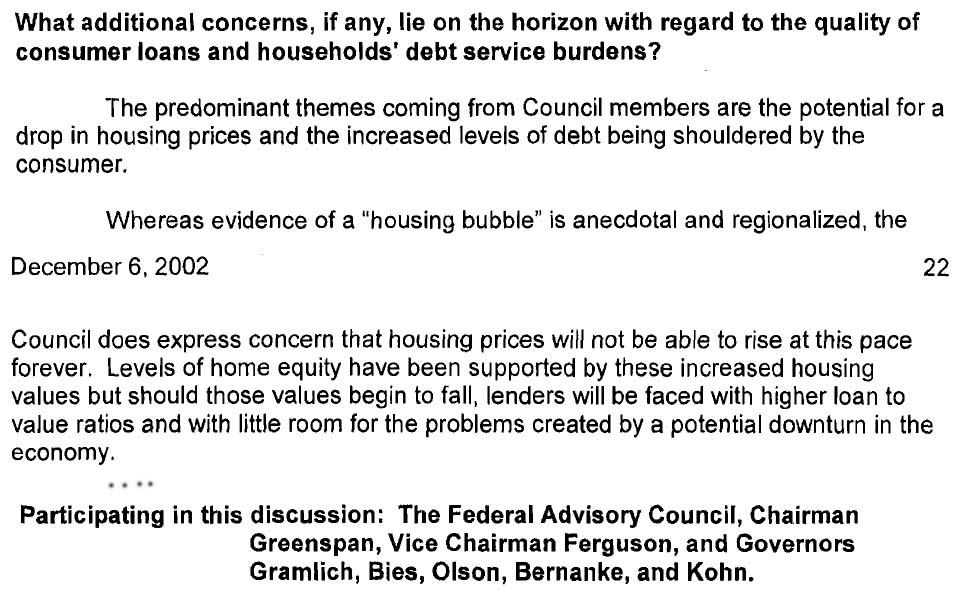 Click on image for larger view.
From Federal Advisory Council (FAC) minutes, December 6, 2002. Note: Paragraph on consumer credit removed.
The FAC included members of the banking industry and Wall Street. See document for members.
WaPo on Non-Residential Construction
by Calculated Risk on 11/27/2006 12:25:00 AM
From the WaPo: Commercial Boom Softens Housing Bust
To understand why the housing slump hasn't dragged the economy into a recession, it helps to visit the Smoketown Plaza in Woodbridge, where the thumping of hammers signals the healthy pulse of a building boom that's still going strong.The main reasons the housing bust hasn't dragged the economy into a recession yet, are: 1) there have been few layoffs in residential construction (they are coming), and 2) mortgage equity withdrawal (MEW) has still been strong (MEW will slow soon). The boom in non-residential construction has helped, but if the bust follows the typical pattern, the non-residential boom will end soon (or is already ending).
...
[These commercial projects have boosted] non-residential construction enough over the past year to more than offset the decline in home construction. That boom is helping to cushion the impact of the housing slump on the economy.
The money spent on private non-residential construction nationally rose a sizzling 19.2 percent over the 12 months that ended in September, according to Census data. In addition, state and local governments are building roads, schools and other public buildings. Public construction rose a robust 11.6 percent in the year ended in September.These YoY numbers are correct, but the picture is different if you look at the last 6 months. Total nominal private construction spending peaked in May, and has declined since then. Total construction spending, including public spending, peaked in June.
Add it all up and the increase in non-residential work more than offset the 6.7 percent decline in home building over the same period, so the value of all construction rose a net 2.9 percent.
Builders of non-residential projects say they are simply playing catch-up. So many new neighborhoods filled up during the housing boom that they're still building the stores, offices, restaurants, bank branches, hotels and hospitals needed to serve the influx of residents.From a previous post, but worth repeating: YoY Residential Investment typically leads YoY Non-residential investment by 3 to 5 quarters.
In Prince William County, for example, the population surged by 23 percent in the past five years, during the peak of the home-building boom, to 374,678 people. Now, many residents complain they have to drive too far, often to Fairfax County, for basic business services.
The companies that provide those services "don't build until they see the rooftops" over new customers, said Bill Fairchild, president of R.W. Murray Co., a construction contractor in Manassas that's overseeing the Arby's on Minnieville Road and a dozen other non-residential projects in Northern Virginia. "People have got to get groceries. They've got to get their hair cut. They need to go to the cleaners."
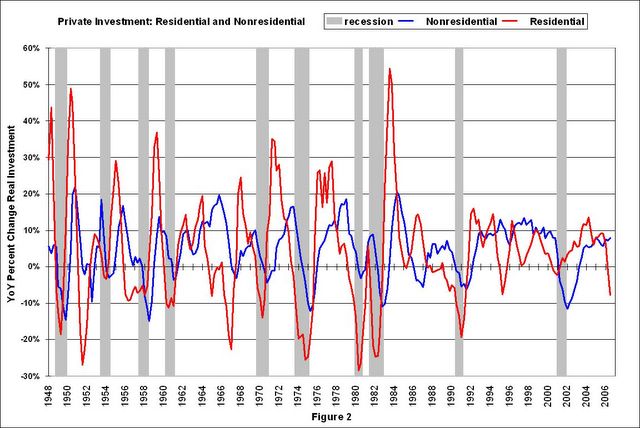 Click on graph for larger image.
This graph shows the YoY change in residential investment vs. nonresidential investment. As I noted in August: In general, residential investment leads nonresidential investment. There are periods when this observation doesn't hold - like '95 when residential investment fell and the growth of nonresidential investment remained strong.
Another interesting period was 2001 when nonresidential investment fell significantly more than residential investment. Obviously the fall in nonresidential investment was related to the bursting of the stock market bubble. But typically changes in residential investment lead changes in nonresidential investment, and GDP, by three to five quarters.
As the article noted, companies don't build non-residential projects "until they see the rooftops" - and that is why there has been a non-residential boom - about 3 to 5 quarters behind the final residential boom. But the analysis in the article didn't take the next step - what happens to non-residential construction 3 to 5 quarters after the residential construction bust? The graph above provides the likely answer.
Saturday, November 25, 2006
Strong Black Friday Sales
by Calculated Risk on 11/25/2006 06:39:00 PM
From AP: Black Friday sales up 6 percent over '05
The nation's retailers had a strong start to the holiday shopping season, according to results announced Saturday by a national research group that tracks sales at mall-based stores. One big exception was Wal-Mart Stores Inc., which said it expects to report same-store sales in November below its already lackluster forecast.This is to balance out the previous post!
According to ShopperTrak RCT Corp., which tracks total sales at more than 45,000 mall-based retail outlets, total sales rose 6 percent to $8.96 billion on Friday, the start of the holiday shopping season, compared to the same day a year ago.
Wal-Mart sees weak sales
by Calculated Risk on 11/25/2006 01:23:00 PM
From Reuters: Wal-Mart sees weak sales as holiday season starts
Wal-Mart Stores Inc. predicted a rare decline in monthly sales on Saturday, even as U.S. bargain-hunters jammed stores in search of gifts at the start of the crucial holiday shopping season.Holiday retail sales are important every year, but as the article noted:
...
Wal-Mart estimated that November sales fell 0.1 percent at its U.S. stores open at least a year -- a closely watched retail measure known as same-store sales.
The retailer will provide a final monthly sales report on Thursday, when most other major chain stores report their November figures. This would mark Wal-Mart's first monthly same-store sales decline since April 1996.
Wal-Mart had expected same-store sales to be flat compared with the same period last year, which many Wall Street analysts had viewed as disappointing. Wal-Mart's four-week November sales period ended on Friday.
Investors are watching holiday sales particularly closely this year to gauge how consumers are coping with a slowdown in the housing market that has already hurt home improvement retailers and furniture stores.
Thursday, November 23, 2006
UBS: 2006 Subprime Loans Doing Badly
by Calculated Risk on 11/23/2006 01:11:00 AM
From AP: UBS: 2006 Subprime Loans Doing Badly
Subprime loans ... in particular those used to back mortgage bonds, could prove to be one of the worst-performing groups yet, according to UBS.
Wednesday, November 22, 2006
MBA: Mortgage Applications Decline
by Calculated Risk on 11/22/2006 10:42:00 AM
The Mortgage Bankers Association (MBA) reports: Mortgage Applications Fall in Latest Survey 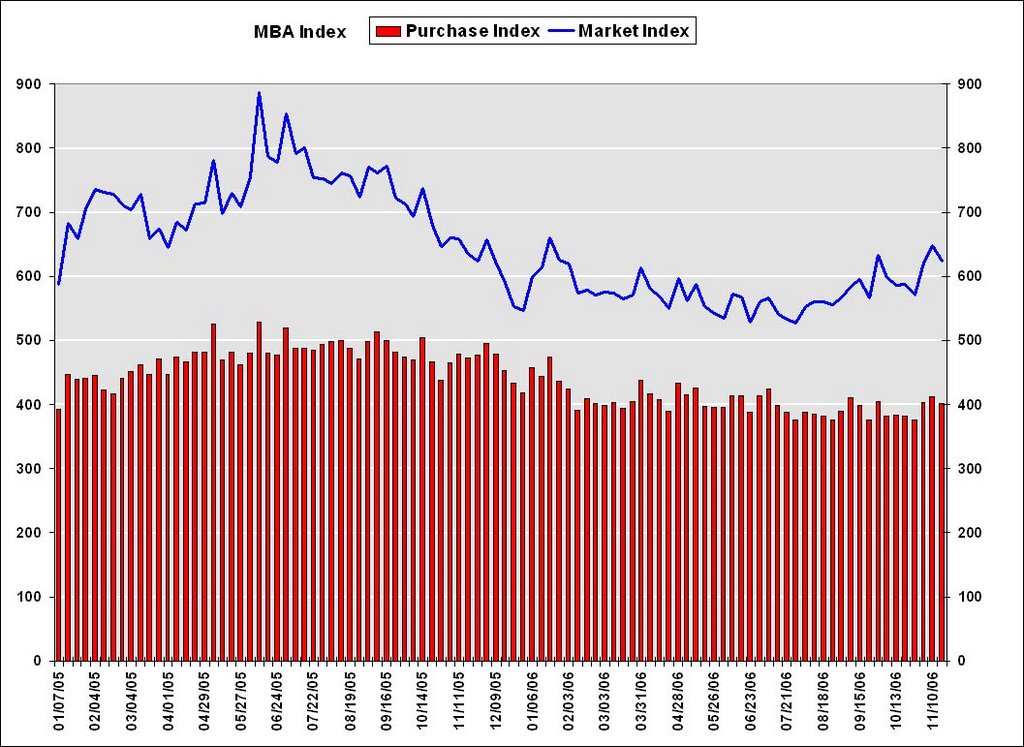 Click on graph for larger image.
The Market Composite Index, a measure of mortgage loan application volume, was 623.6, a decrease of 3.7 percent on a seasonally adjusted basis from 647.5 one week earlier.Mortgage rates were stable:
The seasonally-adjusted Refinance Index decreased by 4.3 percent to 1935.3 from 2022.2 the previous week and the Purchase Index decreased by 2.8 percent to 401.4 from 412.9 one week earlier.
The average contract interest rate for 30-year fixed-rate mortgages decreased to 6.13 percent from 6.14 percent ...
The average contract interest rate for one-year ARMs increased to 5.88 percent from 5.87 ...
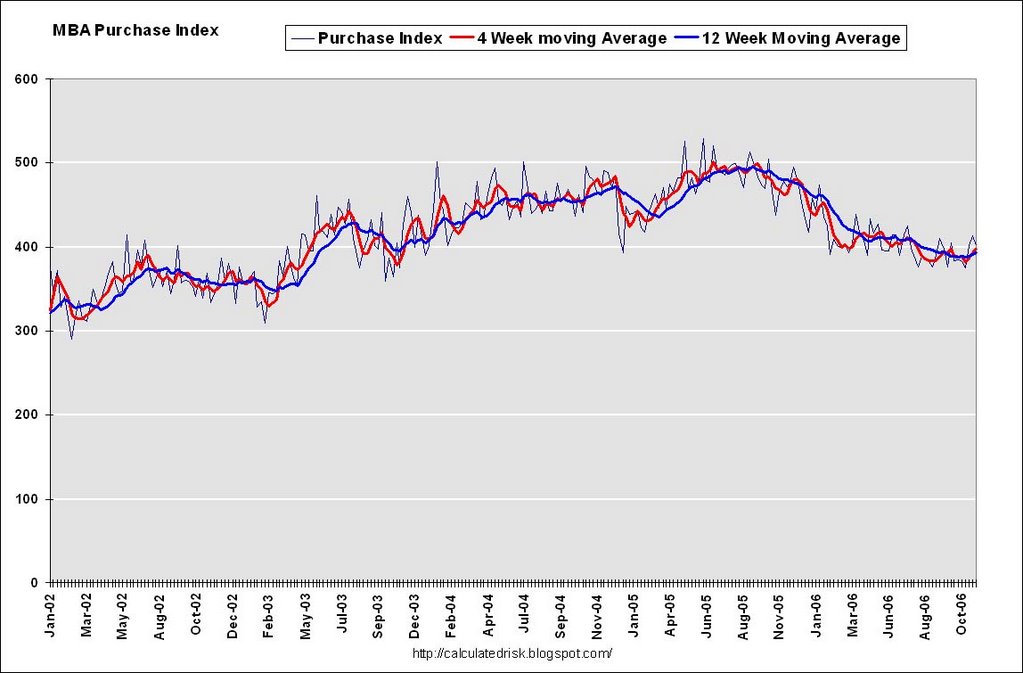 The second graph shows the Purchase Index and the 4 and 12 week moving averages since January 2002.
Tuesday, November 21, 2006
Lazear Still Misunderstands Housing
by Calculated Risk on 11/21/2006 06:59:00 PM
"The housing market, as you know, it has been hit, I think, harder than most of us had expected."During the housing boom, there were two distinct views of the causes of the boom. The consensus view was that the boom was mostly driven by fundamentals and perhaps a little "froth" in 2005.
Edward Lazear, Q&A Nov 21, 2006, chairman of the White House's Council of Economic Advisers
The minority opinion was that the housing market had become a bubble. The minority view was based on evidence of speculation: flippers, a high percentage of investment purchases, and homebuyers using excessive leverage, especially with nontraditional mortgage products.
Now that the housing bust is here, there are also two views of the bust. The consensus view is that the "worst is over". The minority view is that the bust has a ways to go.
Not surprisingly, those that felt the boom was based on fundamentals now believe the worst is over. And those that felt the boom was driven by excessive speculation believe the housing market will continue to slowdown. How one viewed the housing boom colors how one looks at the housing bust.
All the evidence so far suggests the minority view was correct. The severity of the bust has caught the majority off guard as evidenced by Lazear's comments above. Here are Lazear's comments today on housing:
Question: I was wondering if you could talk more about your outlook for the housing market. Do you expect there to be -- it to bottom in 2007? And is the worst behind us in your opinion? And what are the risks, in your mind, of a recession?And Lazear's answer:
CHAIRMAN LAZEAR: The housing market, as you know, it has been hit, I think, harder than most of us had expected. Most forecasters were expecting a slower decline. What that probably signals is that the future will not be as negative as it otherwise would have been because we've probably had much of the decline that we're expecting to have.Maybe. The other possibility is that Lazear and most forecasters misunderstood the housing boom, and they remain too optimistic about the housing bust. Lazear:
That said, there are -- you know, there are a number of indications that things are still not as strong as they were last year in the housing market. You know, do I see that as a problem for the economy? Obviously, we don't like to see any one industry get hit and hit hard. That affects people's jobs. The good side of that, of course, has been that non-residential construction has taken up much of the slack in that industry. So we haven't seen construction jobs fall off dramatically as a result of the housing decline.Residential construction is off $55 Billion (SAAR), and non-residential construction is up $38 Billion from December 2005 (Census Bureau, Construction Spending). So Lazear is correct that non-residential spending has "taken up much of the slack".
But Lazear is overlooking a few facts: Even though starts have fallen off a cliff, completions are still near record levels - and when completions fall (they trail starts by about 6 months), construction spending will drop significantly. Also, non-residential investment tends to trail residential investment.
And the reason residential construction jobs haven't fallen "off dramatically as a result of the housing decline" is jobs track housing completions (for obvious reasons). I've presented these graphs before, but they fit here ...
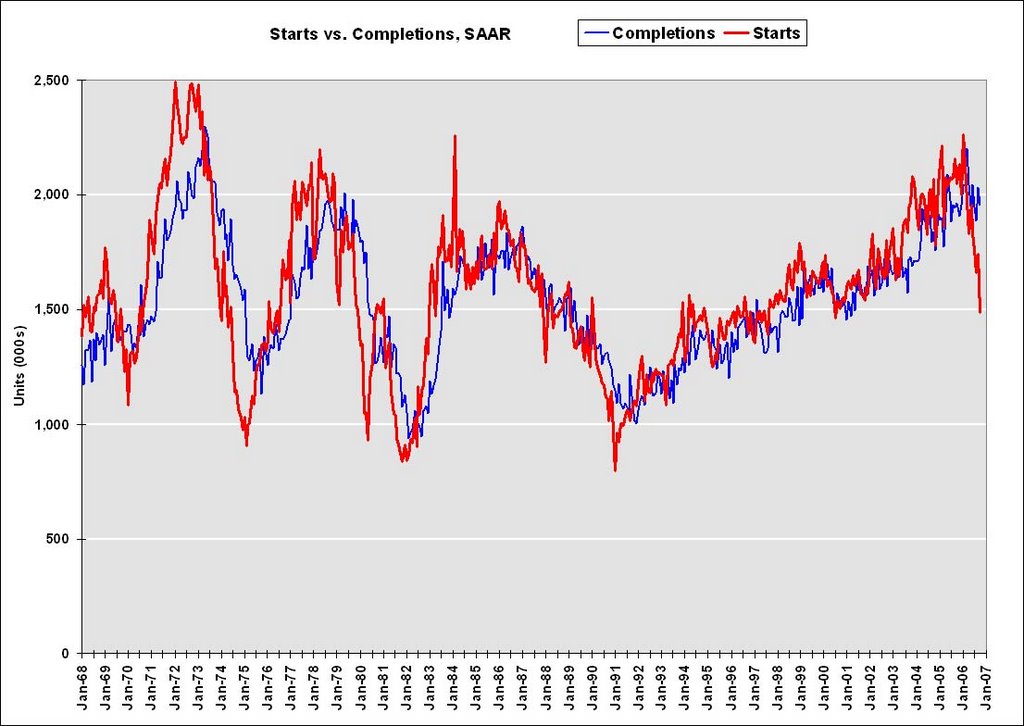 Click on graph for larger image.
The first graph shows Starts vs. Completions.
Starts have fallen "off a cliff", but completions have just started to fall.

This graph shows starts, completions and residential construction employment. (starts are shifted 6 months into the future). Completions and residential construction employment are highly correlated, and Completions lag Starts by about 6 months.
Based on historical correlations, it is reasonable to expect Completions and residential construction employment to follow Starts "off the cliff".
More Lazear:
And I would say that as we go forward what we'd be concerned about is employment in that industry and looking to see how it transmits to the rest of the economy. I don't believe that it is going to transmit to the rest of the economy. There's been no indication that it has. Other sectors remain strong. And that would be the primary danger that I would see from the housing market, whether it's bottomed out now or whether it will take another quarter or so to bottom out I think is still up for grabs, and I wouldn't want to speculate on it.Lazear doesn't want "to speculate" on when the housing market will bottom out, but then says "now ... or another quarter or so". Lazear has been consistently surprised by the housing bust, and my guess is he will be surprised some more! But on the last point, job numbers do tell us the economy is decent right now, but they tell us nothing about the future.
But I would be willing to tell you that I don't think that this signifies any kind of weakness throughout the economy, in fact the reverse. The job numbers I think are probably the best indicator that the economy is very strong and in really good shape.
Question: And the risk of recession, do you have a --What can I say? Oh, Lazear also revised down the White House estimates for GDP growth for Q4 and 2007.
CHAIRMAN LAZEAR: Well, again the economy is growing. I don't even think we should be talking about going in the other direction at this point. The economy is growing. The economy is strong. The labor market is strong. You know, you see -- when you see jobs added at this rate, when you see unemployment at 4.4 percent, it's pretty hard to be thinking about things going in the other direction. I mean obviously at some time in the future things can change, but right now, as long as we keep our policies consistent with economic growth, which means keep taxes low, make sure that we don't put impediments, strong impediments to trade and business in there, I think we're on track for a strong economy.


