 RSS Feed
 by Calculated Risk on 11/30/2006 01:14:00 PM
Thursday, November 30, 2006
Historical: Existing Home Sales and Inventory
The following graphs show existing home sales and inventory for the last 30+ years. The data is from NAR (via HUD, see table 7) Click on graph for larger image.
The first graph shows unit sales and inventory. Inventory is only available since 1982, and 2006 is estimated at 6.5 million sales, and 3.85 million homes for sale (current inventory numbers).
From 1978 to 1982, sales declined by 50%, from almost 4 million units per year to under 2 million units per year. In 1982, inventory almost equaled sales; the months of inventory was 11.5 (compared to 7.4 currently).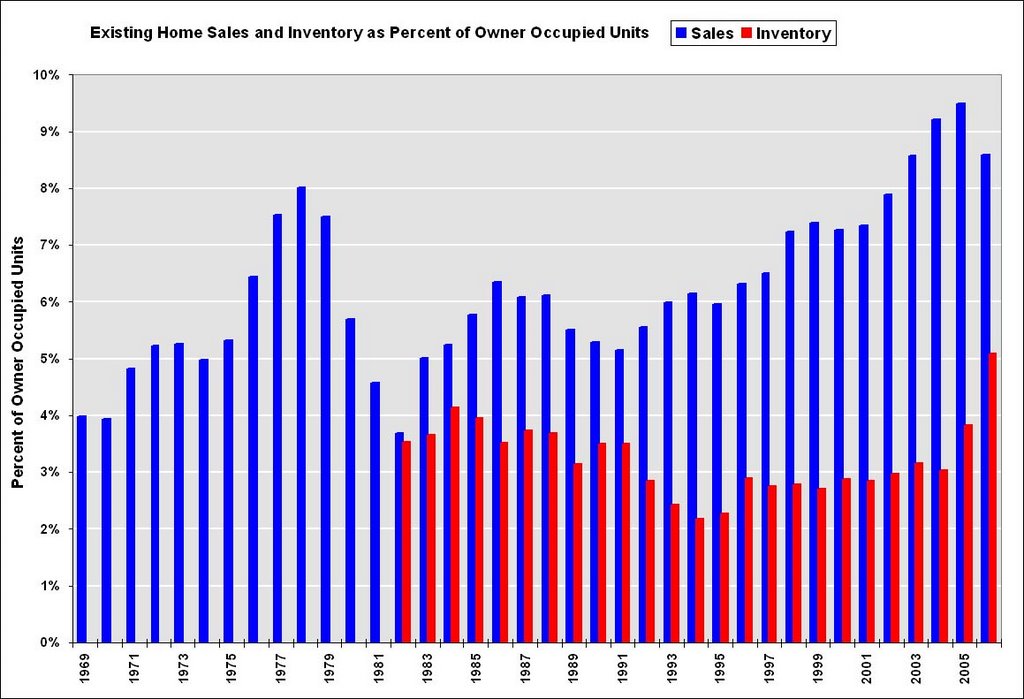 For the second graph, sales and inventory are normalized by the number of owner occupied units. This shows the extraordinary level of sales for the last few years, reaching 9.5% of owner occupied units in 2005. The median level is 6.0% for the last 35 years.
Some of the sales were for investment and second homes, but normalizing by owner occupied units probably provides a good estimate of normal turnover.
Credit Suisse (Nov 27, 2006) is are projecting existing home sales will fall to 5.9 million units in 2007. If inventories stay at the current level that would be about 8 months of inventory.
If sales fall back to 6% of owner occupied units that would be 4.5 million units per year - a significant decline from current levels.


