 RSS Feed
 by Calculated Risk on 12/26/2010 08:29:00 AM
Sunday, December 26, 2010
Summary for Week ending December 25th
Note: here is the economic schedule for the coming week.
Below is a summary of the previous week, mostly in graphs.
• November Existing Home Sales: 4.68 million SAAR, 9.5 months of supply
 Click on graph for larger image in graph gallery.
This graph shows existing home sales, on a Seasonally Adjusted Annual Rate (SAAR) basis since 1993.
Sales in November 2010 (4.68 million SAAR) were 5.6% higher than last month, and were 27.9% lower than November 2009.
 According to the NAR, inventory decreased to 3.71 million in November from 3.86 million in October. Inventory is not seasonally adjusted and there is a clear seasonal pattern with inventory peaking in the summer and declining in the fall. Although inventory decreased from October to November, inventory increased 5.4% YoY in November.
The year-over-year increase in inventory is especially bad news because the reported inventory is very high (3.71 million), and the 9.5 months of supply in November is well above normal.
The bottom line: Sales were weak in November, and existing home sales will continue to be weak for some time. Inventory is very high, and the year-over-year increase in inventory is very concerning. The high level of inventory will continue to put downward pressure on house prices.
• New Home Sales weak in November
 This graph shows New Home Sales vs. recessions since 1963. The dashed line is the current sales rate.
The Census Bureau reported New Home Sales in November were at a seasonally adjusted annual rate (SAAR) of 290 thousand. This is up from a revised 275 thousand in October.
 Months of supply decreased to 8.2 in November from 8.8 in October. The all time record was 12.4 months of supply in January 2009. This is still high (less than 6 months supply is normal).
The 290 thousand annual sales rate for November is just above the all time record low in August (274 thousand). This was the weakest November on record and below the consensus forecast of 300 thousand. This was another very weak report.
• AIA: Architecture Billings Index showed expansion in November
Note: This index is a leading indicator for new Commercial Real Estate (CRE) investment.
 This graph shows the Architecture Billings Index since 1996.
From the American Institute of Architects: Firm Billings Rebound in November. "At 52.0, the AIA’s Architecture Billings Index (ABI) recorded a three point gain from the previous month, and reached its strongest level since December 2007."
According to the AIA, there is an "approximate nine to twelve month lag time between architecture billings and construction spending" on non-residential construction. So this indicator suggests the drag from CRE investment will end next summer.
• Moody's: Commercial Real Estate Prices increased in October
Moody's reported this week that the Moody’s/REAL All Property Type Aggregate Index increased 1.3% in October. Note: Moody's CRE price index is a repeat sales index like Case-Shiller - but there are far fewer commercial sales - and that can impact prices and make the index very volatile.
Below is a comparison of the Moodys/REAL Commercial Property Price Index (CPPI) and the Case-Shiller composite 20 index. Beware of the "Real" in the title - this index is not inflation adjusted.
 CRE prices only go back to December 2000. The Case-Shiller Composite 20 residential index is in blue (with Dec 2000 set to 1.0 to line up the indexes).
According to Moody's, CRE prices are about 42% below the peak in 2007.
It is important to remember that the number of transactions is very low and there are a large percentage of distressed sales.
• Other Economic Stories ...
• From Reuters: Fitch cuts Portugal rating one notch on debt levels
• From Bloomberg: Hungary's Credit Rating Cut by Fitch on Budget; Debt Grade Nears `Abyss'
• From John Carney at CNBC: Bank of America Loses Key Battle In Mortgage Fraud Fight
• From the American Trucking Association: ATA Truck Tonnage Index Fell 0.1 Percent in November
• DOT: Vehicle miles driven increased in October
• From Tom Lawler: Overall Housing Stock Growth Likely to Slow Even Further in 2011
Best wishes to all!
Saturday, December 25, 2010
Schedule for Week of December 26th
by Calculated Risk on 12/25/2010 02:45:00 PM
This will be a light week for economic news. The Case-Shiller house price index will be released on Tuesday, and several regional manufacturing surveys will be released during the week.
10:30 AM: Dallas Fed Manufacturing Survey for December. The Texas survey showed expansion last month (at 13.1), and is expected to show expansion again in December.
The regional Fed surveys provide a hint about the ISM manufacturing index, as the following graph shows. Both the Philly Fed, and Empire State indexes showed improvement in December.
 Click on graph for larger image in graph gallery.
The New York and Philly Fed surveys are averaged together (dashed green, through December), and averaged five Fed surveys (blue, through November) including New York, Philly, Richmond, Dallas and Kansas City. The Institute for Supply Management (ISM) PMI (red) is through November (right axis).
The ISM manufacturing index will released on Monday, Jan 3, 2011.
9:00 AM: S&P/Case-Shiller Home Price Index for October. Although this is the October report, it is really a 3 month average of August, September and October. The consensus is for prices to decline about 0.4% in October; the fourth straight month of house price declines.
 This graph shows the seasonally adjusted Composite 10 and Composite 20 indices (the Composite 20 was started in January 2000) through September.
Prices are falling again, although still above the lows set in early 2009.
Prices in October might show a year-over-year decline for the composite indexes for the first time since 2009.
10:00 AM: Conference Board's consumer confidence index for December. The consensus is for an increase to 57.4 from 54.1 last month.
10:00 AM: Richmond Fed Survey of Manufacturing Activity for December. The consensus is for a reading of 11 (expansion), a slight increase from 9 last month.
7:00 AM: The Mortgage Bankers Association (MBA) will release the mortgage purchase applications index. This index declined sharply following the expiration of the tax credit, and the index has only recovered slightly since then.
8:30 AM: The initial weekly unemployment claims report will be released. The number of initial claims has been trending down over the last couple of months. The consensus is for the same as last week at 420,000.
9:45 AM: Chicago Purchasing Managers Index for December. The consensus is for the same as in November at 62.5.
10:00 AM: Pending Home Sales Index for November. The consensus is for a 1% increase in contracts signed. It usually takes 45 to 60 days to close, so this will provide an early indication of closings in January.
11:00 AM: Kansas City Fed regional Manufacturing Survey for December. The index was at 14 in November.
Markets will be open on New Year's Eve.
12:00 AM: Happy New Year!
Happy Holidays!
by Calculated Risk on 12/25/2010 08:50:00 AM
Happy Holidays and Merry Christmas to all!
• First some news: From the WSJ: China Raises Rates Amid Inflation Fight
The People's Bank of China said Saturday that effective Sunday, it will raise the one-year yuan lending rate by a quarter of a percentage point to 5.81% from 5.56% ...• For your enjoyment, here are the galleries of most of the graphs I post. The Galleries are grouped by Employment, New Home Sales, Existing Home Sales, Housing (like starts), Manufacturing, GDP, and much more. There are tabs for each gallery at the top.
Clicking on a tab will load a gallery. Then thumbnails will appear below the main graph for all of the graphs in the selected gallery. Clicking on the thumbnails will display each graph. Enjoy!
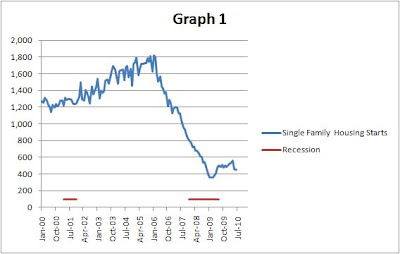
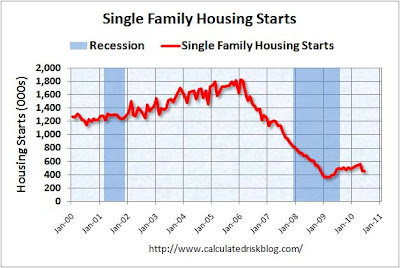
• And a little gift ... a common question, using excel, is how do you get from this:
Thanks to all. Happy Holidays!
Friday, December 24, 2010
Question #8 for 2011: Europe and the Euro
by Calculated Risk on 12/24/2010 06:15:00 PM
Last weekend I posted some questions for next year: Ten Economic Questions for 2011. I'll try to add some predictions, or at least some thoughts for each question - working backwards - before the end of year.
8) Europe and the Euro: What will happen in Europe? When will the next blowup happen? How much of a drag will the problems in Europe have on U.S. growth?
The situation in Europe is fluid. Just look at the bond yields - Greece, Ireland, Portugal, Spain - all near record highs. It seems the question is when, not if, another "blowup" will happen. By blowup, I mean another set of emergency weekend meetings, and another Sunday "bailout" announced.
The European Financial Stability Facility (EFSF) is large enough to handle Portugal, but that is about it. So I guess that means Portugal is next.
Michael Pettis offered some thoughts on 2011, and he focused on Europe: In 2011, the euro zone will hang together or hang separately
DURING 2011 Europe should confront and decide the issue of fiscal union. If it chooses union, the euro will survive. If not, the euro will almost certainly break up. 2011 is important because in most European countries the leaders of all the major political parties tend to be emotionally and ideologically committed to the euro project.So Pettis thinks 2011 is the make or break year for the euro. Either way some countries will probably eventually default (haircuts for the bond holders).
However over the next two to three years as the debate over how to apportion the costs of the necessary adjustments intensifies—should workers pay in the form of wage deflation and rising unemployment? should countries abandon the euro and default, and so force the adjustment costs onto creditors? should taxes be raised or expenditures slashed, and which ones?—the political consensus will break apart and domestic politics will become increasingly unstable. In that case there will be almost no way to avert defaults and currency break up.
Note: Some Investor Guy wrote a great Sovereign Debt Series earlier this year covering a history of defaults and reviewing some possible scenarios.
Although my crystal ball is real cloudy on Europe, I think:
• The euro will somehow survive another year without losing any countries.
• The next blowup will be in the first couple of months. There is another round of stress tests scheduled for February, although there is still no agreement on criteria.
• There are two main channels that could impact the U.S. economy: trade, and financial spillover / credit tightening. The impact on trade will probably be minimal, even if the euro falls sharply against the dollar (a small percentage of U.S. GDP is from exports to Europe (edit)). The financial channel is much more of an unknown, and there is significant downside risk.
Ten Questions:
• Question #1 for 2011: House Prices
• Question #2 for 2011: Residential Investment
• Question #3 for 2011: Delinquencies and Distressed house sales
• Question #4 for 2011: U.S. Economic Growth
• Question #5 for 2011: Employment
• Question #6 for 2011: Unemployment Rate
• Question #7 for 2011: State and Local Governments
• Question #8 for 2011: Europe and the Euro
• Question #9 for 2011: Inflation
• Question #10 for 2011: Monetary Policy
Hotels: RevPAR up 14% compared to same week in 2009
by Calculated Risk on 12/24/2010 02:51:00 PM
A weekly update on hotels from HotelNewsNow.com: STR: US performance for week ending 18 Dec.
In year-over-year measurements, the industry’s occupancy rose 9.4 percent to 46.5 percent, average daily rate increased 4.1 percent to US$91.66, and revenue per available room went up 14.0 percent to US$42.61.The following graph shows the four week moving average for the occupancy rate by week for 2008, 2009 and 2010 (and a median for 2000 through 2007).
 Click on graph for larger image in new window.
Notes: the scale doesn't start at zero to better show the change. The graph shows the 4-week average, not the weekly occupancy rate.
On a 4-week basis, occupancy is up 7.3% compared to last year and 3.3% below the median for 2000 through 2007. RevPAR (revenue per available room) was up 7.7% compared to the same week two years ago (in 2008).
This is the slow season for hotels, and the key will be if business travel picks up early next year.
Data Source: Smith Travel Research, Courtesy of HotelNewsNow.com


