 RSS Feed
 by Calculated Risk on 1/07/2013 10:26:00 AM
Monday, January 07, 2013
Office Vacancy Rate and Office Investment
Earlier this morning I noted that Reis reported the office vacancy rate declined slightly to 17.1% in Q4 from 17.2% in Q3.
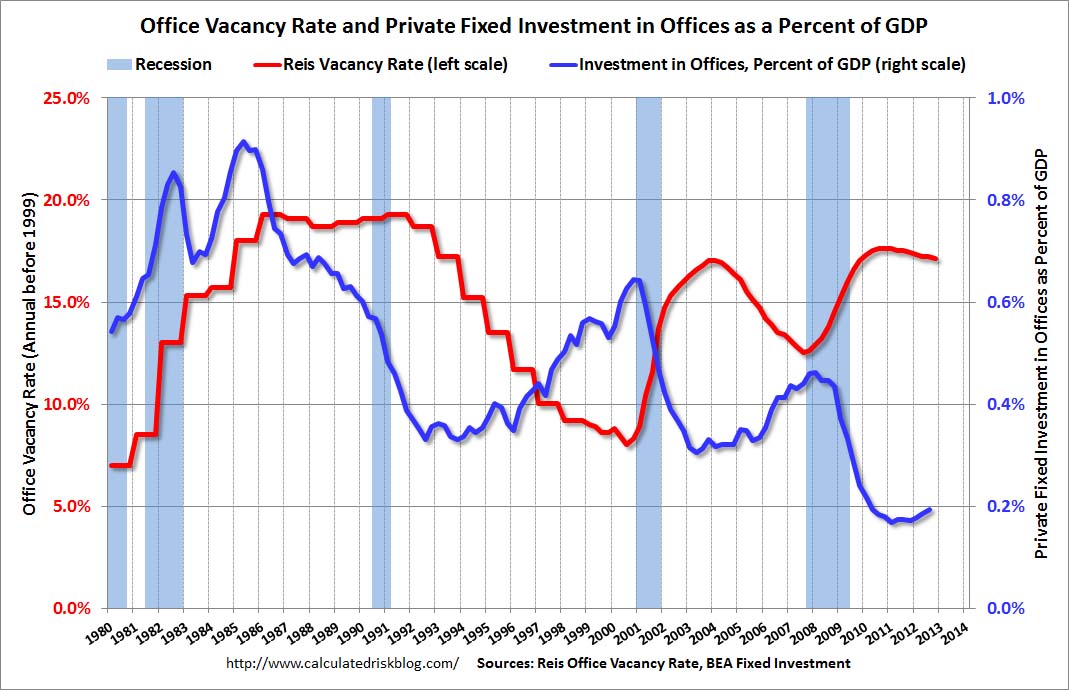
A key question is when will new office investment increase. The answer depends on how quickly the vacancy rate falls. The following graph shows the office vacancy rate and office investment as a percent of GDP. Note: Office investment also includes improvements - and as Reis Senior Economist Ryan Severino noted this morning, there is very little new construction.
Here is Reis Senior Economist Ryan Severino's office forecast for 2013:
"The outlook for 2013 is slightly better than what we experienced in 2012. Although some of the uncertainty over the potential “fiscal cliff” has been resolved, spending decisions still remain and the debt situation in Europe, which oscillates in and out of panic, is still uncertain. Moreover, higher payroll and income taxes are likely to reduce consumption and the government is expected to implement some spending cuts, if not outright sequestration. Nonetheless, job growth is expected to accelerate slightly during 2013 while the unemployment rate is expected to tick marginally lower. Reflecting this moderate improvement, we expect an acceleration in both rent growth and vacancy compression next year, but it is important to keep expectations aligned with reality. And the reality for 2013 is another year of languorous recovery."
 Click on graph for larger image.
This graph shows the office vacancy rate starting in 1980 (prior to 1999 the data is annual). Back in the early '80s, there was overbuilding in the office sector even as the vacancy rate was rising. This was due to the very loose lending that led to the S&L crisis.
In the '90s, office investment picked up as the vacancy rate fell. Following the bursting of the stock bubble, the vacancy rate increased sharply and office investment declined.
During the housing bubble, office investment started to increase even before the vacancy rate had fallen below 14%. This was due to loose lending - again. Investment essentially stopped following the financial crisis.
Like Reis, I expect the office vacancy rate to slowly decline, and I don't expect a significant pickup in new investment until the vacancy rate is close to 14%.
Office vacancy data courtesy of Reis.
Reis: Office Vacancy Rate declines slightly in Q4 to 17.1%
by Calculated Risk on 1/07/2013 08:15:00 AM
Reis released their Q4 Office Vacancy survey this morning. Reis reported that the office vacancy rate declined slightly to 17.1% from 17.2% in Q3.
On absorption from Reis Senior Economist Ryan Severino:
During the fourth quarter 3.691 million square feet were absorbed. This represents a decrease versus the 4.819 million square feet that were absorbed during the third quarter and the 4.842 million square feet that were absorbed during the fourth quarter of 2011. However, this is the eighth consecutive quarter of positive net absorption.On new construction:
3.170 million square feet were delivered during the fourth quarter, versus 3.821 million square feet during the third quarter. This is also a slowdown compared to the 3.653 million square feet of office space that were delivered during the fourth quarter of 2011. For calendar year 2012, 12.025 million square feet were completed. This is a decline from the 15.164 million square feet that were completed during 2011.On rents:
Asking and effective rents both grew by 0.8% during the fourth quarter. This exceeded the third quarter performance when asking and effective rents both grew 0.2%. This was the ninth consecutive quarter that asking and effective rents have increased. This was the strongest performance of both measures since mid‐2008 before the downturn in the office market.
 Click on graph for larger image.
This graph shows the office vacancy rate starting in 1980 (prior to 1999 the data is annual).
Reis is reporting the vacancy rate declined in Q4 to 17.1%, down slightly from 17.2% in Q3, and down from 17.4% in Q4 2011. The vacancy rate peaked in this cycle at 17.6% in Q3 and Q4 2010, and Q1 2011.
As Severino noted, net absorption was still positive, even though demand for office space was low - because there is so little new construction. This remains a sluggish recovery for office space, and new construction will stay low until the vacancy rate falls much further.
Sunday, January 06, 2013
Sunday Night Futures
by Calculated Risk on 1/06/2013 09:18:00 PM
From the NY Times: Deal in Foreclosure Case Is Imminent, Officials Say
A $10 billion settlement to resolve claims of foreclosure abuses by 14 major lenders is expected to be announced as early as Monday, several people with knowledge of the discussions said on Sunday.This agreement ends the foreclosure review process that was apparently not effective. This is an addition to the settlement last year.
The settlement comes after weeks of negotiations between federal regulators and the banks, and covers abuses like flawed paperwork and botched loan modifications ...
An estimated $3.75 billion of the $10 billion is to be distributed in cash relief to Americans who went through foreclosure in 2009 and 2010, these people said. An additional $6 billion is to be directed toward homeowners in danger of losing their homes after falling behind on their monthly payments.
Monday economic release:
• Reis Q4 2012 Office survey of rents and vacancy rates. In Q3 Reis reported the office vacancy rate declined to 17.1%, from 17.2% in Q2. The vacancy rate peaked in this cycle at 17.6% in Q3 and Q4 2010.
Weekend:
• Summary for Week Ending Jan 4th
• Schedule for Week of Jan 6th
• Question #9 for 2013: How much will Residential Investment increase?
• Question #10 for 2013: Europe and the Euro
The Asian markets are mixed tonight; the Shanghai Composite index is up slightly, and the Nikkei is down 0.4%.
From CNBC: Pre-Market Data and Bloomberg futures: the S&P futures are down 2 and DOW futures are down 20.
Oil prices have moved up a recently with WTI futures at $92.97 per barrel and Brent at $111.32 per barrel. Gasoline prices have also increased a little recently.
Question #9 for 2013: How much will Residential Investment increase?
by Calculated Risk on 1/06/2013 06:26:00 PM
Earlier I posted some questions for next year: Ten Economic Questions for 2013. I'll try to add some thoughts, and maybe some predictions for each question.
Note: Here is a review of my 2012 Forecasts
9) Residential Investment: Residential investment (RI) picked up in 2012, with new home sales and housing starts increasing 20% or so. Note: RI is mostly investment in new single family structures, multifamily structures, home improvement and commissions on existing home sales. This still leaves RI at a historical low level. How much will RI increase in 2013?
First a graph of RI as a percent of Gross Domestic Product (GDP) through Q3 2012.
 Click on graph for larger image.
Usually residential investment is a strong contributor to GDP growth and employment in the early stages of a recovery, but not this time - and that weakness was a key reason why the recovery was sluggish so far. Residential investment finally turned positive during 2011 and made a positive contribution to GDP in 2012.
Residential investment as a percent of GDP is just above the record low, and it seems likely that residential investment as a percent of GDP will increase further in 2013.
 The second graph shows total and single family housing starts through November 2012.
Housing starts are on pace to increase about 25% in 2012. And even after the sharp increase last year, the approximately 770 thousand housing starts in 2012 will still be the 4th lowest on an annual basis since the Census Bureau started tracking starts in 1959 (the three lowest years were 2009 through 2011).
Here is a table showing housing starts over the last few years. No one should expect an increase to 2005 levels, however demographics and household formation suggest starts will return to close to the 1.5 million per year average from 1959 through 2000. That means starts will come close to doubling over the next few years from the 2012 level.
| Housing Starts (000s) | ||||
|---|---|---|---|---|
| Total | Change | Single Family | Change | |
| 2005 | 2,068.3 | --- | 1,715.8 | --- |
| 2006 | 1,800.9 | -12.9% | 1,465.4 | -14.6% |
| 2007 | 1,355.0 | -24.8% | 1,046.0 | -28.6% |
| 2008 | 905.5 | -33.2% | 622.0 | -40.5% |
| 2009 | 554.0 | -38.8% | 445.1 | -28.4% |
| 2010 | 586.9 | 5.9% | 471.2 | 5.9% |
| 2011 | 608.8 | 3.7% | 430.6 | -8.6% |
| 20121 | 770.0 | 26% | 535.0 | 24% |
| 12012 estimated | ||||
 The third graph shows New Home Sales since 1963 through November 2012. The dashed line is the current sales rate.
Just like for RI as a percent of GDP, and housing starts, new home sales were up in 2012, but are still near the low historically.
New home sales will still be competing with distressed sales (short sales and foreclosures) in many areas in 2013 - and probably even more foreclosures in some judicial states. Also I've heard some builders might be land constrained in 2013 (not enough finished lots in the pipeline). Both of these factors could slow the growth of residential investment, but I expect another solid year of growth.
Here are some recent forecasts for housing in 2013. I expect growth for new home sales and housing starts in the 20% to 25% range in 2013 compared to 2012. That would still make 2013 the sixth weakest year on record for housing starts (behind 2008 through 2012), and the seventh or eight weakest for new home sales. So I expect further growth in 2014 too.
Here are the ten questions for 2013 and a few predictions:
• Question #1 for 2013: US Fiscal Policy
• Question #2 for 2013: Will the U.S. economy grow in 2013?
• Question #3 for 2013: How many payroll jobs will be added in 2013?
• Question #4 for 2013: What will the unemployment rate be in December 2013?
• Question #5 for 2013: Will the inflation rate rise or fall in 2013?
• Question #6 for 2013: What will happen with Monetary Policy and QE3?
• Question #7 for 2013: What will happen with house prices in 2013?
• Question #8 for 2013: Will Housing inventory bottom in 2013?
• Question #9 for 2013: How much will Residential Investment increase?
• Question #10 for 2013: Europe and the Euro
Question #10 for 2013: Europe and the Euro
by Calculated Risk on 1/06/2013 02:44:00 PM
Earlier I posted some questions for next year: Ten Economic Questions for 2013. I'll try to add some thoughts, and maybe some predictions for each question.
Mostly I focus on the US, but like everyone I've been watching Europe a little more closely over the last few years. Unfortunately the situation in Europe remains grim, with high unemployment - especially in Greece and Spain - and most of the eurozone in recession.
However the crisis has eased a bit. There are several reasons - one key is the the ECB's longer-term refinancing operations (LTROs) that was offered in December 2011. These have a 36 month maturity, and the LTROs have helped lower borrowing costs in Europe.
 Click on graph for larger image in graph gallery.
This graph, from the Atlanta Fed, shows the 10-year bond spreads for a few European countries (this is the difference between the 10-year bond of each country to the 10-year of Germany).
By this measure, the financial crisis has eased recently (the recent agreements with Greece have helped too).
With a Greek deal in place, and Germany's Merkel motivated by the election later this year to keep the eurozone together, and a strong commitment by other policymakers to the euro, I think there is a good chance that the eurozone and the euro will make it through 2013 intact.
Even though I've been pessimistic on Europe (In 2011, I argued that the eurozone was heading into recession), I was less pessimistic than many others. Each of the last two years, I argued the eurozone would stay together (2011: Europe and the Euro and 2012: Europe and the Euro). My guess is the eurozone makes it through another year without losing any countries or a serious collapse. Obviously several countries are near the edge, and the key will be to return to expansion soon.
Note: unless the eurozone "implodes", I don't think Europe poses a large downside risk to the US. If there is a breakup of the euro (something I do not expect in 2013), then the impact on the US could be significant due to financial tightening.
Here are the ten questions for 2013 and a few predictions:
• Question #1 for 2013: US Fiscal Policy
• Question #2 for 2013: Will the U.S. economy grow in 2013?
• Question #3 for 2013: How many payroll jobs will be added in 2013?
• Question #4 for 2013: What will the unemployment rate be in December 2013?
• Question #5 for 2013: Will the inflation rate rise or fall in 2013?
• Question #6 for 2013: What will happen with Monetary Policy and QE3?
• Question #7 for 2013: What will happen with house prices in 2013?
• Question #8 for 2013: Will Housing inventory bottom in 2013?
• Question #9 for 2013: How much will Residential Investment increase?
• Question #10 for 2013: Europe and the Euro


