 RSS Feed
 by Calculated Risk on 10/26/2010 04:00:00 PM
Tuesday, October 26, 2010
Philly Fed September State Coincident Indexes
Earlier posts on Case-Shiller house prices:
 Click on map for larger image.
Here is a map of the three month change in the Philly Fed state coincident indicators. Thirty one states are showing increasing three month activity. The index decreased in 12 states, and was unchanged in 7.
Based on the one month data, this three month activity map be turning even more red next month.
Here is the Philadelphia Fed state coincident index release for September.
In the past month, the indexes increased in 24 states, decreased in 14, and remained unchanged in 12 for a one-month diffusion index of 20. Over the past three months, the indexes increased in 31 states, decreased in 12, and remained unchanged in seven for a three-month diffusion index of 38.
 The second graph is of the monthly Philly Fed data for the number of states with one month increasing activity.
 The indexes increased in 24 states, decreased in 14, and remained unchanged in 12. Note: this graph includes states with minor increases (the Philly Fed lists as unchanged).
A number of states are showing declining activity - and this "recovery" looks very similar to the sluggish recovery following the 2001 recession. No wonder consumer confidence remains very low.
ATA: Truck Tonnage Index increases in September: "Economy barely growing"
by Calculated Risk on 10/26/2010 02:27:00 PM
From the American Trucking Association: ATA Truck Tonnage Index Rose 1.7 Percent in September
The American Trucking Associations’ advance seasonally adjusted (SA) For-Hire Truck Tonnage Index increased 1.7 percent in September after falling a revised 2.8 percent in August. The latest gain put the SA index at 108.7 (2000=100) in September from 106.9 in August.
...
Compared with September 2009, SA tonnage climbed 5.1 percent, which was well above August’s 2.9 percent year-over-year gain. Year-to-date, tonnage is up 6.1 percent compared with the same period in 2009.
ATA Chief Economist Bob Costello said that truck tonnage over the last few months fits with an economy that is growing very slowly. “While I am glad to report that tonnage grew in September, the fact remains that truck freight volumes leveled off over the summer and early autumn. This is a reflection of an economy that is barely growing.”
 Click on map for larger image.
This graph from the ATA shows the Truck Tonnage Index since Jan 2006.
The lines are added to show the index has mostly "leveled off".
Real House Prices, Price-to-Rent Ratio
by Calculated Risk on 10/26/2010 11:45:00 AM
Yesterday CoreLogic reported that house prices declined 1.2% in August, and this morning S&P Case-Shiller reported widespread price declines in August (really an average of June, July and August).
 Click on graph for larger image in new window.
This post looks at real prices and the price-to-rent ratio, but first here is a graph of the two Case-Shiller composite indexes, and the CoreLogic HPI (NSA).
All three indexes are above the lows of early 2009, but it appears that prices are now falling - and I expect all three indexes to show new lows later this year or in early 2011.
Price-to-Rent
In October 2004, Fed economist John Krainer and researcher Chishen Wei wrote a Fed letter on price to rent ratios: House Prices and Fundamental Value. Kainer and Wei presented a price-to-rent ratio using the OFHEO house price index and the Owners' Equivalent Rent (OER) from the BLS.
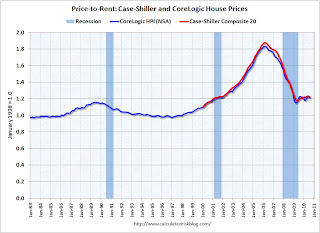 Here is a similar graph through August 2010 using the Case-Shiller Composite 20 and CoreLogic House Price Index.
This graph shows the price to rent ratio (January 1998 = 1.0).
Recent reports suggest rents might have bottomed, but this suggests that house prices are still a little too high on a national basis.
Real House Prices
 The third graph shows the CoreLogic house price index and the Case-Shiller Composite 20 index through August 2010 in real terms (adjusted with CPI less Shelter).
These indexes are still above the 2009 lows in real terms, but it is getting close, and I expect new real price lows sometime in the next few months.
This isn't like in 2005 when prices were way out of the normal range by these measures, but it does appear prices are still a little too high. And with high levels of inventory, prices will probably fall some more.
Case-Shiller: Home Price declines widespread in August
by Calculated Risk on 10/26/2010 09:00:00 AM
S&P/Case-Shiller released the monthly Home Price Indices for August (actually a 3 month average of June, July and August).
This includes prices for 20 individual cities, and two composite indices (10 cities and 20 cities).
Note: Case-Shiller reports NSA, I use the SA data.
From S&P: Home Prices Increases Slow Down in August
Data through August 2010, released today by Standard & Poor’s for its S&P/Case-Shiller1 Home Price Indices, the leading measure of U.S. home prices, show a deceleration in the annual growth rates in 17 of the 20 MSAs and the 10- and 20-City Composites in August compared to what was reported for July 2010. The 10-City Composite was up 2.6% and the 20-City Composite was up 1.7% from their levels in August 2009. Home prices decreased in 15 of the 20 MSAs and both Composites in August from their July levels.
 Click on graph for larger image in new window.
 The first graph shows the nominal seasonally adjusted Composite 10 and Composite 20 indices (the Composite 20 was started in January 2000).
The Composite 10 index is off 29.2% from the peak, and down 0.2% in August(SA).
The Composite 20 index is off 28.8% from the peak, and down 0.3% in August (SA).
 The second graph shows the Year over year change in both indices.
The Composite 10 is up 2.5% compared to August 2009.
The Composite 20 is up 1.7% compared to August 2009.
The year-over-year increases are slowing and will probably be negative later this year.
The third graph shows the price declines from the peak for each city included in S&P/Case-Shiller indices.
 Prices increased (SA) in only 1 of the 20 Case-Shiller cities in August seasonally adjusted. Only New York saw a price increase (SA) in August, and that was very small.
 Prices in Las Vegas are off 57.5% from the peak, and prices in Dallas only off 6.9% from the peak.
Prices are now falling - and falling just about everywhere. And it appears there are more price declines coming (based on inventory levels and anecdotal reports).
Mervyn King Quote: “Banking” and “Crises” are natural bedfellows
by Calculated Risk on 10/26/2010 08:40:00 AM
A quick quote from Bank of England's Mervyn King: “Banking: From Bagehot to Basel, and Back Again”
The words “banking” and “crises” are natural bedfellows. If love and marriage go together like a horse and carriage, then banking and crisis go together like Oxford and the Isis, intertwined for as long as anyone can remember.From the press release:
[T]he Governor of the Bank of England, Mervyn King, outlines the challenges of managing the financial system and suggests a framework for assessing proposals designed to reduce the riskiness inherent in banking and solve the “Too Important to Fail” problem.He discusses several options including the imposition of a permanent tax on banks, higher capital requirements and limits on leverage.
“Change is, I believe, inevitable. The question is only whether we can think our way through to a better outcome before the next generation is damaged by a future and bigger crisis. This crisis has already left a legacy of debt to the next generation. We must not leave them the legacy of a fragile banking system too.”


