 RSS Feed
 by Calculated Risk on 10/26/2010 11:45:00 AM
Tuesday, October 26, 2010
Real House Prices, Price-to-Rent Ratio
Yesterday CoreLogic reported that house prices declined 1.2% in August, and this morning S&P Case-Shiller reported widespread price declines in August (really an average of June, July and August).
 Click on graph for larger image in new window.
This post looks at real prices and the price-to-rent ratio, but first here is a graph of the two Case-Shiller composite indexes, and the CoreLogic HPI (NSA).
All three indexes are above the lows of early 2009, but it appears that prices are now falling - and I expect all three indexes to show new lows later this year or in early 2011.
Price-to-Rent
In October 2004, Fed economist John Krainer and researcher Chishen Wei wrote a Fed letter on price to rent ratios: House Prices and Fundamental Value. Kainer and Wei presented a price-to-rent ratio using the OFHEO house price index and the Owners' Equivalent Rent (OER) from the BLS.
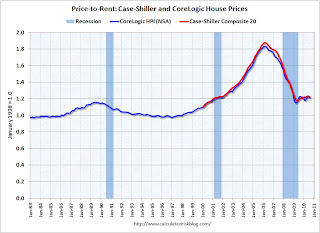 Here is a similar graph through August 2010 using the Case-Shiller Composite 20 and CoreLogic House Price Index.
This graph shows the price to rent ratio (January 1998 = 1.0).
Recent reports suggest rents might have bottomed, but this suggests that house prices are still a little too high on a national basis.
Real House Prices
 The third graph shows the CoreLogic house price index and the Case-Shiller Composite 20 index through August 2010 in real terms (adjusted with CPI less Shelter).
These indexes are still above the 2009 lows in real terms, but it is getting close, and I expect new real price lows sometime in the next few months.
This isn't like in 2005 when prices were way out of the normal range by these measures, but it does appear prices are still a little too high. And with high levels of inventory, prices will probably fall some more.


