 RSS Feed
 by Calculated Risk on 10/14/2010 03:10:00 PM
Thursday, October 14, 2010
Freddie Mac: 30 year Mortgage Rates fall to 4.19 percent, lowest since 1951
From Freddie Mac: 30-Year FRM Under 5 Percent for 23 Consecutive Weeks
Freddie Mac today released the results of its Primary Mortgage Market Survey® (PMMS®), which found that the 30-year fixed-rate mortgage rate fell again to break the survey’s all-time low; the 30-year FRM has been under 5 percent for 23 weeks in a row. The last time 30-year FRM rates were this low was April 1951 (based on a data series of FHA rates going back to 1948). The 5-year ARM tied the all-time survey low set last week.
...
30-year fixed-rate mortgage (FRM) averaged 4.19 percent with an average 0.8 point for the week ending October 14, 2010, down from last week when it averaged 4.27 percent. Last year at this time, the 30-year FRM averaged 4.92 percent.
Hotel Performance: RevPAR up 8.8% compared to same week in 2009
by Calculated Risk on 10/14/2010 12:43:00 PM
Hotel occupancy is one of several industry specific indicators I follow ...
Important: Even though the occupancy rate is close to 2008 levels, 2010 is a much more difficult year for the hotel industry than 2008. RevPAR (revenue per available room) is up 8.8% compared to 2009, but still down 4.1% compared to 2008 - and 2008 was a very difficult year for the hotel industry.
From HotelNewsNow.com: STR: Economy ADR performance falls short
Overall, the industry’s occupancy increased 6.5% to 63.6%, ADR was up 2.2% to US$101.58, and revenue per available room ended the week up 8.8% to US$64.62.The following graph shows the four week moving average for the occupancy rate by week for 2008, 2009 and 2010 (and a median for 2000 through 2007).
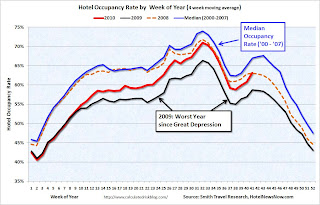 Click on graph for larger image in new window.
Notes: the scale doesn't start at zero to better show the change. The graph shows the 4-week average, not the weekly occupancy rate.
On a 4-week basis, occupancy is up 7.4% compared to last year (the worst year since the Great Depression) and 5.8% below the median for 2000 through 2007.
The occupancy rate is about at the levels of 2008, but RevPAR is still down 4.1%.
Data Source: Smith Travel Research, Courtesy of HotelNewsNow.com
Trade Deficit increases sharply in August
by Calculated Risk on 10/14/2010 09:10:00 AM
The Census Bureau reports:
[T]otal August exports of $153.9 billion and imports of $200.2 billion resulted in a goods and services deficit of $46.3 billion, up from $42.6 billion in July, revised.
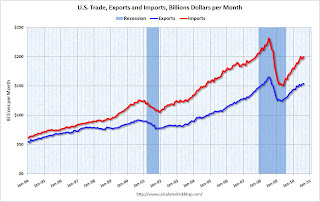 Click on graph for larger image.
The first graph shows the monthly U.S. exports and imports in dollars through August 2010.
After trade bottomed in the first half of 2009, both imports and exports increased significantly. However in 2010 export growth has slowed, and imports have been increasing much faster than exports.
The second graph shows the U.S. trade deficit, with and without petroleum, through August.
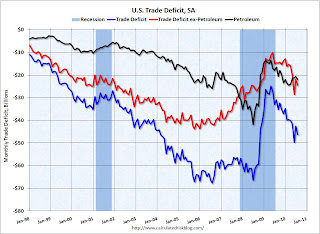 The blue line is the total deficit, and the black line is the petroleum deficit, and the red line is the trade deficit ex-petroleum products.
The increase in the deficit in August was due to both oil and China, although the bulk of the increase was because of trade with China. The trade deficit with China increased to $28.0 billion in August from $25.9 billion in July (NSA).
The imbalances have returned ...
Weekly Initial Unemployment Claims increase to 462,000
by Calculated Risk on 10/14/2010 08:30:00 AM
The DOL reports on weekly unemployment insurance claims:
In the week ending Oct. 9, the advance figure for seasonally adjusted initial claims was 462,000, an increase of 13,000 from the previous week's revised figure of 449,000 [up from 445,000]. The 4-week moving average was 459,000, an increase of 2,250 from the previous week's revised average of 456,750.
 Click on graph for larger image in new window.
This graph shows the 4-week moving average of weekly claims since January 2000.
The dashed line on the graph is the current 4-week average. The four-week average of weekly unemployment claims increased this week by 2,250 to 459,000.
The 4-week moving average has been moving sideways at an elevated level since last December - and that suggests a weak job market.
Note: most revisions have been slightly up over the last year or so. The average revision has been just over 2,000. But if you follow the 4 week moving average (as I do), this would only impact the last data point - and only by about 500. I couldn't see that on the graph! Not a big deal.
Wednesday, October 13, 2010
RealtyTrac: Record Repossessions reported in September
by Calculated Risk on 10/13/2010 11:59:00 PM
From RealtyTrac: Foreclosure Activity Increases 4 Percent in Third Quarter
Foreclosure filings were reported on 347,420 U.S. properties in September, an increase of nearly 3 percent from the previous month and an increase of 1 percent from September 2009. A record total of 102,134 bank repossessions were reported in September, the first time bank repossessions have surpassed the 100,000 mark in a single month.This will slow down in Q4, but will pick up again soon.
“Lenders foreclosed on a record number of properties in September and in the third quarter, taking a bite out of the backlog of distressed properties where the foreclosure process was delayed by foreclosure prevention efforts over the past 20 months,” said James J. Saccacio, chief executive officer of RealtyTrac. “We expect to see a dip in those bank repossessions — and possibly earlier stages of the foreclosure process — in the fourth quarter as several major lenders have halted foreclosure sales in some states while they review irregularities in foreclosure-processing documentation that has been called into question in recent weeks.”


