
 RSS Feed
 by Calculated Risk on 8/20/2010 07:04:00 PM
Friday, August 20, 2010
Bank Failure #114: ShoreBank, Chicago, Illinois
From the FDIC: Urban Partnership Bank, Chicago, Illinois, Assumes All of the Deposits of ShoreBank, Chicago, Illinois
As of June 30, 2010, ShoreBank had approximately $2.16 billion in total assets and $1.54 billion in total deposits. ... The FDIC estimates that the cost to the Deposit Insurance Fund (DIF) will be $367.7 million. ... ShoreBank is the 114th FDIC-insured institution to fail in the nation this year, and the fifteenth in Illinois. The last FDIC-insured institution closed in the state was Palos Bank and Trust Company, Palos Heights, on August 13, 2010.This was no surprise (in the works for some time and rumored this morning). That makes four today ...
Bank Failures #111 to #113: Florida and Virginia
by Calculated Risk on 8/20/2010 06:15:00 PM
From the FDIC: CenterState Bank of Florida, National Association, Winter Haven, Florida, Acquires All the Deposits of Two Banks in Florida
As of June 30, 2010, Community National Bank At Bartow had total assets of $67.9 million and total deposits of $63.7 million; and Independent National Bank had total assets of $156.2 million and total deposits of $141.9 million. ... The FDIC estimates that the cost to the Deposit Insurance Fund (DIF) for Community National Bank At Bartow will be $10.3 million; and for Independent National Bank, $23.2 million. ... These closings bring the total for the year to 112 banks in the nation, and the twenty-first and twenty-second in Florida.From the FDIC: River Community Bank, National Association, Martinsville, Virginia, Assumes All of the Deposits of Imperial Savings and Loan Association, Martinsville, Virginia
As of June 30, 2010, Imperial Savings and Loan Association had approximately $9.4 million in total assets and $10.1 million in total deposits ... The FDIC estimates that the cost to the Deposit Insurance Fund (DIF) will be $3.5 million. ... Imperial Savings and Loan Association is the 113th FDIC-insured institution to fail in the nation this year, and the first in Virginia.
Huge miss coming on Existing Home Sales?
by Calculated Risk on 8/20/2010 03:20:00 PM
MarketWatch is reporting the consensus for July existing home sales is 4.85 million SAAR (seasonally adjusted annual rate).
And from Dow Jones: Week Ahead
"July existing-home sales ... likely declined 4.3% from June"June sales were reported as 5.37 million, so a decline of 4.3% would be 5.14 million SAAR.
Note: July existing home sales will be reported next Tuesday.
Housing economist Tom Lawler's preliminary forecast was 3.95 million SAAR (based on a bottom up analysis).
Many of the regional reports showed sales declines of 20% or more from July 2009 when the NAR reported sales of 5.14 million SAAR. A 20% decline from July 2009 would be in the low 4 millions ...
Maybe the MarketWatch and Dow Jones consensus numbers are incorrect (other numbers will be released later today), or there is probably going to be a big miss next Tuesday. Take the WAY under!
Next week will be VERY busy - I'll have more in the weekly preview on Sunday.
HAMP data for July
by Calculated Risk on 8/20/2010 11:43:00 AM
From Treasury: HAMP Servicer Performance Report Through July 2010
And here is the HUD Housing Scorecard. Click on table for larger image in new window.
About 422 thousand modifications are now "permanent" - up from 389 thousand last month - and 617 thousand trial modifications have been cancelled - up sharply from 521 thousand last month.
According to HAMP, there are 255,934 "active trials", down from 364,077 last month. There is still a large number of borrowers in limbo since only 165 thousand trials were started over the last 5 months. I expect another large number of cancellations in August. The second graph shows the cumulative HAMP trial programs started.
Notice that the pace of new trial modifications has slowed sharply from over 150,000 in September to under 17,00 in July. The program is winding down ...
Debt-to-income ratios
If we look at the HAMP program stats (see page 3), the median front end DTI (debt to income) before modification was 44.8% - the same as last month. And the back end DTI was an astounding 79.7 (about the same as last month).
Think about that for a second: for the median borrower, about 80% of the borrower's income went to servicing debt. And the median is 63.5% after the modification.
These borrowers are still up to their eyeballs in debt after the modification.
Summary:
State Unemployment Rates: Generally unchanged in July
by Calculated Risk on 8/20/2010 10:00:00 AM
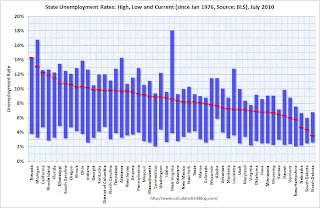 Click on graph for larger image in new window.
This graph shows the high and low unemployment rates for each state (and D.C.) since 1976. The red bar is the current unemployment rate (sorted by the current unemployment rate).
Eleven states now have double digit unemployment rates. A number of other states are close..
Nevada set a new series high at 14.3% and now has the highest state unemployment rate. Michigan held the top spot for over 4 years until May.
From the BLS: Regional and State Employment and Unemployment Summary
Regional and state unemployment rates were little changed in July. Eighteen states and the District of Columbia recorded unemployment rate decreases, 14 states registered rate increases, and 18 states had no change, the U.S. Bureau of Labor Statistics reported today.
...
Nevada again reported the highest unemployment rate among the states, 14.3 percent in July. The rate in Nevada also set a new series high. (All region, division, and state series begin in 1976.) The states with the next highest rates were Michigan, 13.1 percent, and California, 12.3 percent. North Dakota continued to register the lowest jobless rate, 3.6 percent, followed by South Dakota and Nebraska, 4.4 and 4.7 percent, respectively.
emphasis added



