 RSS Feed
 by Calculated Risk on 8/20/2010 10:00:00 AM
Friday, August 20, 2010
State Unemployment Rates: Generally unchanged in July
 Click on graph for larger image in new window.
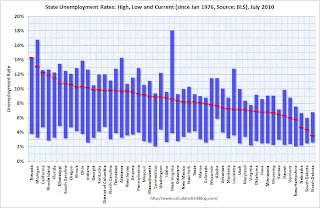
This graph shows the high and low unemployment rates for each state (and D.C.) since 1976. The red bar is the current unemployment rate (sorted by the current unemployment rate).
Eleven states now have double digit unemployment rates. A number of other states are close..
Nevada set a new series high at 14.3% and now has the highest state unemployment rate. Michigan held the top spot for over 4 years until May.
From the BLS: Regional and State Employment and Unemployment Summary
Regional and state unemployment rates were little changed in July. Eighteen states and the District of Columbia recorded unemployment rate decreases, 14 states registered rate increases, and 18 states had no change, the U.S. Bureau of Labor Statistics reported today.
...
Nevada again reported the highest unemployment rate among the states, 14.3 percent in July. The rate in Nevada also set a new series high. (All region, division, and state series begin in 1976.) The states with the next highest rates were Michigan, 13.1 percent, and California, 12.3 percent. North Dakota continued to register the lowest jobless rate, 3.6 percent, followed by South Dakota and Nebraska, 4.4 and 4.7 percent, respectively.
emphasis added


