 RSS Feed
 by Calculated Risk on 5/17/2010 09:50:00 AM
Monday, May 17, 2010
Europe's Woes impacting China
From Keith Bradsher at the NY Times: Europe’s Debt Crisis Is Casting a Shadow Over China
The steep rise of the renminbi prompted a Commerce Ministry official in Beijing to warn Monday that China’s exports could be threatened. ...
“The yuan has risen about 14.5 percent against the euro during the past four months, which will increase cost pressure for Chinese exporters and also have a negative impact on China’s exports to European countries,” Yao Jian, the ministry’s spokesman, said at a news conference in Beijing, according to news services.
...
Because American companies in particular compete in the Chinese market with European companies in many industries, the euro’s weakness against the renminbi is putting American companies at a disadvantage ...
 As I noted a few weeks ago ... keep an eye on the Shanghai index (in red).
 Click on graph for larger image in new window.
This graph shows the Shanghai SSE Composite Index and the S&P 500 (in blue).
The SSE Composite Index is at 2,559.93 - down 5% last night and off almost 20% since early April. This is the lowest level in over a year.
Should we be more concerned about the slowdown in Europe, or the slowdown in China?
NY Fed: Manufacturing Conditions Improve, but at Slower Pace
by Calculated Risk on 5/17/2010 08:32:00 AM
From the NY Fed: Empire State Manufacturing Survey
The Empire State Manufacturing Survey indicates that conditions for New York manufacturers continued to improve for a tenth consecutive month in May, albeit at a slower pace than in April. The general business conditions index fell 13 points, to 19.1. Similarly, the new orders and shipments indexes also moved lower but remained at positive levels. The inventories index dropped back to a level near zero after rising into positive territory in March and April. .... Future indexes suggest that activity is expected to expand further in the months ahead, but the level of optimism was noticeably lower in May than in recent months.This came in below expectations. New orders are softer and the inventory adjustment is over. Manufacturing continued to improve, although at a slower pace in May. This is an early indicator for the national ISM survey that will be released June 1st.
...
The new orders index was also lower, falling 15 points to 14.3. ... The index for number of employees climbed to 22.4, with nearly a third of respondents increasing employment levels in May. The average workweek index fell to zero, following four months of positive readings. .... The future inventories index fell below zero for the first time since October of last year, suggesting that inventory levels were not expected to rise in the coming months.
Sunday, May 16, 2010
Sunday Night Futures
by Calculated Risk on 5/16/2010 10:15:00 PM
The U.S. futures are off tonight:
From CNBC: Pre-Market Data shows the S&P 500 off about 11 points or 1%. Dow futures are off about 100 points.
CBOT mini-sized Dow
And the Asian markets are in the red with most indexes off about 2%.
And a graph of the Asian markets.
The Euro is at 1.23 dollars. Update: more currency exchange rates and from NetDania.
It will be a busy week ...
Best to all.
Libor Increases, Euro Falls
by Calculated Risk on 5/16/2010 04:33:00 PM
Note: here is the Weekly Summary and a Look Ahead (busy week)!
On the Libor and the Euro ...
From the Financial Times: Banks’ debt exposure fuels risk aversion
Concern about the exposure of European banks to the debts of weaker countries in the eurozone is ... increasing the amounts banks charge to lend to each other.The Libor has risen recently, but it is still very low (here is a graph from Bloomberg). The Libor is at 0.45%; the Libor peaked at 4.81875% on Oct 10, 2008.
The London inter-bank offer rate, or Libor, has risen in recent weeks to its highest level since last August ... which is significant because the rate has served as a leading gauge of stress during the financial crisis.
excerpt with permission
The TED spread has increased too, but it is still very low at 30. This is the difference between the interbank rate for three month loans and the three month Treasury. The peak was 463 on Oct 10th and a normal spread is around 50 bps - so this is still below normal.
And from The Times: Euro heads for parity with dollar
THE euro is set to slide further and could be heading for parity with the dollar, analysts say. ... The euro fell to a 19-month low against the dollar of $1.23 on Friday night ...
 Click on graph for larger image in new window.
Update: Oops. Chart was labeled backwards. There are 1.23 dollars per Euro.
The Euro has only been around since Jan 1999. The graph shows the number of dollars per euro since Jan 1, 1999.
There is nothing magical about "parity" except it makes a good headline - and would be a significant decline.
Weekly Summary and a Look Ahead
by Calculated Risk on 5/16/2010 11:59:00 AM
Three housing related reports will be released early this week: the NAHB builder confidence survey on Monday, housing starts on Tuesday, and the MBA Q1 delinquency report on Wednesday. Of course Europe will still be in the spotlight too.
On Monday, the May Empire State manufacturing survey will be released at 8:30 AM. The consensus is for a slight decline from the strong reading in April. Also on Monday, the May NAHB homebuilder survey will be released at 1 PM. The consensus is for a slight increase to 20 from 19 in April.
On Tuesday, Housing Starts for April will be released at 8:30 AM. The consensus is for an increase to 650K (SAAR) in April from 626K in March. Also at 8:30 AM, the BLS will release the Producer Price Index (PPI) for April. The consensus is for an increase of 0.1%. The Census Bureau will also release the Q1 Quarterly Starts and Completions report.
Also on Tuesday, Cleveland Fed President Sandra Pianalto speaks at the Economic Club of Pittsburgh at 12:20 PM , and former Fed Chairman Paul Volcker speaks at Stanford University at 9:45 PM. It was five years ago – at Stanford – that Volcker remarked that “circumstances seem as dangerous and intractable as I can remember" and "homeownership has become a vehicle for borrowing and leveraging as much as a source of financial security". That speech is still worth reading.
On Wednesday, the Q1 MBA delinquency report will be released at 10 AM. The big news last quarter was the decline in 30 day delinquencies, and expectations are for further declines – although long term delinquencies will still be a problem. I’ll be on the conference call at 10:30 AM.
Also on Wednesday, the April Consumer Price Index (CPI) will be released at 8:30 AM. The consensus is for a 0.1% increase in prices. Also the AIA's Architecture Billings Index for April will be released (a leading indicator for commercial real estate). The FOMC minutes for the April meeting will be released at 2 PM.
On Thursday, the closely watched initial weekly unemployment claims will be released. Consensus is for a decline to 440K from 444K last week. Also on Thursday, the Philly Fed survey and the Conference Board's index of leading indicators will both be released at 10 AM.
And on Friday, the BLS will release the Regional and State Employment and Unemployment report for April at 10 AM. And of course the FDIC will probably have another busy Friday afternoon ...
Note: Other reports that will probably be released this week include the Moodys/REAL Commercial Property Price Index (for March), the HAMP April report, DOTs Vehicle Miles Driven for March, and the First American Corelogic distressed sales report for February.
And a summary of last week:
The EU announced a total bailout package of €750 billion (if needed). This story is ongoing ...
1) The EU created a €60 billion fund based on article 122 (special circumstances). The IMF will add €30 billion. Press conference archive here (40 minutes)
2) The EU will create a Special Purpose Vehicle (SPV) for 3 years based on inter government agreements. These are potential loan guarantees backed by all Euro Zone countries. This is in addition to €60 billion and will be up to €440 billion - plus a contribution from the IMF up to half of European Union contribution (up to €220 billion).
3) Both Portugal and Spain announced steps to reduce their deficits.
4) The European Central Bank (ECB) intervened "in the euro area public and private debt securities markets (Securities Markets Programme) to ensure depth and liquidity in those market segments which are dysfunctional."
5) The Federal Reserve reopened swap lines to provide dollar liquidity.
6) Deutsche Bank CEO expressed doubts about Greece
7) ECB's Trichet called this the "most difficult situation" since the World War.
 Click on graph for larger image in new window.
This graph shows the REO inventory for Fannie, Freddie and FHA through Q1 2010.
Even with all the delays in foreclosure, the REO inventory has increased sharply over the last three quarters, from 135,868 at the end of Q2 2009, to 153,007 in Q3 2009, 172,357 at the end of Q4 2009 and now 209,500 at the end of Q4 2010.
These are new records for all three agencies.
Remember this is just a portion of the total REO inventory. Private label securities and banks and thrifts hold an even larger number of REOs.
 On a monthly basis, retail sales increased 0.4% from March to April (seasonally adjusted, after revisions), and sales were up 8.8% from April 2009 (easy comparison).
This graph shows retail sales since 1992. This is monthly retail sales, seasonally adjusted (total and ex-gasoline).
The red line shows retail sales ex-gasoline and shows the increase in final demand ex-gasoline has been sluggish.
Retail sales are up 9.2% from the bottom, but still off 3.6% from the pre-recession peak.
 From the Fed: Industrial production and Capacity Utilization
 This graph shows industrial production since 1967.
This is the highest level for industrial production since Dec 2008, but production is still 9.0% below the pre-recession levels at the end of 2007.
First American CoreLogic released the Q1 2010 negative equity report this week.
 This graph shows the negative equity and near negative equity by state.
 Ten percent or more of homeowners have negative equity in 33 states and the D.C., and over 20% have negative equity or near negative equity in 23 states and D.C. This is a widespread problem.
Note: Louisiana, Maine, Mississippi, South Dakota, Vermont, West Virginia and Wyoming are NA on the graph above.
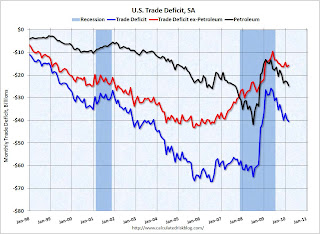 This graph shows the U.S. trade deficit, with and without petroleum, through March.
The blue line is the total deficit, and the black line is the petroleum deficit, and the red line is the trade deficit ex-petroleum products.
Both imports and exports have been increasing sharply, but are still below the pre-financial crisis levels. Once again China and oil are the major contributors to the trade deficit.
Best wishes to all.


