 RSS Feed
 by Calculated Risk on 3/18/2025 09:38:00 AM
Tuesday, March 18, 2025
Newsletter: Housing Starts Increased to 1.501 million Annual Rate in February; Length of Time from Start to Completion Declined in 2024
Today, in the Calculated Risk Real Estate Newsletter: Housing Starts Increased to 1.501 million Annual Rate in February
A brief excerpt:
Total housing starts in February were above expectations; however, starts in December and January were revised down slightly, combined.There is much more in the article.
The third graph shows the month-to-month comparison for total starts between 2024 (blue) and 2025 (red).
Total starts were down 2.9% in February compared to February 2024. Starts bounced back in the Northeast region after being down sharply year-over-year in January (likely weather related).

Industrial Production Increased 0.7% in February
by Calculated Risk on 3/18/2025 09:15:00 AM
From the Fed: Industrial Production and Capacity Utilization
Industrial production (IP) increased 0.7 percent in February after moving up 0.3 percent in January. Manufacturing output rose 0.9 percent, boosted by a jump of 8.5 percent in the index for motor vehicles and parts. The output of manufacturing excluding motor vehicles and parts increased 0.4 percent. The index for mining gained 2.8 percent, and the index for utilities decreased 2.5 percent. At 104.2 percent of its 2017 average, total IP in February was 1.4 percent above its year-earlier level. Capacity utilization stepped up to 78.2 percent, a rate that is 1.4 percentage points below its long-run (1972–2024) average.
emphasis added
 Click on graph for larger image.
This graph shows Capacity Utilization. This series is up from the record low set in April 2020, and close to the level in February 2020 (pre-pandemic).
Capacity utilization at 78.2% is 1.4% below the average from 1972 to 2023. This was above consensus expectations.
Note: y-axis doesn't start at zero to better show the change.
 The second graph shows industrial production since 1967.
Industrial production increased to 104.2. This is above the pre-pandemic level.
Industrial production was above consensus expectations.
Housing Starts Increased to 1.501 million Annual Rate in February
by Calculated Risk on 3/18/2025 08:30:00 AM
From the Census Bureau: Permits, Starts and Completions
Housing Starts:
Privately-owned housing starts in February were at a seasonally adjusted annual rate of 1,501,000. This is 11.2 percent above the revised January estimate of 1,350,000, but is 2.9 percent below the February 2024 rate of 1,546,000. Single-family housing starts in February were at a rate of 1,108,000; this is 11.4 percent above the revised January figure of 995,000. The February rate for units in buildings with five units or more was 370,000.
Building Permits:
Privately-owned housing units authorized by building permits in February were at a seasonally adjusted annual rate of 1,456,000. This is 1.2 percent below the revised January rate of 1,473,000 and is 6.8 percent below the February 2024 rate of 1,563,000. Single-family authorizations in February were at a rate of 992,000; this is 0.2 percent below the revised January figure of 994,000. Authorizations of units in buildings with five units or more were at a rate of 404,000 in February.
emphasis added
 Click on graph for larger image.
The first graph shows single and multi-family housing starts since 2000.
Multi-family starts (blue, 2+ units) increased month-over-month in February. Multi-family starts were down 4.6% year-over-year.
Single-family starts (red) increased in February and were down 2.3% year-over-year.
 The second graph shows single and multi-family housing starts since 1968.
 This shows the huge collapse following the housing bubble, and then the eventual recovery - and the recent collapse and recovery in single-family starts.
Total housing starts in February were above expectations; however, starts in December and January were revised down slightly, combined.
I'll have more later …
Monday, March 17, 2025
Tuesday: Housing Starts, Industrial Production
by Calculated Risk on 3/17/2025 08:55:00 PM
 Note: Mortgage rates are from MortgageNewsDaily.com and are for top tier scenarios.
Tuesday:
• At 8:30 AM ET, Housing Starts for February. The consensus is for 1.383 million SAAR, up from 1.366 million SAAR.
• At 9:15 AM, The Fed will release Industrial Production and Capacity Utilization for February. The consensus is a 0.3% increase in Industrial Production, and for Capacity Utilization to be unchanged at 77.8%.
MBA Survey: Share of Mortgage Loans in Forbearance Decreases to 0.38% in February
by Calculated Risk on 3/17/2025 07:01:00 PM
From the MBA:
Share of Mortgage Loans in Forbearance Decreases Slightly to 0.38% in February
The Mortgage Bankers Association’s (MBA) monthly Loan Monitoring Survey revealed that the total number of loans now in forbearance decreased by 2 basis points from 0.40% of servicers’ portfolio volume in the prior month to 0.38% as of February 28, 2025. According to MBA’s estimate, 190,000 homeowners are in forbearance plans. Mortgage servicers have provided approximately 8.6 million forbearances since March 2020.At the end of February, there were about 190,000 homeowners in forbearance plans.
The share of Fannie Mae and Freddie Mac loans in forbearance decreased 2 basis points to 0.15% in February 2025. Ginnie Mae loans in forbearance decreased by 4 basis points to 0.84%, and the forbearance share for portfolio loans and private-label securities (PLS) decreased 3 basis points to 0.37%.
“Despite February’s monthly decline of loans in forbearance, the estimated number of forbearances and loan workouts increased compared to one year ago,” said Marina Walsh, CMB, MBA’s Vice President of Industry Analysis. “The year-over-year gain may be attributed to increasing escrow payments for taxes and insurance, inflationary pressures, natural disasters, aging servicing portfolios, and a softening in the labor market. At the same time, the performance of loan workouts and overall servicing portfolios weakened compared to one year ago."
...
By reason, 73.0% of borrowers are in forbearance for reasons such as a temporary hardship caused by job loss, death, divorce, or disability. Another 24.2% are in forbearance because of a natural disaster. The remaining 2.8% of borrowers are still in forbearance because of COVID-19.
emphasis added
Lawler: Early Read on Existing Home Sales in February
by Calculated Risk on 3/17/2025 03:30:00 PM
Today, in the Calculated Risk Real Estate Newsletter: Lawler: Early Read on Existing Home Sales in February; Recent Rent Trends at Two Large Publicly Traded Companies in the Single-Family Rental Business
A brief excerpt:
From housing economist Tom Lawler:There is much more in the article.
Based on publicly-available local realtor/MLS reports released across the country through today, I project that existing home sales as estimated by the National Association of Realtors ran at a seasonally adjusted annual rate of 4.21 million in February, up 2.9% from January’s preliminary pace but down 2.6% from last February’s seasonally adjusted pace. Unadjusted sales should show a larger YOY % decline, reflecting this February’s lower business day count relative to last February’s.
3rd Look at Local Housing Markets in February
by Calculated Risk on 3/17/2025 12:41:00 PM
Today, in the Calculated Risk Real Estate Newsletter: 3rd Look at Local Housing Markets in February
A brief excerpt:
The NAR is scheduled to release February Existing Home sales on Thursday, March 20th at 10:00 AM. The consensus is for 3.92 million SAAR, down from 4.08 million in January. Last year, the NAR reported sales in February 2024 at 4.31 million SAAR.There is much more in the article.
NOTE: The tables for active listings, new listings and closed sales all include a comparison to February 2019 for each local market (some 2019 data is not available).
This is the third look at local markets in February. I’m tracking over 40 local housing markets in the US. Some of the 40 markets are states, and some are metropolitan areas. I’ll update these tables throughout the month as additional data is released.
Closed sales in February were mostly for contracts signed in December and January when 30-year mortgage rates averaged 6.72% and 6.96%, respectively (Freddie Mac PMMS). This was an increase from the average rate for homes that closed in January, and up slightly from the average rate of 6.7% in December 2023 and January 2024.
...
Here is a look at months-of-supply using NSA sales. Since this is NSA data, it is likely months-of-supply will increase into the Summer.
Months in red will likely see 6+ months of supply this summer and might see price pressures.
...
More local markets to come!

NAHB: "Builder Confidence Falls on Cost Uncertainty" in March
by Calculated Risk on 3/17/2025 10:00:00 AM
The National Association of Home Builders (NAHB) reported the housing market index (HMI) was at 39, down from 42 last month. Any number below 50 indicates that more builders view sales conditions as poor than good.
From the NAHB: Builder Confidence Falls on Cost Uncertainty
Economic uncertainty, the threat of tariffs and elevated construction costs pushed builder sentiment down in March even as builders express hope that a better regulatory environment will lead to an improving business climate.
Builder confidence in the market for newly built single-family homes was 39 in March, down three points from February and the lowest level in seven months, according to the National Association of Home Builders (NAHB)/Wells Fargo Housing Market Index (HMI) released today.
“Builders continue to face elevated building material costs that are exacerbated by tariff issues, as well as other supply-side challenges that include labor and lot shortages,” said NAHB Chairman Buddy Hughes, a home builder and developer from Lexington, N.C. “At the same time, builders are starting to see relief on the regulatory front to bend the rising cost curve, as demonstrated by the Trump administration's pause of the 2021 IECC building code requirement and move to implement the regulatory definition of ‘waters of the United States’ under the Clean Water Act consistent with the U.S. Supreme Court’s Sackett decision.”
“Construction firms are facing added cost pressures from tariffs,” said NAHB Chief Economist Robert Dietz. “Data from the HMI March survey reveals that builders estimate a typical cost effect from recent tariff actions at $9,200 per home. Uncertainty on policy is also having a negative impact on home buyers and development decisions.”
The latest HMI survey also revealed that 29% of builders cut home prices in March, up from 26% in February. Meanwhile, the average price reduction was 5% in March, the same rate as the previous month. The use of sales incentives was 59% in March, unchanged from February.
...
The HMI index gauging current sales conditions fell three points to 43 in March, its lowest point since December 2023. The gauge charting traffic of prospective buyers dropped five points to 24 while the component measuring sales expectations in the next six months held steady at 47.
Looking at the three-month moving averages for regional HMI scores, the Northeast fell three points in March to 54, the Midwest moved three points lower to 42, the South dropped four points to 42 and the West posted a two-point decline to 37.
emphasis added
 Click on graph for larger image.
This graph shows the NAHB index since Jan 1985.
This was below the consensus forecast.
Retail Sales Increased 0.2% in February
by Calculated Risk on 3/17/2025 08:30:00 AM
On a monthly basis, retail sales increased 0.2% from January to February (seasonally adjusted), and sales were up 3.1 percent from February 2024.
From the Census Bureau report:
Advance estimates of U.S. retail and food services sales for February 2025, adjusted for seasonal variation and holiday and trading-day differences, but not for price changes, were $722.7 billion, up 0.2 percent from the previous month, and up 3.1 percent from February 2024. ... The December 2024 to January 2025 percent change was revised from down 0.9 percent to down 1.2 percent.
emphasis added
 Click on graph for larger image.
This graph shows retail sales since 1992. This is monthly retail sales and food service, seasonally adjusted (total and ex-gasoline).
Retail sales ex-gasoline was up 0.3% in February.
The second graph shows the year-over-year change in retail sales and food service (ex-gasoline) since 1993.
Retail and Food service sales, ex-gasoline, increased by 3.4% on a YoY basis.
 The change in sales in February were well below expectations, and sales in December and January were revised down, combined.
Housing March 17th Weekly Update: Inventory up 2.1% Week-over-week, Up 29.3% Year-over-year
by Calculated Risk on 3/17/2025 08:01:00 AM
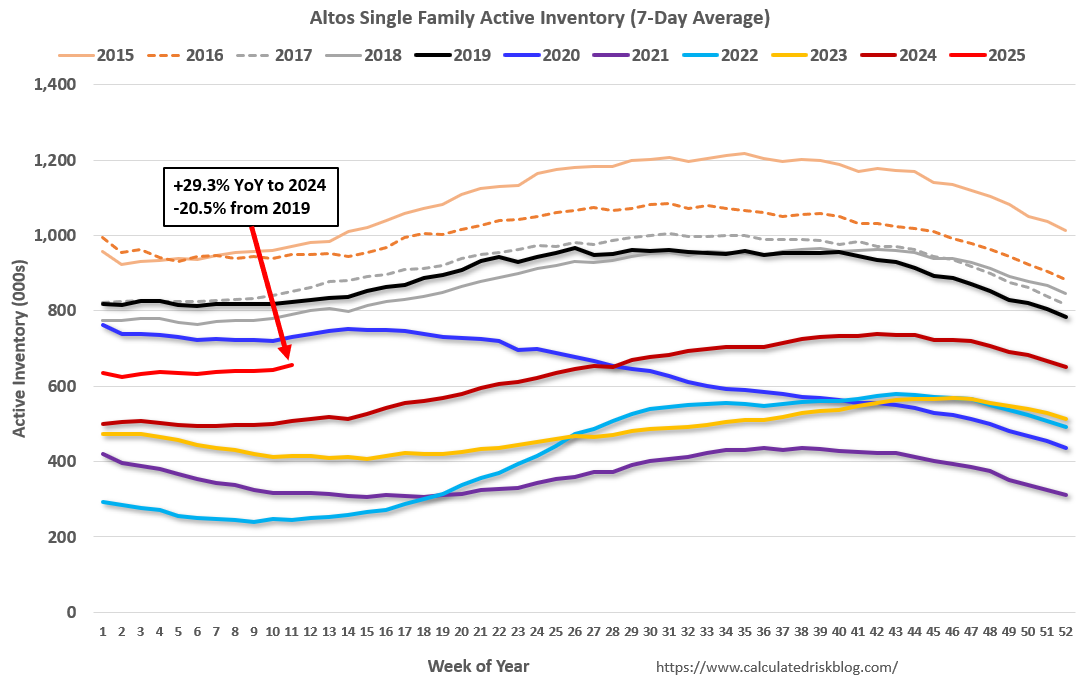
Altos reports that active single-family inventory was up 2.1% week-over-week.
Inventory is now up 5.0% from the seasonal bottom nine weeks ago in January and us starting to increase seasonally.
The first graph shows the seasonal pattern for active single-family inventory since 2015.
 Click on graph for larger image.
The red line is for 2025. The black line is for 2019.
Inventory was up 29.3% compared to the same week in 2024 (last week it was up 28.3%), and down 20.5% compared to the same week in 2019 (last week it was down 21.4%).
The gap to more normal inventory levels has closed significantly!
 This second inventory graph is courtesy of Altos Research.
As of March 14th, inventory was at 656 thousand (7-day average), compared to 642 thousand the prior week.
Mike Simonsen discusses this data regularly on Youtube
Sunday, March 16, 2025
Monday: Retail Sales, NY Fed Mfg, Homebuilder Survey
by Calculated Risk on 3/16/2025 06:29:00 PM
Weekend:
• Schedule for Week of March 16, 2025
• FOMC Preview
Monday:
• At 8:30 AM ET, Retail sales for February is scheduled to be released. The consensus is for a 0.7% increase in retail sales.
• Also at 8:30 AM, The New York Fed Empire State manufacturing survey for March. The consensus is for a reading of -2.0, down from 5.7.
• At 10:00 AM, The March NAHB homebuilder survey. The consensus is for a reading of 43, up from 42. Any number below 50 indicates that more builders view sales conditions as poor than good.
• Also at 10:00 AM, State Employment and Unemployment (Monthly) for January 2025
From CNBC: Pre-Market Data and Bloomberg futures S&P 500 are down 20 and DOW futures are down 123 (fair value).
Oil prices were unchanged over the last week with WTI futures at $67.18 per barrel and Brent at $70.58 per barrel. A year ago, WTI was at $82, and Brent was at $85 - so WTI oil prices are down about 18% year-over-year.
Here is a graph from Gasbuddy.com for nationwide gasoline prices. Nationally prices are at $3.02 per gallon. A year ago, prices were at $3.45 per gallon, so gasoline prices are down $0.43 year-over-year.
FOMC Preview: No Change to Fed Funds Rate
by Calculated Risk on 3/16/2025 09:56:00 AM
Most analysts expect no change to FOMC policy at the meeting this week, keeping the target range at 4 1/4 to 4 1/2 percent. Market participants currently expect the FOMC to be on hold at the March and May meetings, with the next rate cut in June, and another cut later in the year.
From BofA:
The March FOMC meeting will likely be all about policy uncertainty. The Fed will almost certainly stay on hold, emphasizing patience over panic. QT will likely be paused. Markets could interpret the Fed’s message as hawkish because they are focused on downside risks to activity. But in our view, the “Powell put” is not forthcoming. The SEP forecasts and distribution of risks are both likely to reflect stagflation: weaker growth and higher inflation. The dot plot should still show two cuts in ’25 and ’26.
emphasis added
Projections will be released at this meeting. For review, here are the December projections.
The BEA's second estimate for Q4 GDP showed real growth at 2.3% annualized. That put real growth in 2024, Q4 over Q4, at 2.5% - at the top end of the December FOMC projections. It appears growth will slow in Q1 2025, and it seems likely 2025 GDP will be revised down.
| GDP projections of Federal Reserve Governors and Reserve Bank presidents, Change in Real GDP1 | ||||
|---|---|---|---|---|
| Projection Date | 2024 | 2025 | 2026 | 2027 |
| Dec 2024 | 2.4 to 2.5 | 1.8 to 2.2 | 1.9 to 2.1 | 1.8 to 2.0 |
| Sept 2024 | 1.9 to 2.1 | 1.8 to 2.2 | 1.9 to 2.3 | 1.8 to 2.1 |
The unemployment rate was at 4.1% in February.
| Unemployment projections of Federal Reserve Governors and Reserve Bank presidents, Unemployment Rate2 | ||||
|---|---|---|---|---|
| Projection Date | 2024 | 2025 | 2026 | 2027 |
| Dec 2024 | 4.2 | 4.2 to 4.5 | 4.1 to 4.4 | 4.0 to 4.4 |
| Sept 2024 | 4.3 to 4.4 | 4.2 to 4.5 | 4.0 to 4.4 | 4.0 to 4.4 |
As of January 2025, PCE inflation increased 2.5 percent year-over-year (YoY). The projections for Q4 2025 PCE inflation might be revised up.
| Inflation projections of Federal Reserve Governors and Reserve Bank presidents, PCE Inflation1 | ||||
|---|---|---|---|---|
| Projection Date | 2024 | 2025 | 2026 | 2027 |
| Dec 2024 | 2.4 to 2.5 | 2.3 to 2.6 | 2.0-2.2 | 2.0 |
| Sept 2024 | 2.2 to 2.4 | 2.1 to 2.2 | 2.0 | 2.0 |
PCE core inflation increased 2.6 percent YoY in January and is expected to be up 2.7 percent YoY in February. The projections for core PCE inflation Q4 2025 might be revised up.
| Core Inflation projections of Federal Reserve Governors and Reserve Bank presidents, Core Inflation1 | ||||
|---|---|---|---|---|
| Projection Date | 2024 | 2025 | 2026 | 2027 |
| Dec 2024 | 2.8 to 2.9 | 2.5 to 2.7 | 2.0-2.3 | 2.0 |
| Sept 2024 | 2.6 to 2.7 | 2.1 to 2.3 | 2.0 | 2.0 |
Saturday, March 15, 2025
Real Estate Newsletter Articles this Week:
by Calculated Risk on 3/15/2025 02:11:00 PM
At the Calculated Risk Real Estate Newsletter this week:
 Click on graph for larger image.
• The "Home ATM" Mostly Closed in Q4
• Q4 Update: Delinquencies, Foreclosures and REO
• Part 1: Current State of the Housing Market; Overview for mid-March 2025
• Part 2: Current State of the Housing Market; Overview for mid-March 2025
• 2nd Look at Local Housing Markets in February
This is usually published 4 to 6 times a week and provides more in-depth analysis of the housing market.
Schedule for Week of March 16, 2025
by Calculated Risk on 3/15/2025 08:11:00 AM
The key reports this week are February Retail sales, Housing Starts and Existing Home Sales.
The FOMC meets this week, and no change to policy is expected.
For manufacturing, the February Industrial Production report and the March NY and Philly Fed manufacturing surveys will be released.
 8:30 AM: Retail sales for February is scheduled to be released. The consensus is for a 0.7% increase in retail sales.
This graph shows retail sales since 1992. This is monthly retail sales and food service, seasonally adjusted (total and ex-gasoline).
8:30 AM: The New York Fed Empire State manufacturing survey for March. The consensus is for a reading of -2.0, down from 5.7.
10:00 AM: The March NAHB homebuilder survey. The consensus is for a reading of 43, up from 42. Any number below 50 indicates that more builders view sales conditions as poor than good.
10:00 AM: State Employment and Unemployment (Monthly) for January 2025
 8:30 AM: Housing Starts for February.
 This graph shows single and multi-family housing starts since 1968.
The consensus is for 1.383 million SAAR, up from 1.366 million SAAR.
 9:15 AM: The Fed will release Industrial Production and Capacity Utilization for February.
This graph shows industrial production since 1967.
The consensus is a 0.3% increase in Industrial Production, and for Capacity Utilization to be unchanged at 77.8%.
7:00 AM ET: The Mortgage Bankers Association (MBA) will release the results for the mortgage purchase applications index.
During the day: The AIA's Architecture Billings Index for February (a leading indicator for commercial real estate).
2:00 PM: FOMC Meeting Announcement. No change to policy is expected at this meeting.
2:00 PM: FOMC Projections. This will include the Federal Open Market Committee (FOMC) participants' projections of the appropriate target federal funds rate along with updated economic projections.
2:30 PM: Fed Chair Jerome Powell holds a press briefing following the FOMC announcement.
8:30 AM: The initial weekly unemployment claims report will be released. The consensus is for 224 initial claims up from 220 thousand last week.
8:30 AM: the Philly Fed manufacturing survey for March. The consensus is for a reading of 12.0, down from 18.0.
 10:00 AM: Existing Home Sales for February from the National Association of Realtors (NAR). The consensus is for 3.92 million SAAR, down from 4.08 million.
The graph shows existing home sales from 1994 through the report last month.
No major economic releases scheduled.
Friday, March 14, 2025
March 14th COVID Update: COVID Deaths Declining
by Calculated Risk on 3/14/2025 07:15:00 PM
 Note: Mortgage rates are from MortgageNewsDaily.com and are for top tier scenarios.
For deaths, I'm currently using 4 weeks ago for "now", since the most recent three weeks will be revised significantly.
Note: "Effective May 1, 2024, hospitals are no longer required to report COVID-19 hospital admissions, hospital capacity, or hospital occupancy data." So, I'm no longer tracking hospitalizations.
| COVID Metrics | ||||
|---|---|---|---|---|
| Now | Week Ago | Goal | ||
| Deaths per Week | 673 | 765 | ≤3501 | |
| 1my goals to stop weekly posts. 🚩 Increasing number weekly for Deaths. ✅ Goal met. | ||||
 Click on graph for larger image.
This graph shows the weekly (columns) number of deaths reported since Jan 2023.
Although weekly deaths met the original goal to stop posting in June 2023 (low of 314 deaths), I've continued to post since deaths are above the goal again - and I'll continue to post until weekly deaths are once again below the goal.
Weekly deaths are now decreasing following the winter pickup and only double the low last year.
 This appears to be a leading indicator for COVID hospitalizations and deaths. This has moving down recently, but still double the low of last May.
Nationally COVID in wastewater is "Low", down from "High" four weeks ago, according to the CDC.
Q1 GDP Tracking: Wide Range
by Calculated Risk on 3/14/2025 11:36:00 AM
From BofA:
Our 1Q GDP tracking remains unchanged at 1.9% q/q saar and our 4Q GDP tracking is down two tenths to 2.3% q/q saar since our last weekly publication. [Mar 14th]From Goldman:
emphasis added
We lowered our Q1 GDP tracking estimate by 0.3pp to +1.3% last week. [Mar 10th estimate]
 Atlanta Fed Economist Patrick Higgins put out a special note For GDP Forecasters, Some Gold Doesn't Glitter
 We generally take a hands-off approach in updating and distributing our GDPNow model forecasts. With one exception, once a forecast quarter begins, the code of the model does not change. Any tweaks to the model are made at the beginning of the subsequent quarter.The next update for GDPNow will be on March 17th. Currently the gold adjusted GDP tracking is 0.4% for Q1.
The one exception was in spring 2020, when changes were made so that some monthly indicators showing steep declines early in the COVID-19 pandemic wouldn’t be treated as outliers and ignored as they normally would.
While not on that level, the unusual widening of the January trade deficit that led to much of GDPNow’s sharp decline on February 28, and the circumstances surrounding that decline, was also unprecedented in one respect. That is, as we now know from the March 6 full international trade report—but could only strongly suspect based on anecdotal and non-US government data until then—much of the widening of the trade deficit in January was due to an increase in nonmonetary gold imports from $13.2 billion in December to $32.6 billion in January. This accounted for nearly 60 percent of the widening of the goods trade deficit.
Although GDPNow does not distinguish gold from other imports, the Bureau of Economic Analysis does, in tallying up the total of the net exports, subaggregate within GDP. Removing gold from imports and exports leads to an increase in both GDPNow’s topline growth forecast and the contribution of net exports to that forecast, of about 2 percentage points. The topline growth forecasts also increased today—standard model -2.4 percent to -1.6 percent, “gold adjusted” model -0.4 percent to 0.4 percent—as data from today’s labor market report came in stronger than the model was expecting based on the limited February data the model received prior to that release.
The attached forecast tables include both the standard GDPNow forecast and the gold adjusted forecast. We will continue to update the standard GDPNow model through at least the end of the quarter but will add at least some occasional updates from the gold adjusted version as well.
Q4 Update: Delinquencies, Foreclosures and REO
by Calculated Risk on 3/14/2025 08:28:00 AM
Today, in the Calculated Risk Real Estate Newsletter: Q4 Update: Delinquencies, Foreclosures and REO
A brief excerpt:
This entire housing cycle I’ve argued that we would NOT see a surge in foreclosures that would significantly impact house prices (as happened following the housing bubble) for two key reasons: 1) mortgage lending has been solid, and 2) most homeowners have substantial equity in their homes.There is much more in the article.
...
This graph shows the nominal dollar value of Residential REO for FDIC insured institutions based on the Q4 FDIC Quarterly Banking Profile released this week. Note: The FDIC reports the dollar value and not the total number of REOs.
The dollar value of 1-4 family residential Real Estate Owned (REOs, foreclosure houses) was increased 6% YOY from $747 million in Q4 2023 to $790 million in Q4 2024. This is still historically extremely low.

Thursday, March 13, 2025
Realtor.com Reports Active Inventory Up 27.8% YoY
by Calculated Risk on 3/13/2025 07:41:00 PM
What this means: On a weekly basis, Realtor.com reports the year-over-year change in active inventory and new listings. On a monthly basis, they report total inventory. For February, Realtor.com reported inventory was up 27.5% YoY, but still down 22.9% compared to the 2017 to 2019 same month levels.
Now - on a weekly basis - inventory is up 27.8% YoY.
Realtor.com has monthly and weekly data on the existing home market. Here is their weekly report: Weekly Housing Trends View—Data for Week Ending March 8, 2025 Here is a graph of the year-over-year change in inventory according to realtor.com.
Inventory was up year-over-year for the 70th consecutive week.
Realtor.com has monthly and weekly data on the existing home market. Here is their weekly report: Weekly Housing Trends View—Data for Week Ending March 8, 2025
• Active inventory increased, with for-sale homes 27.8% above year-ago levels
The number of homes for sale has now been higher than the previous year for 70 consecutive weeks. This continued rise in active inventory is in part due to less active buyers. With more choices available, buyers can afford to be more selective, putting pressure on sellers to price competitively.
• New listings—a measure of sellers putting homes up for sale—increased 8.3%
Newly listed inventory grew for the ninth consecutive week, signaling that sellers are gaining confidence in listing their homes despite persistently high mortgage rates. This week’s annual growth picked up compared to last week’s rather tepid measure.
 Here is a graph of the year-over-year change in inventory according to realtor.com.
 Inventory was up year-over-year for the 70th consecutive week.
New listings have increased recently but remain below typical pre-pandemic levels.
Hotels: Occupancy Rate Decreased 1.4% Year-over-year
by Calculated Risk on 3/13/2025 03:55:00 PM
This will be something to watch. The Top 3 countries for tourist visits to the US in 2023 were:
1) Canada 31% in 2023
2) Mexico 22% in 2023
3) UK 6% in 2023
And it appears there has been a sharp decline in Canadians traveling to the U.S. United Airlines CEO noted that their weaker outlook is due to a drop in traffic:
“We've already started the process of where that capacity is coming out. A lot of it transborder, big drop in Canadian traffic to go into the U.S.”.This could impact hotel occupancy in the U.S.
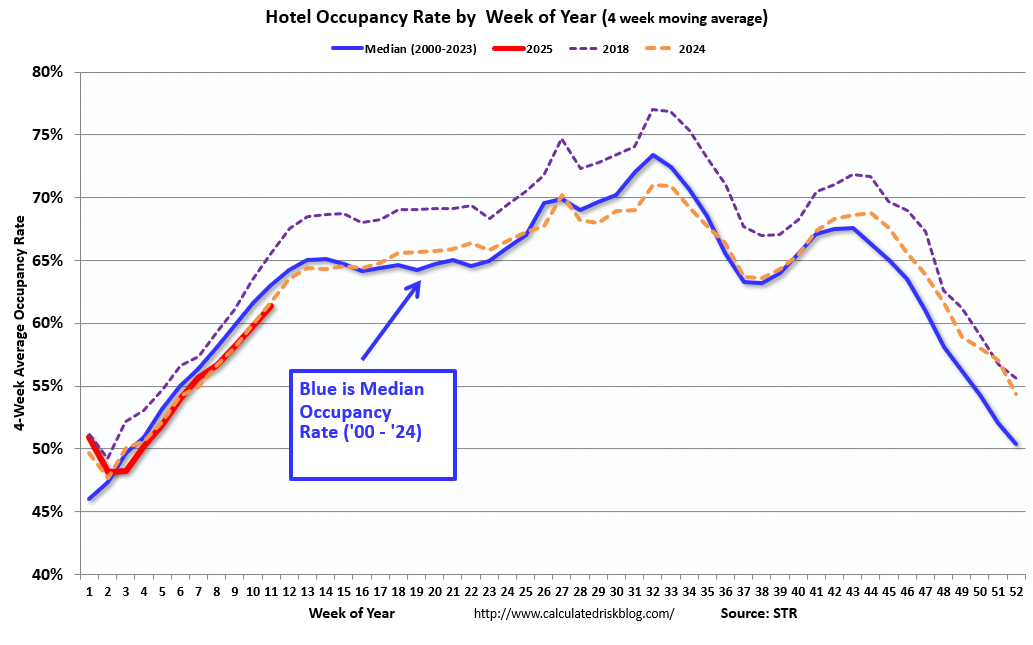
The U.S. hotel industry reported mixed year-over-year comparisons, according to CoStar’s latest data through 8 March. ...The following graph shows the seasonal pattern for the hotel occupancy rate using the four-week average.
2-8 March 2025 (percentage change from comparable week in 2024):
• Occupancy: 62.4% (-1.4%)
• Average daily rate (ADR): US$160.53 (+2.1%)
• Revenue per available room (RevPAR): US$100.11 (+0.6%)
emphasis added
 Click on graph for larger image.
The red line is for 2025, blue is the median, and dashed light blue is for 2024. Dashed purple is for 2018, the record year for hotel occupancy.
The 4-week average of the occupancy rate is tracking last year and is lower than the median rate for the period 2000 through 2024 (Blue).
Note: Y-axis doesn't start at zero to better show the seasonal change.
The 4-week average will increase seasonally for the next several weeks.
The "Home ATM" Mostly Closed in Q4
by Calculated Risk on 3/13/2025 12:55:00 PM
Today, in the Calculated Risk Real Estate Newsletter: The "Home ATM" Mostly Closed in Q4
A brief excerpt:
During the housing bubble, many homeowners borrowed heavily against their perceived home equity - jokingly calling it the “Home ATM” - and this contributed to the subsequent housing bust, since so many homeowners had negative equity in their homes when house prices declined.
...
Here is the quarterly increase in mortgage debt from the Federal Reserve’s Financial Accounts of the United States - Z.1 (sometimes called the Flow of Funds report) released today. In the mid ‘00s, there was a large increase in mortgage debt associated with the housing bubble.
In Q4 2024, mortgage debt increased $100 billion, down from $105 billion in Q3, and down from the cycle peak of $459 billion in Q2 2021. Note the almost 7 years of declining mortgage debt as distressed sales (foreclosures and short sales) wiped out a significant amount of debt.
However, some of this debt is being used to increase the housing stock (purchase new homes), so this isn’t all Mortgage Equity Withdrawal (MEW).


