 RSS Feed
 by Calculated Risk on 1/26/2025 12:01:00 PM
Sunday, January 26, 2025
FOMC Preview: No Change to Policy
Most analysts expect no change to FOMC policy at the meeting this week, keeping the target range at 4 1/4 to 4 1/2 percent. Market participants currently expect the FOMC to be on hold at the January, March and May meetings, with the next rate cut in May.
From BofA:
We expect the Fed to stay on hold at its January meeting. The focus will be on the March decision and the Trump agenda. Powell is likely to retain maximal optionality by continuing to stress data dependence and insist that the Fed will not pre-judge or preempt policy.From Goldman:
emphasis added
The January FOMC meeting is unlikely to offer much new information. The statement might note that the labor market appears to have stabilized but is unlikely to provide strong guidance about the March meeting or the timeline for further cuts. ... Our baseline forecast calls for two 25bp cuts this year in June and December and one more in 2026 because we expect inflation to keep falling and do not expect tariffs to restrain the FOMC indefinitely.
Projections will not be released at this meeting. For review, here are the December projections.
The BEA's third estimate for Q3 GDP showed real growth at 3.1% annualized, following 3.0% annualized real growth in Q2, and 1.6% in Q1. Current estimates for Q4 GDP are around 2.6%. That would put real growth in 2024, Q4 over Q4, at 2.6% - above the top end of the December FOMC projections.
| GDP projections of Federal Reserve Governors and Reserve Bank presidents, Change in Real GDP1 | ||||
|---|---|---|---|---|
| Projection Date | 2024 | 2025 | 2026 | 2027 |
| Dec 2024 | 2.4 to 2.5 | 1.8 to 2.2 | 1.9 to 2.1 | 1.8 to 2.0 |
| Sept 2024 | 1.9 to 2.1 | 1.8 to 2.2 | 1.9 to 2.3 | 1.8 to 2.1 |
The unemployment rate was at 4.1% in December and average 4.15% for Q4.
| Unemployment projections of Federal Reserve Governors and Reserve Bank presidents, Unemployment Rate2 | ||||
|---|---|---|---|---|
| Projection Date | 2024 | 2025 | 2026 | 2027 |
| Dec 2024 | 4.2 | 4.2 to 4.5 | 4.1 to 4.4 | 4.0 to 4.4 |
| Sept 2024 | 4.3 to 4.4 | 4.2 to 4.5 | 4.0 to 4.4 | 4.0 to 4.4 |
As of November 2024, PCE inflation increased 2.4 percent year-over-year (YoY). PCE inflation is expected to increase to 2.5% YoY in the December report. This is in the December projection range.
| Inflation projections of Federal Reserve Governors and Reserve Bank presidents, PCE Inflation1 | ||||
|---|---|---|---|---|
| Projection Date | 2024 | 2025 | 2026 | 2027 |
| Dec 2024 | 2.4 to 2.5 | 2.3 to 2.6 | 2.0-2.2 | 2.0 |
| Sept 2024 | 2.2 to 2.4 | 2.1 to 2.2 | 2.0 | 2.0 |
PCE core inflation increased 2.8 percent YoY in November. Core PCE inflation is expected to increase 2.8% YoY in the December report. This is in the range of FOMC projections for Q4.
| Core Inflation projections of Federal Reserve Governors and Reserve Bank presidents, Core Inflation1 | ||||
|---|---|---|---|---|
| Projection Date | 2024 | 2025 | 2026 | 2027 |
| Dec 2024 | 2.8 to 2.9 | 2.5 to 2.7 | 2.0-2.3 | 2.0 |
| Sept 2024 | 2.6 to 2.7 | 2.1 to 2.3 | 2.0 | 2.0 |
Saturday, January 25, 2025
January 25th COVID Update: COVID in Wastewater Decreasing
by Calculated Risk on 1/25/2025 11:31:00 PM
 Note: Mortgage rates are from MortgageNewsDaily.com and are for top tier scenarios.
SPECIAL NOTE: The CDC has stopped releasing health data (hopefully temporarily).
For deaths, I'm currently using 4 weeks ago for "now", since the most recent three weeks will be revised significantly.
Note: "Effective May 1, 2024, hospitals are no longer required to report COVID-19 hospital admissions, hospital capacity, or hospital occupancy data." So I'm no longer tracking hospitalizations.
| COVID Metrics | ||||
|---|---|---|---|---|
| Now | Week Ago | Goal | ||
| Deaths per Week | 518 | 524 | ≤3501 | |
| 1my goals to stop weekly posts. 🚩 Increasing number weekly for Deaths. ✅ Goal met. | ||||
 Click on graph for larger image.
This graph shows the weekly (columns) number of deaths reported since Jan 2020.
Although weekly deaths met the original goal to stop posting, I'm continuing to post now that deaths are above the goal again - and at a minimum, I'll continue to post through the Winter.
Weekly deaths have mostly been declining, however weekly deaths are still above the low of 313 in early June 2024.
 This appears to be a leading indicator for COVID hospitalizations and deaths.
Nationally COVID in wastewater is "Moderate" according to the CDC but is now declining.
Real Estate Newsletter Articles this Week: Existing-Home Sales Increased to 4.24 million SAAR in December
by Calculated Risk on 1/25/2025 02:11:00 PM
At the Calculated Risk Real Estate Newsletter this week:
 Click on graph for larger image.
• NAR: Existing-Home Sales Increased to 4.24 million SAAR in December
• NMHC on Apartments: "Looser market conditions for the tenth consecutive quarter
• 1.73 million Total Housing Completions in 2024 including Manufactured Homes; Most Since 2006
• 4th Look at Local Housing Markets in December
• 3rd Look at Local Housing Markets in December
This is usually published 4 to 6 times a week and provides more in-depth analysis of the housing market.
Schedule for Week of January 26, 2025
by Calculated Risk on 1/25/2025 08:11:00 AM
The key reports scheduled for this week are the advance estimate of Q4 GDP, December New Home sales, December Personal Income and Outlays and November Case-Shiller house prices.
The FOMC meets this week, and no change to policy is expected.
8:30 AM: Chicago Fed National Activity Index for December. This is a composite index of other data.
 10:00 AM: New Home Sales for December from the Census Bureau.
 This graph shows New Home Sales since 1963.
The dashed line is the sales rate for last month.
The consensus is for 670 thousand SAAR, up from 664 thousand in November.
10:30 AM: Dallas Fed Survey of Manufacturing Activity for January.
8:30 AM: Durable Goods Orders for December. The consensus is for a 0.8% increase in durable goods.
9:00 AM: FHFA House Price Index for November. This was originally a GSE only repeat sales, however there is also an expanded index.
 9:00 AM ET: S&P/Case-Shiller House Price Index for November.
This graph shows the Year over year change in the nominal seasonally adjusted National Index, Composite 10 and Composite 20 indexes through the most recent report (the Composite 20 was started in January 2000).
The National Index was up 3.6% YoY in October and is expected to be up about the same in November.
10:00 AM: Richmond Fed Survey of Manufacturing Activity for January. This is the last of the regional Fed manufacturing surveys for January.
10:00 AM: State Employment and Unemployment (Monthly) for December 2024
7:00 AM ET: The Mortgage Bankers Association (MBA) will release the mortgage purchase applications index.
2:00 PM: FOMC Meeting Announcement. No change to policy is expected.
2:30 PM: Fed Chair Jerome Powell holds a press briefing following the FOMC announcement.
8:30 AM: Gross Domestic Product, 4th quarter and Year 2024 (Advance estimate). The consensus is that real GDP increased 2.6% annualized in Q4.
8:30 AM: The initial weekly unemployment claims report will be released. The consensus is for a increase to 228 thousand from 223 thousand last week.
10:00 AM: Pending Home Sales Index for December. The consensus is for a 1.0% decrease in the index.
8:30 AM ET: Personal Income and Outlays for December. The consensus is for a 0.4% increase in personal income, and for a 0.5% increase in personal spending. And for the Core PCE price index to increase 0.2%. PCE prices are expected to be up 2.5% YoY, and core PCE prices up 2.8% YoY.
9:45 AM: Chicago Purchasing Managers Index for January. The consensus is for a reading of 39.7, up from 36.9 in December.
Friday, January 24, 2025
Q4 GDP Tracking: 2.3% to 3.0% Range
by Calculated Risk on 1/24/2025 05:10:00 PM
From BofA:
Since our last weekly publication, our 4Q GDP tracking estimate has moved up two-tenths to 2.3% q/q saar. [Jan 24th estimate]From Goldman:
emphasis added
We left our Q4 GDP tracking and domestic final sales estimates unchanged, each at +2.6% (quarter-over-quarter annualized). [Jan 24th estimate]And from the Atlanta Fed: GDPNow
The GDPNow model estimate for real GDP growth (seasonally adjusted annual rate) in the fourth quarter of 2024 is 3.0 percent on January 17, unchanged from January 16 after rounding. [Jan 17th estimate]
January Vehicle Forecast: Sales Decline to 15.6 million SAAR, Up 4% YoY
by Calculated Risk on 1/24/2025 02:11:00 PM
From WardsAuto: Some Letdown but January U.S. Light-Vehicle Sales Continue Q4-2024's Growth (pay content). Brief excerpt:
While demand in the middle of the month was negatively impacted by extreme weather conditions across most of the country, with a week remaining in January there is upside to the outlook. On the flipside, there could be pause among some consumers, as they wait to see how the apparent revamping of federal policies and institutions by the new administration plays out. Regardless, sales are tracking to their fourth straight increase in January.
emphasis added
 Click on graph for larger image.
This graph shows actual sales from the BEA (Blue), and Wards forecast for January (Red).
On a seasonally adjusted annual rate basis, the Wards forecast of 15.6 million SAAR, would be down 7.1% from last month, and up 3.8% from a year ago.
Newsletter: Existing-Home Sales Increased to 4.24 million SAAR in December
by Calculated Risk on 1/24/2025 10:49:00 AM
Today, in the CalculatedRisk Real Estate Newsletter: NAR: Existing-Home Sales Increased to 4.24 million SAAR in December
Excerpt:
Sales in December (4.24 million SAAR) were up 2.2% from the previous month and were 9.3% above the December 2023 sales rate. This was the third consecutive month with a year-over-year increase after declining YoY every month for over 3 years.There is much more in the article.
...
Sales Year-over-Year and Not Seasonally Adjusted (NSA)
The fourth graph shows existing home sales by month for 2023 and 2024.
Sales increased 9.3% year-over-year compared to December 2023. On an annual basis, existing home sales were at 4.06 million in 2024, down from 4.09 million in 2023, and the lowest level since 1995.

NAR: Existing-Home Sales Increased to 4.24 million SAAR in December
by Calculated Risk on 1/24/2025 10:00:00 AM
From the NAR: Existing-Home Sales Ascended 2.2% in December
Existing-home sales climbed in December, according to the National Association of Realtors®. Sales advanced in three major U.S. regions and slipped in the Midwest. Year-over-year, sales accelerated in all four regions.
On an annual basis, existing-home sales (4.06 million) declined to the lowest level since 1995, while the median price reached a record high of $407,500 in 2024.
Total existing-home sales – completed transactions that include single-family homes, townhomes, condominiums and co-ops – elevated 2.2% from November to a seasonally adjusted annual rate of 4.24 million in December. Year-over-year, sales swelled 9.3% (up from 3.88 million in December 2023).
...
Total housing inventory registered at the end of December was 1.15 million units, down 13.5% from November but up 16.2% from one year ago (990,000). Unsold inventory sits at a 3.3-month supply at the current sales pace, down from 3.8 months in November but up from 3.1 months in December 2023.
emphasis added
Click on graph for larger image.This graph shows existing home sales, on a Seasonally Adjusted Annual Rate (SAAR) basis since 1994.
Sales in December (4.24 million SAAR) were up 2.2% from the previous month and were 9.3% above the December 2023 sales rate. This was the third consecutive year-over-year increase after declining YoY every month for over 3 years.
The second graph shows nationwide inventory for existing homes.
 According to the NAR, inventory decreased to 1.15 million in December from 1.33 million the previous month.
 According to the NAR, inventory decreased to 1.15 million in December from 1.33 million the previous month.
Headline inventory is not seasonally adjusted, and inventory usually decreases to the seasonal lows in December and January, and peaks in mid-to-late summer.
The last graph shows the year-over-year (YoY) change in reported existing home inventory and months-of-supply. Since inventory is not seasonally adjusted, it really helps to look at the YoY change. Note: Months-of-supply is based on the seasonally adjusted sales and not seasonally adjusted inventory.
 Inventory was up 16.2% year-over-year (blue) in December compared to December 2023.
Months of supply (red) decreased to 3.3 months in December from 3.8 months the previous month.
The sales rate was above the consensus forecast. I'll have more later.
The last graph shows the year-over-year (YoY) change in reported existing home inventory and months-of-supply. Since inventory is not seasonally adjusted, it really helps to look at the YoY change. Note: Months-of-supply is based on the seasonally adjusted sales and not seasonally adjusted inventory.
 Inventory was up 16.2% year-over-year (blue) in December compared to December 2023.
 Months of supply (red) decreased to 3.3 months in December from 3.8 months the previous month.
The sales rate was above the consensus forecast. I'll have more later.
LA Ports: Inbound Traffic Increased Sharply Year-over-year in December
by Calculated Risk on 1/24/2025 08:11:00 AM
Container traffic gives us an idea about the volume of goods being exported and imported - and usually some hints about the trade report since LA area ports handle about 40% of the nation's container port traffic.
The following graphs are for inbound and outbound traffic at the ports of Los Angeles and Long Beach in TEUs (TEUs: 20-foot equivalent units or 20-foot-long cargo container).
To remove the strong seasonal component for inbound traffic, the first graph shows the rolling 12-month average.
 Click on graph for larger image.
On a rolling 12-month basis, inbound traffic increased 1.7% in December compared to the rolling 12 months ending in November. Outbound traffic decreased 0.5% compared to the rolling 12 months ending the previous month.
The 2nd graph is the monthly data (with a strong seasonal pattern for imports).
 Usually imports peak in the July to October period as retailers import goods for the Christmas holiday and then decline sharply and bottom in the Winter depending on the timing of the Chinese New Year.
 Usually imports peak in the July to October period as retailers import goods for the Christmas holiday and then decline sharply and bottom in the Winter depending on the timing of the Chinese New Year.
 Imports were up 24% YoY in December, and exports were down 6% YoY.
This was a very strong July through December period as importers were likely stockpiling goods prior to the increase in tariffs.
Thursday, January 23, 2025
Friday: Existing Home Sales
by Calculated Risk on 1/23/2025 08:49:00 PM
 Note: Mortgage rates are from MortgageNewsDaily.com and are for top tier scenarios.
Friday:
• At 10:00 AM ET, Existing Home Sales for December from the National Association of Realtors (NAR). The consensus is for 4.20 million SAAR, up from 4.15 million.
• Also at 10:00 AM, University of Michigan's Consumer sentiment index (Preliminary for January).
Realtor.com Reports Active Inventory Up 25.1% YoY
by Calculated Risk on 1/23/2025 03:51:00 PM
What this means: On a weekly basis, Realtor.com reports the year-over-year change in active inventory and new listings. On a monthly basis, they report total inventory. For December, Realtor.com reported inventory was up 22.0% YoY, but still down 15.7% compared to the 2017 to 2019 same month levels.
Now - on a weekly basis - inventory is up 25.1% YoY.
Realtor.com has monthly and weekly data on the existing home market. Here is their weekly report: Weekly Housing Trends View—Data for Week Ending January 18, 2025 Here is a graph of the year-over-year change in inventory according to realtor.com.
Inventory was up year-over-year for the 63rd consecutive week.
Realtor.com has monthly and weekly data on the existing home market. Here is their weekly report: Weekly Housing Trends View—Data for Week Ending January 18, 2025
• Active inventory increased, with for-sale homes 25.1% above year-ago levels.
For the 63rd consecutive week, the number of homes for sale has increased compared to the same time last year. However, the week’s growth was near levels seen throughout the winter, showing a narrower gap between current and previous year listings compared to last summer.
• New listings–a measure of sellers putting homes up for sale–increased 17.9%.
New listing activity can be bumpy around the holidays as homeowners turn their attention to the season’s festivities. This week brought the highest number of new listings to the market since October suggesting that sellers are ready to get into the market this year. The past two weeks have brought the most new listings so far this winter, getting the year started with a jolt of housing activity.
 Here is a graph of the year-over-year change in inventory according to realtor.com.
 Inventory was up year-over-year for the 63rd consecutive week.
New listings have jumped recently but remain below typical pre-pandemic levels.
4th Look at Local Housing Markets in December
by Calculated Risk on 1/23/2025 12:29:00 PM
Today, in the Calculated Risk Real Estate Newsletter: 4th Look at Local Housing Markets in December
A brief excerpt:
Here are a few more local markets before the NAR releases December Existing Home sales tomorrow, Friday, January 24th at 10:00 AM. This will be the 3rd consecutive month with a year-over-year increase in sales.There is much more in the article.
Watch the regional difference! Inventory is recovering quicker than sales in some areas (especially Florida and Texas), and this is pushing up months-of-supply - and could lead to some price declines in 2025.
The consensus is for 4.20 million SAAR, up from 4.15 million in November. Last year, the NAR reported sales in December 2023 at 3.88 million SAAR. Housing economist Tom Lawler expects the NAR to report sales of 4.15 million SAAR for December.
...
Here is a look at months-of-supply using NSA sales. Since this is NSA data, it is likely this will be the seasonal low for months-of-supply.
...
Several local markets - like Illinois, Miami, New Jersey and New York - will report after the NAR release.

ICE: Mortgage Delinquency Rate Increased 4% Year-over-year in December
by Calculated Risk on 1/23/2025 11:31:00 AM
• The national delinquency rate eased 2 basis points (bps) to 3.72% in December, but rose 4.0% year over year – the seventh consecutive annual increase – ending 2024 near a three-year high
• Early-stage delinquencies fell 41K (-3.6%) in the month, while serious delinquencies (loans 90+ days past due but not in active foreclosure) continued their slow climb – up 29K (+5.7%) in the month and a fifth consecutive rise year over year
• Foreclosure sales declined by 5K (-5.6%) in December, hitting their lowest level in nearly two years, while foreclosure inventory climbed 7K (+3.8%), but was down -10.7% year-over-year
• Despite rising in December on volatility around the holidays, foreclosure starts averaged 26,800 per month in 2024, down from 28,500 in 2023 and lower than any year outside the pandemic moratoria
• Prepayment activity (measured by single-month mortality or SMM) fell to 0.57% on rising interest rates, down -9.8% in the month but up 47.2% from the same time last year
emphasis added
 Click on graph for larger image.
Here is a table from ICE.
Weekly Initial Unemployment Claims Increase to 223,000
by Calculated Risk on 1/23/2025 08:30:00 AM
The DOL reported:
In the week ending January 18, the advance figure for seasonally adjusted initial claims was 223,000, an increase of 6,000 from the previous week's unrevised level of 217,000. The 4-week moving average was 213,500, an increase of 750 from the previous week's unrevised average of 212,750.The following graph shows the 4-week moving average of weekly claims since 1971.
emphasis added
 Click on graph for larger image.
The dashed line on the graph is the current 4-week average. The four-week average of weekly unemployment claims increased to 213,500.
The previous week was unrevised.
Weekly claims were below the consensus forecast.
Wednesday, January 22, 2025
Thursday: Unemployment Claims
by Calculated Risk on 1/22/2025 07:30:00 PM
 Note: Mortgage rates are from MortgageNewsDaily.com and are for top tier scenarios.
Thursday:
• At 8:30 AM ET, The initial weekly unemployment claims report will be released. The consensus is for a increase to 227 thousand from 217 thousand last week.
• At 11:00 AM, the Kansas City Fed manufacturing survey for January.
NMHC on Apartments: "Looser market conditions for the tenth consecutive quarter"
by Calculated Risk on 1/22/2025 12:16:00 PM
Today, in the CalculatedRisk Real Estate Newsletter: NMHC on Apartments: "Looser market conditions for the tenth consecutive quarter"
Excerpt:
From the NMHC: Apartment Market Experiences Loosening Conditions, Decreased Deal Flow and Less Available Financing to Start the New YearThere is much more in the article.Apartment market conditions declined in the National Multifamily Housing Council’s (NMHC’s) most recent Quarterly Survey of Apartment Market Conditions. All four indices – Market Tightness (40), Sales Volume (41), Equity Financing (48) and Debt Financing (32) – came in below the breakeven level (50), signaling less favorable conditions this quarter.This index has been an excellent leading indicator for rents and vacancy rates, and this suggests higher vacancy rates and a further weakness in asking rents. This is the tenth consecutive quarter with looser conditions than the previous quarter.
...• The Market Tightness Index came in at 40 this quarter – below the breakeven level of 50 – indicating looser market conditions for the tenth consecutive quarter. Slightly over half (52%) of respondents thought market conditions were unchanged relative to three months ago, while a third of respondents thought conditions have become looser. Fourteen percent of respondents reported tighter market conditions than three months prior.

AIA: Architecture Billings "End the year on a weak note"
by Calculated Risk on 1/22/2025 11:26:00 AM
Note: This index is a leading indicator primarily for new Commercial Real Estate (CRE) investment.
From the AIA: ABI December 2024: Business conditions end the year on a weak note
The AIA/Deltek Architecture Billings Index (ABI) score fell to 44.1 for the month as the share of firms reporting a decline in firm billings increased. Firm billings have now decreased for the majority of firms every month except two since October 2022. While not a full-fledged recession, this period of softness and uncertainty has been challenging for many firms. And prospects for future work remain soft as well. Although inquiries into new projects continued to increase at a relatively slow rate, the value of newly signed design contracts decreased further in December as clients remained hesitant to commit to new work. In one brighter spot, backlogs at firms remained steady and strong at 6.5 months in December, so many firms still have work in the pipeline for now.• Northeast (41.7); Midwest (46.4); South (47.2); West (52.2)
Despite overall softness in billings, firms located in the West reported growth for the third consecutive month in December. But business conditions remained soft for firms in all other regions, particularly at firms located in the Northeast, which were the first to report slight growth earlier in the year. Billings also declined at firms of all specializations in December, although firms with an institutional sector are on the cusp of growth and have been for several months. However, business conditions softened further for both firms with multifamily residential and commercial/industrial specializations this month, ending the year on a down note.
...
The ABI score is a leading economic indicator of construction activity, providing an approximately nine-to-twelve-month glimpse into the future of nonresidential construction spending activity. The score is derived from a monthly survey of architecture firms that measures the change in the number of services provided to clients.
emphasis added
• Sector index breakdown: commercial/industrial (44.1); institutional (49.8); multifamily residential (46.5)
 Click on graph for larger image.
This graph shows the Architecture Billings Index since 1996. The index was at 44.1 in November, down from 49.7 in November. Anything below 50 indicates a decrease in demand for architects' services.
This index has indicated contraction for 25 of the last 27 months.
Note: This includes commercial and industrial facilities like hotels and office buildings, multi-family residential, as well as schools, hospitals and other institutions.
This index usually leads CRE investment by 9 to 12 months, so this index suggests a slowdown in CRE investment in 2025.
Note: This includes commercial and industrial facilities like hotels and office buildings, multi-family residential, as well as schools, hospitals and other institutions.
This index usually leads CRE investment by 9 to 12 months, so this index suggests a slowdown in CRE investment in 2025.
In November, we saw the first positive score for multi-family since 2022. However, multi-family billings turned negative again in December and has been negative for 28 of the last 29 months. This suggests we will see further weakness in multi-family starts.
MBA: Mortgage Applications Increased in Weekly Survey
by Calculated Risk on 1/22/2025 07:00:00 AM
From the MBA: Mortgage Applications Increase in Latest MBA Weekly Survey
Mortgage applications increased 0.1 percent from one week earlier, according to data from the Mortgage Bankers Association’s (MBA) Weekly Mortgage Applications Survey for the week ending January 17, 2025.
The Market Composite Index, a measure of mortgage loan application volume, increased 0.1 percent on a seasonally adjusted basis from one week earlier. On an unadjusted basis, the Index increased 3 percent compared with the previous week. The Refinance Index decreased 3 percent from the previous week and was 42 percent higher than the same week one year ago. The seasonally adjusted Purchase Index increased 1 percent from one week earlier. The unadjusted Purchase Index increased 7 percent compared with the previous week and was 2 percent higher than the same week one year ago.
“Mortgage application volume was little changed last week, but there was a small increase in conventional purchase volume, which brought the level of total purchase volume up almost 2 percent above last year at this time,” said Mike Fratantoni, MBA’s SVP and Chief Economist. “Mortgage rates remained near 7 percent, a key psychological level, which likely continues to slow the pace of activity for both refinances and purchases. Incoming economic data are likely to keep the Federal Reserve on hold for now, while uncertainties about economic policy are likely to keep longer-term rates, including mortgage rates, steady at these levels.”
...
The average contract interest rate for 30-year fixed-rate mortgages with conforming loan balances ($766,550 or less) decreased to 7.02 percent from 7.09 percent, with points decreasing to 0.62 from 0.65 (including the origination fee) for 80 percent loan-to-value ratio (LTV) loans. The effective rate decreased from last week.
emphasis added
 Click on graph for larger image.
The first graph shows the MBA mortgage purchase index.
According to the MBA, purchase activity is up 2% year-over-year unadjusted.
Red is a four-week average (blue is weekly).
Purchase application activity is up about 30% from the lows in late October 2023 and is now 8% above the lowest levels during the housing bust.

The second graph shows the refinance index since 1990.
The refinance index is very low.
Tuesday, January 21, 2025
Wednesday: Architecture Billings Index
by Calculated Risk on 1/21/2025 07:24:00 PM
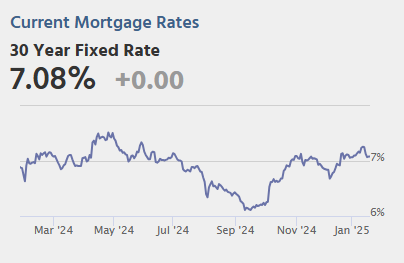 From Matthew Graham at Mortgage News Daily: Mortgage Rates Unimpacted by New Executive Orders
Bonds were thus able to hold onto the gains from last week with some additional improvement today. The average mortgage lender wasn't eager to adjust rates, however, with the top tier 30yr fixed rate remaining unchanged from last Friday. [30 year fixed 7.08%]Wednesday:
emphasis added
• At 7:00 AM ET: The Mortgage Bankers Association (MBA) will release the mortgage purchase applications index.
During the day: The AIA's Architecture Billings Index for December (a leading indicator for commercial real estate).
MBA Survey: Share of Mortgage Loans in Forbearance Decreases to 0.47% in December
by Calculated Risk on 1/21/2025 01:14:00 PM
From the MBA: Share of Mortgage Loans in Forbearance Decreases Slightly to 0.47% in December
The Mortgage Bankers Association’s (MBA) monthly Loan Monitoring Survey revealed that the total number of loans now in forbearance decreased by 3 basis points from 0.50% of servicers’ portfolio volume in the prior month to 0.47% as of December 31, 2024. According to MBA’s estimate, 235,000 homeowners are in forbearance plans. Mortgage servicers have provided forbearance to approximately 8.5 million borrowers since March 2020.
The share of Fannie Mae and Freddie Mac loans in forbearance decreased 2 basis points to 0.19% in December 2024. Ginnie Mae loans in forbearance decreased by 4 basis points to 1.07%, and the forbearance share for portfolio loans and private-label securities (PLS) decreased 2 basis points to 0.40%.
“The overall mortgage forbearance rate decreased slightly in December as some borrowers got back on track following last fall’s severe weather in the Southeast,” said Marina Walsh, CMB, MBA’s Vice President of Industry Analysis. “Even with the slight decrease, the level of forbearance is higher than it was six months ago across all loan types and the performance of servicing portfolios and loan workouts has weakened.”
Added Walsh, “At year end, almost 43% of borrowers in forbearance were there due to a natural disaster. Given the disruption and devastation caused by the California wildfires, that share will likely move higher in the months ahead, as homeowners turn to forbearance to allow time to navigate their recovery process.”
emphasis added
 Click on graph for larger image.
By reason, 54.5% of borrowers are in forbearance for reasons such as a temporary hardship caused by job loss, death, divorce, or disability. Another 42.8% are in forbearance because of a natural disaster. Less than 2.7% of borrowers are still in forbearance because of COVID-19.At the end of December, there were about 235,000 homeowners in forbearance plans.


