 RSS Feed
 by Calculated Risk on 10/13/2010 03:00:00 PM
Wednesday, October 13, 2010
Ceridian-UCLA: Diesel Fuel index declines in September, Flow of goods has "stalled"
This is the new UCLA Anderson Forecast and Ceridian Corporation index using real-time diesel fuel consumption data: Pulse of Commerce IndexTM
 Click on graph for larger image in new window.
This graph shows the index since January 1999.
This is a new index, and doesn't have much of a track record in real time, although the data suggests the recovery has "stalled" since May.
Press Release: Economy Devoid of Momentum: Ceridian-UCLA Pulse of Commerce Index™ Declines for Second Consecutive Month in September
The Ceridian-UCLA Pulse of Commerce Index™ (PCI), a real-time measure of the flow of goods to U.S. factories, retailers, and consumers, fell .5 percent in September after falling 1.0 percent in August, which is the first time the index has experienced a consecutive monthly decline since January 2009. Furthermore, August and September 2010 together produced the worst combined two-month decline since the recessionary months of January and February 2009.I'm not confident in using this index to forecast GDP growth, although it does appear to track Industrial Production over time (with plenty of noise).
The decline indicates four consecutive months of limited to no increases in over the road movement of produce, raw materials, goods-in-process and finished goods since the PCI peaked in May 2010. Moreover, the PCI forecasts GDP growth in the third quarter of 2010 at an anemic 0.7 percent to 1.7 percent, below the PCI’s previous 1.5 to 2.5 percent estimate reported last month (which at the time approximated the consensus economic view). The PCI forecast of the Federal Reserve's monthly Industrial Production (IP) index (to be released later this month) also signals IP growth for September to be very close to zero with an even odds chance for a negative number.
“The PCI tells us that inventory is stalled on the nation’s thoroughfares. The good months of growth are now seemingly in our rear view mirror,” said Ed Leamer, chief PCI economist and director of the UCLA Anderson Forecast. “Our economy’s loss in traction is alarming and for the ‘Cassandras of the double-dip,’ may foretell a coming decline in GDP and spike in unemployment. However, with residential investment, consumer durables, business spending, and other component indicators already at or near record lows relative to GDP, it remains unlikely that we will experience an outright decline into recession.”
...
The Ceridian-UCLA Pulse of Commerce Index™ is based on real-time diesel fuel consumption data for over the road trucking ...
Understanding Lost Note Affidavits (LNAs)
by Calculated Risk on 10/13/2010 02:15:00 PM
First, "Foreclosure-Gate" is primarily about "robo-signers". These are individuals who signed affidavits stating that they had "personal knowledge" of the facts in the case when in fact they did not.
As JPM admitted this morning: "We've identified issues relating to the mortgage foreclosure affidavits and those include signers not having personally reviewed the underlying loan files but instead having relied upon the work of others."
There are also situations of questionable notarization of the affidavits.
Questions reporters might consider asking is what constitutes "personal knowledge" and why can't the affiant sign with "information and belief". Also what are the typical remedies for a false affidavit? But I digress ...
Unfortunately I've seen a number of articles conflating the "robo-signer" scandal with MERS issues and LNAs (Lost Note Affidavits). How many servicers have put a moratorium on foreclosures for these issues? None. But I do hope they are reviewing the entire process.
Fortunately, for those trying to understand LNAs, we have an excellent description of the process from my former co-blogger and mortgage banker Tanta written in early 2008: Lost Note Affidavits & Skeletons in the Closet. A few excerpts:
FCs are routinely filed with either a certified true copy of the promissory note or a Lost Note Affidavit (LNA), which in every instance I have ever personally seen is a sworn statement that the original note is lost, and is accompanied by a certified true copy of the lost original.There is much more in her piece (she was writing about a specific case in Florida).
...
I note for y'all that I have personally executed one or two LNAs in my day, and have therefore had all known hard file folders associated with this loan (the servicing file, the branch's copy, the custodial file, whatever there is), as well as all correspondence with the warehouse bank or custodian or whoever else might have had it brought to my desk, so I could personally root through it all once more before I put my officer's signature on an LNA. In all but one of the LNAs I can remember executing, I had documentation from FedEx or some other shipper that a package had indeed been lost, plus clear documentation in the loan file that this specific note had been included in that specific lost shipment. (My shipping department always put the copy of the airbill in the loan file. Always.) And of course I always had a certified true and correct copy of the note to attach to the affidavit.
I bring all this up because ... not only can original notes be lost or damaged, so can car titles and any other piece of paper. (I have a friend who once had to execute over 100 LNAs after a fire in an adjoining office suite triggered the sprinkler system in her post-closing department. Those LNAs were accompanied by copies of sodden bits of semi-readable paper that had been patched together on the copier plate, one at a time.) A financial institution in the business of making mortgage loans has no business routinely losing or damaging original promissory notes, and any institution that does so should be shut down by the federal regulators and I mean that.
But if consumer attorneys want to create a situation in which the simple fact of loss of or irreparable damage to an original note vacates the debt, I can promise you you will not like the consequences of that. If it turns into Total War here, don't ever lose an original cancelled check. You should know that there is actually one fairly respectable reason for doing FC filings with note copies, besides servicer laziness or loan sale screw-ups: taking your original note out of the custodian's vault to send to some local attorney to attach to a court filing creates several more opportunities for it to get lost. If it becomes a requirement that FC can proceed only with the original note in the courtroom, and the presence of an LNA always means dismissal, then the things are going to have to be handled and shipped and received with the same level of security as a million-dollar bearer bond. Like, a Brink's truck and a bonded courier carrying a briefcase handcuffed to his wrist. You want to pay the cost of that? No. You don't. But you will.
JPM conference call comments on Foreclosure-Gate
by Calculated Risk on 10/13/2010 12:04:00 PM
From the JPM conference call this morning (ht Brian)
JPM: We've identified issues relating to the mortgage foreclosure affidavits and those include signers not having personally reviewed the underlying loan files but instead having relied upon the work of others. Those others, Chase employees, did conduct reviews of the underlying loan files. And there are circumstances where affidavits have not been properly notarized. So I want to just step back and have you understand what the nature of some of the information in this affidavit relates to. They obviously differ by jurisdiction but in general the types of content that we're attesting to includes the name of the borrower, property address, the date, whether or not the borrower was actually defaulted and if they've cured the default and the total amount of indebtedness. As a result of these actions, we're reviewing 115,000, plus or minus, loan files that are currently in the foreclosure process. And we'll do the following based on that review, either refile the affidavits where appropriate. As you know, we delayed our foreclosure sales and so to the extent we can, we'll reinitiate those when appropriate. And we're also in the process of putting additional processes in place to make sure on a go-forward basis we fulfill all the procedural requirements. ……And just to remind everyone, this is a very lengthy process and so from the initial default to the actual foreclosure sale, for our serviced mortgages, that's on average 14 months. Mortgages in the state of Florida for us, that process is 678 days, in New York it is 792 days, more than two years. And in most, if not all instances, over that period of time no principal or interest payments have been made on the mortgage. So I think we would like to conclude by saying is that we really believe the proper approach and response here is to go loan by loan, file by file, customer by customer, and if mistakes have been made then we need to address them individually which we absolutely will do.
Analyst: I was wondering if you could give us any sense for timing of resolution in terms of reopening these 115,000 cases?
JPM: It's going to take several weeks to go through the files and make sure and correct any errors that are in there. The underlying stuff is all accurate. So that's the key substance. Obviously we know there's a lot of state AGs and we have conversations with them. We're hoping [to get back to] the normal process -- for us, the sooner the better for everybody involved. We don't think there are cases with people have been evicted out of homes where they shouldn't have been. These foreclosures go through multiple process, so we're hoping it will be sooner rather than later and those conversations are starting to take place.
Analyst: And is it fair to assume that at least a fair portion of that litigation reserve that you added to is specifically for this topic within mortgage?
JPM: No, nothing in it for this topic. I think the way you should look at this topic is that we're bearing today $7 billion of charge-offs, foreclosure, repurchase costs, this is ex-reserves. That $7 billion will go up or down based upon the economy and stuff like this. I'm not sure stuff like this is going to dramatically change that number. It may extend it a little bit longer and stuff like that but -- and remember, we have in total, between the repurchased reserves and $11 billion, we have $14 billion of reserves for repurchases or loan losses. Look, the mortgage thing is -- we're halfway through all this. We think we should continue and get done and make sure we do the right thing for the consumers, the investors and the country.
Analyst: And the foreclosure stuff, outside of how it directly may impact you or somebody else, how do you look at the drag it may have on the housing market, kind of the macro impact, what do you think about that?
JPM: Again, I hope -- this is a hope. This is not a knowledge. Is that when people take a deep, sigh breath, go back to the right, look to the substance underlying the files and go back to modifying, foreclosing and doing the right thing, all told, it could be a blip. Talking about three or four weeks it will be a blip in the housing market. If it went on for a long period of time it will have a lot of consequences, most of which would be adverse on everybody.
Analyst: The foreclosure suspension, it's a matter of weeks instead of months, did I hear you say that?
JPM: No. I didn't say weeks to clean up the files. We actually have to have little in depth conversations with regulators and AGs and stuff like that. So I don't know exactly when. I'm hopeful that it all starts to move at one point. I don't know if it's going to be three weeks or five. But I think it will be a real shame if we don't get this resolved and moving again.
Analyst: In all likelihood you should be allowed to foreclose as we go into next year.
JPM: I hope so. It's not up to me.
Refinance Activity and Mortgage Rates
by Calculated Risk on 10/13/2010 10:05:00 AM
Report the MBA reported on the increase in refinance activity:
The Refinance Index increased 21.0 percent from the previous week.
...
“Refinance application volumes are now close to the highest level this year." [said Michael Fratantoni, MBA’s Vice President of Research and Economics].
 Click on graph for larger image in new window.
This graph shows the MBA's refinance index (monthly average) and the the 30 year fixed rate mortgage interest rate and one year ARM rate, from the Freddie Mac Primary Mortgage Market Survey®.
As mortgage rates have fallen, there has been an increase in refinance activity. The peak this year was in late August, although the most recent week was close.
However the level of activity is still well below the previous refinance booms in 2009 or in 2002/2003. It takes lower and lower rates to get people to refi - and many borrowers have insufficient equity (or negative equity) or inadequate income to refi.
With 30 year mortgage rates more than 0.5% below the lows of 2009, we might see another surge in refinance activity (the average contract interest rate for 30-year fixed-rate mortgages last week was at 4.21% according to the MBA). According to the NY Fed's Brian Sack, lowering longer-term borrowing costs for many households is one of the key transmission mechanisms that the Fed is targeting with QE2.
MBA: Mortgage Purchase Activity decreases, Refinance Activity increases sharply
by Calculated Risk on 10/13/2010 07:56:00 AM
The MBA reports: Mortgage Refinance Applications Jump as Rates Continue to Fall in Latest MBA Weekly Survey
The Refinance Index increased 21.0 percent from the previous week. The seasonally adjusted Purchase Index decreased 8.5 percent from one week earlier.
...
“Refinance application volumes are now close to the highest level this year. Purchase activity remains generally weak" ... said [Michael Fratantoni, MBA’s Vice President of Research and Economics].
“Last week saw a big jump in applications for FHA loans to purchase homes. We surmised that this was due to potential buyers wanting to beat the stricter FHA standards that went into effect October 4th. This conjecture was confirmed by the fact that this week FHA applications fell back to a level closer to the average seen over the past four months, ”continued Fratantoni.
...
The average contract interest rate for 30-year fixed-rate mortgages decreased to 4.21 percent from 4.25 percent, with points increasing to 1.02 from 1.00 (including the origination fee) for 80 percent loan-to-value (LTV) ratio loans. The 30-year contract rate is the lowest recorded in the survey, while the previous low was observed last week.
 Click on graph for larger image in new window.
This graph shows the MBA Purchase Index and four week moving average since 1990.
The decrease in purchase activity this week appears to be related to the slight change in FHA standards.
Note that the 30 year contract rate is at another record low of 4.21%.
Bernanke Speech on Friday: A new roadmap for the Fed?
by Calculated Risk on 10/13/2010 12:00:00 AM
On Friday, Fed Chairman Ben Bernanke will speak at the Federal Reserve Bank of Boston Conference "Monetary Policy Objectives and Tools in a Low-Inflation Environment".
Jon Hilsenrath at the WSJ has a preview: Fed Chief Gets Set to Apply Lessons of Japan's History
Mr. Bernanke is preparing for a potentially important policy speech Friday, when he could detail his thinking on the Fed's next steps ... The conference is a reprise of a 1999 conference at which Mr. Bernanke and other academics took Japanese officials to task for failing to get their economy moving.Here is the 1999 paper that Hilsenrath mentions: From Ben Bernanke (1999): Japanese Monetary Policy: A Case of Self-Induced Paralysis?* (via Professor Krugman: Self-induced Paralysis)
There is quite a bit about deflation and monetary policy in his 1999 paper, including arguing for a higher inflation target of 3% to 4%. Bernanke even made some "helicopter drop" comments before his well known speech in 2002: Deflation: Making Sure "It" Doesn't Happen Here
On Friday, Bernanke might discuss possible future steps the Fed could take in addition to buying longer-term Treasury securities.
Tuesday, October 12, 2010
California: Number of Licensed Real Estate Agents declines Sharply
by Calculated Risk on 10/12/2010 08:32:00 PM
From Eric Wolff at the North County Times: Agents flee real estate slump

The ranks of holders of the "sales person" license thinned by 18 percent since the peak, down to 327,341 active licenses in August.Not only are sales down, but so is the percentage commission, also from Eric Wolff: Real estate agents reducing commissions
The number of brokers, who have a larger investment in time and money into the business, also slumped, but by 3 percent to 148,373.
The drop in licensees whacked membership rolls at the California Association of Realtors by 20 percent, pushing their membership to 160,000.
...
"When you go from one to three sales a month to one sale every three or six months, you can't make a living," said Susana Marquez, a San Diego real estate agent.
Lawler: "Early read" on September Existing Home Sales
by Calculated Risk on 10/12/2010 03:55:00 PM
CR Note: This is from housing economist Tom Lawler:
While as always results vary by area, on balance most local realtors/MLS are reporting significant YOY home sales declines for September sales. However, it’s important to remember that last September home sales were “goosed” a bit by the federal home buyer tax credit, which was set to expire at the end of November. Existing home sales ran at an estimated seasonally adjusted annual rate of 5.6 million last September, compared to 5.1 million in August 2009.
While I only have data on a relatively small part of the country, right now I estimate that existing home sales ran at a seasonally adjusted annual rate of about 4.50 million, up almost 9% from the August [2010] pace [of 4.13 million SAAR].
CR Note: This would put the months of supply around 10.3 months in September based on an estimate of 3.85 million for inventory.
Note: It is too soon for any impact on sales from "Foreclosure-Gate".
Existing home sales for September will be released on Monday October 25th at 10 AM ET.
FOMC September Meeting Minutes: "focused on further purchases of longer-term Treasury securities"
by Calculated Risk on 10/12/2010 02:00:00 PM
From the Fed: Minutes of the Federal Open Market Committee
Staff Economic Outlook
In the economic forecast prepared for the September FOMC meeting, the staff lowered its projection for the increase in real economic activity over the second half of 2010. The staff also reduced slightly its forecast of growth next year but continued to anticipate a moderate strengthening of the expansion in 2011 as well as a further pickup in economic growth in 2012. The softer tone of incoming economic data suggested that the underlying level of demand was weaker than projected at the time of the August meeting. Moreover, the outlook for foreign economic activity also appeared a bit weaker. In the medium term, the recovery in economic activity was expected to receive support from accommodative monetary policy, further improvements in financial conditions, and greater household and business confidence. Over the forecast period, the increase in real GDP was projected to be sufficient to slowly reduce economic slack, although resource slack was anticipated to still remain elevated at the end of 2012.
Monetary policy:
Participants discussed the medium-term outlook for monetary policy and issues related to monetary policy implementation. Many participants noted that if economic growth remained too slow to make satisfactory progress toward reducing the unemployment rate or if inflation continued to come in below levels consistent with the FOMC's dual mandate, it would be appropriate to provide additional monetary policy accommodation. However, others thought that additional accommodation would be warranted only if the outlook worsened and the odds of deflation increased materially. Meeting participants discussed several possible approaches to providing additional accommodation but focused primarily on further purchases of longer-term Treasury securities and on possible steps to affect inflation expectations. Participants reviewed the likely benefits and costs associated with a program of purchasing additional longer-term assets--with some noting that the economic benefits could be small in current circumstances--as well as the best means to calibrate and implement such purchases. A number of participants commented on the important role of inflation expectations for monetary policy: With short-term nominal interest rates constrained by the zero bound, a decline in short-term inflation expectations increases short-term real interest rates (that is, the difference between nominal interest rates and expected inflation), thereby damping aggregate demand. Conversely, in such circumstances, an increase in inflation expectations lowers short-term real interest rates, stimulating the economy. Participants noted a number of possible strategies for affecting short-term inflation expectations, including providing more detailed information about the rates of inflation the Committee considered consistent with its dual mandate, targeting a path for the price level rather than the rate of inflation, and targeting a path for the level of nominal GDP. As a general matter, participants felt that any needed policy accommodation would be most effective if enacted within a framework that was clearly communicated to the public. The minutes of FOMC meetings were seen as an important channel for communicating participants' views about monetary policy.That last sentence indicates that the FOMC views the minutes as an important communication tool - and the earlier sentences strongly suggest QE2 will arrive on Nov 3rd and will consist of purchases of longer-term Treasury securities.
This isn't anything new - but it is quite clear. And this was before the recent weak employment report.
Graphs: Small Business Optimism, Hiring and "Biggest Problem"
by Calculated Risk on 10/12/2010 11:02:00 AM
By request, here are a few graphs based on the NFIB press release: Small Business Optimism Index Remains at Recessionary Level
 Click on graph for larger image in new window.
The first graph shows the small business optimism index since 1986. Although the index increased slightly in September, it is still at recessionary level according to NFIB Chief Economist Bill Dunkelberg who said: "The downturn may be officially over, but small business owners have for the most part seen no evidence of it."
 The second graph shows the net hiring plans over the next three months.
Hiring plans have turned negative again. According to NFIB: "Over the next three months, eight percent plan to increase employment (unchanged), and 16 percent plan to reduce their workforce (up three points), yielding a seasonally adjusted net negative three percent of owners planning to create new jobs, down four points from August."
 And the third graph shows the percent of small businesses saying "poor sales" is their biggest problem.
Usually small business owners complain about taxes and regulations (that usually means business is good!), but now their self reported biggest problem is lack of demand.
NFIB: Small Businesses slightly less pessimistic, Hiring plans weaken
by Calculated Risk on 10/12/2010 08:03:00 AM
From NFIB: Small Business Confidence inches up
The Index of Small Business Optimism gained 0.2 points in September, rising to 89.0. The increase is certainly not a significant move, but at least it did not fall. Still, the Index remains in recession territory. The downturn may be officially over, but small business owners have for the most part seen no evidence of it.On employment:
Eleven (11) percent (seasonally adjusted) reported unfilled job openings, unchanged from August and historically very weak. Over the next three months, eight percent plan to increase employment (unchanged), and 16 percent plan to reduce their workforce (up three points), yielding a seasonally adjusted net negative three percent of owners planning to create new jobs, down four points from August, The decline in hiring plans is an unexpected reversal in job creation prospects. Hiring plans continue to underperform the recoveries following previous recessions.On capital spending:
The environment for capital spending is not good. ... A net negative three percent expect business conditions to improve over the next six months, a five point improvement from August, but still more owners expect the economy to weaken than strengthen.Note: Small businesses have a larger percentage of real estate and retail related companies than the overall economy.
And the key problem: Poor sales.
Monday, October 11, 2010
Duy: The Final End of Bretton Woods 2?
by Calculated Risk on 10/11/2010 09:25:00 PM
Tim Duy is deeply concerned: The Final End of Bretton Woods 2?
The inability of global leaders to address global current account imbalances now truly threatens global financial stability. Perhaps this was inevitable - the dollar has not depreciated to a degree commensurate with the financial crisis. Moreover, as the global economy stabilized the old imbalances made a comeback, sucking stimulus from the US economy and leaving US labor markets crippled. The latter prompts the US Federal Reserve to initiate a policy stance that will undoubtedly resonate throughout the globe. As a result we could now be standing witness to the final end of Bretton Woods 2. And a bloody end it may be.There is much more in the piece.
...
Put simply, the Federal Reserve is positioned to declare war on Bretton Woods 2. November 3, 2010. Mark it on your calendars.
...
Consider the enormity of the situation at hand. The Federal Reserve is poised to crank up the printing press for the sake of satisfying their domestic mandate. One mechanism, perhaps the only mechanism, by which we can expect meaningful, sustained reversal from the current set of imbalances is via a significant depreciation of the dollar. The rest of the world appears prepared to fight the Fed because they know no other path.
...
Bottom Line: The time may finally be at hand when the imbalances created by Bretton Woods 2 now tear the system asunder. The collapse is coming via an unexpected channel; rather than originating from abroad, the shock that sets it in motion comes from the inside, a blast of stimulus from the US Federal Reserve. And at the moment, the collapse looks likely to turn disorderly quickly. If the Federal Reserve is committed to quantitative easing, there is no way for the rest of the world to stop to flow of dollars that is already emanating from the US. Yet much of the world does not want to accept the inevitable, and there appears to be no agreement on what comes next. Call me pessimistic, but right now I don't see how this situation gets anything but more ugly
Back in 2005, I discussed Bretton Woods 2 with Brad Setser (Duy excerpts from one of Brad's pieces). I suggested that the housing bubble would collapse, reducing the U.S. demand for overseas goods and that would bring an end to Bretton Woods 2 - and that led me to predict that the trade deficit would decline in 2007 (a very lonely position!). However I didn't expect the imbalances to return so quickly, and that is very concerning. And I hope Tim Duy is wrong about how it ends.
Rail Intermodal Traffic at 2008 levels, Carload Traffic Lags
by Calculated Risk on 10/11/2010 06:06:00 PM
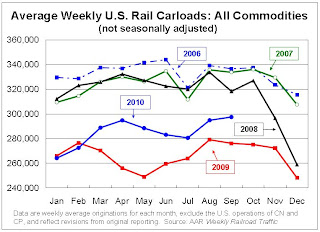
From the Association of American Railroads: Rail Time Indicators. The AAR reports carload traffic in September 2010 was up 7.7% compared to September 2009 - and carload traffic was 7.5% lower than in September 2008. Intermodal traffic (using intermodal or shipping containers) is up up 17.3% over September 2009 and up 0.2% over September 2008.
 Click on graph for larger image in new window.
This graph shows U.S. average weekly rail carloads (NSA). Traffic increased in 16 of 19 major commodity categories year-over-year.
From AAR:
• U.S. freight railroads originated 1,487,511 carloads in September 2010, an average of 297,502 carloads per week. That’s up 7.7% from September 2009 and down 7.5% from September 2008 on a non-seasonally adjusted basis. It’s also the highest weekly average for any month since October 2008.As the graph above shows, rail carload traffic collapsed in November 2008, and now, a year into the recovery, carload traffic has only recovered half way. However ...
• Average unadjusted weekly carloads are typically lower in September than in August because of the Labor Day holiday. This year, though, September’s weekly unadjusted average (297,502) was higher than August’s (294,862). Why? The week with Labor Day was, as usual, one of the lowest-volume weeks of the year, but the other four weeks in September 2010 were all among the six highest-volume weeks of the year. The top two weeks so far in 2010 were in September.
• That explains why seasonally adjusted U.S. rail carloads were up 1.9% in September 2010 over August 2010, reaching their highest level since November 2008.

• U.S. railroads originated 1,165,288 intermodal trailers and containers in September 2010, an average of 233,058 per week on an unadjusted basis. That’s down slightly from August 2010, but that’s just due to Labor Day. The four non-Labor Day weeks in September were four of the top five intermodal weeks so far in 2010. September 2010 intermodal traffic was up 17.3% over September 2009 and up 0.2% over September 2008.The increase in intermodal traffic, along with the increase in West Coast port import traffic, are two of the indicators that suggest retailers might have over-ordered for the holidays. Stephanie Clifford and Catherine Rampell mentioned this possibility in the NY Times article last week: Dim Outlook for Holiday Jobs
• On an unadjusted basis, September is traditionally the second (sometimes third) highest-volume month of the year for intermodal, behind October. Intermodal peaks in the fall as retailers stock up for the holidays.
excerpts with permission
While retailers are just now making plans for Christmas hiring, they had to make plans for Christmas merchandise months ago, and that lag might create some inventory problems.
In the first part of the year, the economic picture looked much brighter. ... That was at about the same time that retailers had to order holiday merchandise because of the time it takes to produce and ship the inventory.
And recent traffic at the nation’s ports suggests that retailers made optimistic bets.
Economic Nobel Prize: Matching "the honored work with the moment"
by Calculated Risk on 10/11/2010 03:22:00 PM
A couple of reviews and explanations of the work of Peter Diamond, Dale Mortensen and Christopher Pissarides ...
From Edward Glaeser at Economix: The Work Behind the Nobel Prize
This year’s Nobel Memorial Prize in Economic Science ... was awarded today to Peter A. Diamond, Dale T. Mortensen and Christopher A. Pissarides for their research on “markets with search frictions,” which means any setting where buyers and sellers don’t automatically find each other. Search models are relevant in many settings, including dating, used cars and housing, but above all, these models help us make sense of unemployment.And more from Paul Krugman: What We Learn From Search Models
...
Professor Diamond’s ... work was distinguished both by elegant modeling — building the theoretical tools needed to make sense of labor turnover—and important insights. Perhaps the key idea is the “search externality,” the idea that each “additional worker makes it easier for vacancies to find workers and harder for other workers to find jobs.” ... Whenever one worker passes up a job, that worker makes finding a job easier for other workers. This insight led to Professor Diamond’s conclusion that higher levels of unemployment insurance could improve the workings of the labor market by making some workers pass up marginal jobs.
...
The work of these economists does not tell us how to fix our current high unemployment levels, but it does help us to make some sense of our current distress. Their models tell us that common wisdom — like the belief that higher unemployment benefits always increase unemployment — may be wrong and that policies that improve matching may have great value. Rarely has the prize committee been better able to match the honored work with the moment.
With regard to current concerns, probably the most relevant paper is Blanchard and Diamond on the Beveridge Curve — the relationship between job vacancies and unemployment. ... It shows that structural unemployment is a real issue, and that the volume of structural unemployment shifts over time. It also shows, however, that short-term movements in unemployment are overwhelmingly the result of overall shocks to demand ...And from Catherine Rampell at the NY Times: 3 Share Nobel Economics Prize for Labor Analysis
In a telephone interview with reporters at the Nobel news conference in Sweden, Professor Pissarides said he thought the work being honored had one lesson in particular for today’s policy makers: “What we should really be doing is make sure the unemployed do not stay unemployed for too long, to try to give them direct work experience,” so that they “don’t lose their attachment to the labor force.”
Professor Diamond, in a news conference at M.I.T., echoed his colleague’s advice about getting people back to work as quickly as possible, but said fears about permanently higher unemployment rates and structural displacement of workers were overblown.
“I think the economy is very adaptive,” he said. “Workers and employers will adapt to what will make the economy function. I see no reason why, once we get fully over this, we won’t go back to normal times,” with more “normal” unemployment rates.
Real GDP Growth and the Unemployment Rate
by Calculated Risk on 10/11/2010 12:33:00 PM
At the November FOMC meeting, the Fed will update their economic forecasts.
In June, the Fed forecast was for GDP growth of between 3.5% and 4.2% in 2011, with the unemployment rate falling to 8.3% to 8.7%. However since their forecasts were too optimistic for 2010, the unemployment rate would even be higher next year with the same growth forecast in 2011 (because the FOMC had expected the unemployment rate to fall further in 2010).
 Click on graph for larger image.
Here is an update on a version of Okun's Law. This graph shows the annual change in real GDP (x-axis) vs. the annual change in the unemployment rate (y-axis).
Note: For this graph I used a rolling four quarter change - so all the data points are not independent. However - remember - this "law" is really just a guide.
Using this graph and the previous Fed forecasts for 2011 (3.5% to 4.2% GDP growth), we can estimate that the unemployment rate will be in the 9.0% to 9.4% range in a year (although the spread is pretty wide).
The following table summarizes several scenarios over the next year (starting from the current 9.6% unemployment rate):
| Real GDP Growth | Unemployment Rate in One Year |
|---|---|
| 0.0% | 11.0% |
| 1.0% | 10.5% |
| 2.0% | 10.0% |
| 3.0% | 9.6% |
| 4.0% | 9.1% |
| 5.0% | 8.7% |
I expected a sluggish recovery in 2010, so I thought the unemployment rate would stay elevated throughout 2010 (that was correct).
Going forward, I think the recovery will stay sluggish and choppy for some time and I'd guess the unemployment rate will tick up in the short term and still be above 9% later next year. You can see why those expecting 1% to 2% growth next year (like Goldman Sachs) are expecting the unemployment rate to be close to 10%.
Obviously higher growth rates would mean an even quicker decline in the unemployment rate, and a decline in real GDP would mean much higher unemployment rates.
CNBC Survey: Fed Certain to act in November
by Calculated Risk on 10/11/2010 09:23:00 AM
Market participants now expects QE2 to be announced at 2:15 PM ET on November 3rd (when the FOMC statement is released at the conclusion of the two day meeting).
From Steve Liesman at CNBC: Fed Certain to Act in November In a Big Way: Survey
[M]arket participants are now virtually certain that the Federal Reserve will announce [QE2] at the conclusion of its November meeting and do so in a sizeable way, according to an exclusive CNBC Fed Survey. ... participants forecast that the Fed will announce plans to purchase $500 billion in assets ...The FOMC might announce a large amount - or they might announce a monthly pace of purchases like the $100 billion we've discussed before, with the intention of reviewing the purchase pace at each subsequent FOMC meeting.
Note: This coming Friday, at 8:15 AM ET, Fed Chairman Ben Bernanke will address the tools and goals of QE2 at the Federal Reserve Bank of Boston Conference. His speech is titled: "Monetary Policy Objectives and Tools in a Low-Inflation Environment".
Sunday, October 10, 2010
Fed's Dudley: Costs of higher capital requirements under Basel III are "exaggerated"
by Calculated Risk on 10/10/2010 09:53:00 PM
Earlier:
The following speech focuses on Basel III capital and liquidity standards.
From NY Fed President William Dudley: Basel and the Wider Financial Stability Agenda
[T]he new standards will require banking organizations to significantly increase the amount of high-quality, loss-absorbing capital that they hold; significantly improve risk capture in trading, counterparty credit, securitization and other activities that the prior regulatory capital requirements did not adequately capture; make it more expensive for banks to provide liquidity guarantees to shadow banks; constrain the leverage that banking companies can take by introducing a credible, non-risk-based backstop; and increase the capacity of banks to absorb shocks that might temporarily impede their ability to access short-term funding markets. While these changes apply directly only to large internationally active banks, they will have wider ramifications for the financial system as a whole, including nonbanks and the capital markets.Note that the word "intended" is highlighted in the speech. The requirement are intended to encourage banks to change thier business models and reduce risk.
...
The new capital rules are intended to provide strong incentives for banks to change their business models in ways that make the system more stable and reduce the negative impact their actions have on others—for instance, by providing incentives to standardize OTC derivatives contracts and clear such standardized trades through central counterparties. To understand what these new requirements mean for the amount of capital banks will ultimately have to hold, it is important to note that one of the intended consequences of these changes is for banks to adjust their business models in ways that reduce the risks their activities generate.
And on the costs:
[S]ome argue that the new [Basel] standards are too severe. They argue that, in the short run, the higher standards could lead to a significant constraint in credit that could hurt the nascent economic expansion. And, they argue, in the long run, that the higher capital standards will inevitably drive up lending costs and that this will hurt economic performance. Although I believe the new standards do impose some real costs on the financial system in order to achieve real benefits, I believe that concerns over the costs are exaggerated.The new standards will be phased in over several years.
Summary for Week ending Oct 9th
by Calculated Risk on 10/10/2010 03:55:00 PM
A summary of last week - mostly in graphs.
The weak employment report all but guaranteed QE2 will be announced on November 3rd. The "whisper" number is for an announcement of an initial $500 billion in purchases of long term Treasury securities over the following six months.
 Click on graph for larger image.
This graph shows the job losses from the start of the employment recession, in percentage terms (as opposed to the number of jobs lost).
The dotted line is ex-Census hiring. The two lines have joined since the decennial Census is almost over.
The BLS reported:
1) Nonfarm payroll employment decreased by -95,000 in September
2) the Unemployment Rate was unchanged at 9.6%
3) Private employment increased by 64,000.
4) Government employment declined by 159,000 (mostly Census and local government).
5) Census 2010 employment decreased 77,000 in September.
6) so there were 18,000 payroll jobs lost ex-Census.
Note: This will be the last "ex-Census" report until the 2020 Census!
 The second graph shows the unemployment rate vs. recessions.
The unemployment rate has mostly moved sideways since falling to 9.7% in January 2010.
The economy has gained 334,000 jobs over the last year, and lost 7.75 million jobs since the recession started in December 2007. However the preliminary benchmark revision (to be announced with the January 2011 report) is for a downward revision of 366,000 jobs as of March 2010 - and that suggests over 8.1 million jobs have been lost since the start of the employment recession.
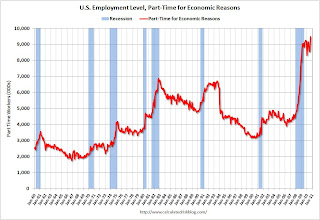 The number of workers only able to find part time jobs (or have had their hours cut for economic reasons) was at 9.472 million in September, up sharply from August.
 This is a new record high, and is obviously bad news.
These workers are included in the alternate measure of labor underutilization (U-6) that increased to 17.1% in September from 16.7% in August. The high for U-6 was 17.4% in October 2009.
 This graph shows the employment-population ratio; this is the ratio of employed Americans to the adult population.
The Employment-Population ratio was steady at 58.5% in September (the same low level as in August).
Note: the graph doesn't start at zero to better show the change.
The Labor Force Participation Rate was also steady at 64.7% in September. This is the percentage of the working age population in the labor force. The participation rate is well below the 66% to 67% rate that was normal over the last 20 years.
 The blue line is the number of workers unemployed for 27 weeks or more. The red line is the same data as a percent of the civilian workforce.
According to the BLS, there are 6.123 million workers who have been unemployed for more than 26 weeks and still want a job. This is 4.0% of the civilian workforce. It appears the number of long term unemployed has peaked ... Although this may be because people are giving up.
Employment Report Summary
The number of private sector jobs increased modestly by 64,000, otherwise the underlying details of the employment report were grim.
The negatives include the loss of 18,000 jobs ex-Census, the sharp increase in part time workers for economic reasons (and jump in U-6 unemployment rate), hours worked were flat (down for manufacturing workers), the employment-population ratio and labor force participation were flat at very low levels, and the unemployment rate was flat at a very high level.
This was another weak employment report.
 This graph shows the ISM non-manufacturing index (started in January 2008) and the ISM non-manufacturing employment diffusion index.
The September ISM Non-manufacturing index was at 53.2%, up from 51.5% in August - and above expectations of 52.0%. The employment index showed slight expansion in September at 50.2%, up from 48.2% in August. Note: Above 50 indicates expansion, below 50 contraction.
 This graph shows the office vacancy rate starting in 1991.
Reis is reporting the vacancy rate rose to 17.5% in Q3 2010, up from 17.4% in Q2 2010, and up from 16.6% in Q3 2009. The peak following the previous recession was 16.9%.
From the WSJ Signs of Recovery For Office Market
It appears the rate of increase in the vacancy rate has slowed - and rents may be stabilizing.
 Reis reported that the vacancy rate for large regional malls fell to 8.8% in Q3 from 9.0% in Q2. The vacancy rate at strip malls fell to 10.9%.
At regional malls, the record vacancy rate was 9.0% in Q2 2010 (Reis started tracking regional malls in 2000). The record vacancy rate for strip malls was in 1990 at 11.1%.
From Reuters: U.S. mall vacancy rate dips for first time in 3 years
And on apartment vacancies: From Ilaina Jonas at Reuters: US apartment vacancy rate drops sharply in 3rd qtr.
The national vacancy rate fell to 7.2 percent from 7.8 percent in the second quarter as renters soaked up 84,382 more units than were vacated ...This is for large apartment building in major cities, and it shows a significant drop in the vacancy rate.
Best wishes to all.
Schedule for Week of Oct 10th
by Calculated Risk on 10/10/2010 12:30:00 PM
The key release this week will be September retail sales on Friday. Also Fed Chairman Ben Bernanke will try to explain the objectives of QE2 on Friday "Monetary Policy Objectives and Tools in a Low-Inflation Environment".
Ceridian-UCLA Pulse of Commerce Index™ This is the diesel fuel index for September (a measure of transportation).
CoreLogic House Price Index for August. This release could show further declines in house prices. The index is a weighted 3 month average for June, July and August.
Association of American Railroads rail traffic indicators for September. Trucking, rail traffic and the Ceridian diesel fuel index are all measures of transportation (a coincident indicator).
2:45 PM ET: Federal Reserve Vice Chair Janet Yellen speaks at the National Association for Business Economics meeting in Denver: "Macroprudential Supervision and Monetary Policy in the Post-Crisis World"
7:30 AM: NFIB Small Business Optimism Index for September. This index has been showing small businesses remain pessimistic and the survey shows that the major concern of small businesses is lack of customers.
11:45 AM: Kansas City Fed President Thomas Hoenig speaks at the National Association for Business Economics meeting in Denver. "The Economic Outlook and Monetary Policy: Challenges Ahead"
2:00 PM: FOMC Minutes, Meeting of September 21, 2010. Investors will focus on any discussion of QE2.
7:00 AM: The Mortgage Bankers Association (MBA) will release the mortgage purchase applications index. This index declined sharply following the expiration of the tax credit. The index has increased a little recently - possibly due to borrowers trying to beat the slightly tighter FHA requirements.
7:45 PM: Richmond Fed President Jeffrey Lacker will speak in Chapel Hill, NC.
8:30 AM: The initial weekly unemployment claims report will be released. Consensus is for a slight decrease to 443K from 445K last week.
8:30 AM: Trade Balance report for August from the Census Bureau. The consensus is for the U.S. trade deficit to increase to $44 billion (from $42.8 billion in July).
8:30 AM: Producer Price Index for September. The consensus is for a 0.1% increase in producer prices.
8:15 AM: Fed Chairman Ben S. Bernanke will speak at the Federal Reserve Bank of Boston Conference "Monetary Policy Objectives and Tools in a Low-Inflation Environment"
8:30 AM: Consumer Price Index for September. The consensus is for a 0.2% increase in prices. This is being closely watched for further disinflation, and also because Q3 is the quarter the annual annual cost-of-living adjustment (COLA) is calculated for Social Security (this will make it official that there will be no change in 2011).
8:30 AM: Retail Sales for September. The consensus is for a 0.4% increase from August.
8:30 AM: Empire Manufacturing Survey for October. The consensus is for a reading of 8.0, up from 4.1 in September. These regional surveys have been showing a slowdown in manufacturing and are being closely watched right now.
9:15 AM: Atlanta Fed President Dennis Lockhart participates in a question-and-answer session on the economy in Atlanta.
9:55 AM: Reuters/University of Mich Consumer Sentiment preliminary for October. The consensus is for a slight increase to 69.0 from 68.2 in September.
10:00 AM: Manufacturing and Trade: Inventories and Sales for August. Consensus is for a 0.4% increase in inventories in August.
After 4:00 PM: The FDIC has really slowed down closing banks - even though the Unofficial problem bank list continues to increase. The pace of closures will probably pickup soon ...
8:15 AM: Boston Fed President Eric Rosengren speaks at Federal Reserve Bank of Boston Conference
Pearlstein on Foreclosure-Gate
by Calculated Risk on 10/10/2010 09:08:00 AM
From Steve Pearlstein at the WaPo: To sort this mess, both banks and borrowers must do the right thing
Listening to the fiery rhetoric about the mortgage mess emanating from politicians this week, you'd think that big bad banks were trying to foreclose on hundreds of thousands of homeowners who were current on their payments but had become victims of sloppy business practices.I've pointed this out several times: the basic facts are 1) the homeowners have a mortgage and 2) the homeowner is seriously delinquent.
...
But if, as appears to be the case, the overwhelming majority of homeowners facing foreclosure have fallen far behind on their payments, then it is a good deal harder to summon up the same moral outrage over reports that the banks and loan service companies cut corners, failed to keep the right documents and engaged in shoddy and even fraudulent practices. Just because the banks and servicers have screwed up doesn't mean they and their investors are no longer entitled to get their money back.
Certainly banks and servicers should, at their own expense, be sent back to do things right. Those who engaged in fraud should be punished. And if there are legitimate questions about who owns a loan, those will need to be resolved before the proceeds of any foreclosure are distributed.
But none of that changes the basic reality that there are millions of Americans who took out mortgages they could not support on houses they could not afford.
As Tom Lawler wrote "mortgage servicers who messed up should bear all of the costs associated with their mess up". And I'd prefer alternatives to foreclosure (mortgage modification or even short sales / deed-in-lieu), but we also need to remember that the basic facts are not in dispute.


