 RSS Feed
 by Calculated Risk on 9/30/2010 11:49:00 PM
Thursday, September 30, 2010
Video: Economist / Comedian Bauman at the American Economic Association humor session
A little economics humor ...
Hotel Occupancy Rate: Slightly below 2008 Levels
by Calculated Risk on 9/30/2010 09:04:00 PM
Hotel occupancy is one of several industry specific indicators I follow ...
From HotelNewsNow.com: STR: Chain scales report strong RevPAR gains
Overall, the U.S. hotel industry rose 7.5% in occupancy to 64.2%, average daily rate was up 2.6% to US$103.09, and RevPAR ended the week up 10.3% to US$66.15.The following graph shows the four week moving average for the occupancy rate by week for 2008, 2009 and 2010 (and a median for 2000 through 2007).
 Click on graph for larger image in new window.
Notes: the scale doesn't start at zero to better show the change. The graph shows the 4-week average, not the weekly occupancy rate.
On a 4-week basis, occupancy is up 6.0% compared to last year (the worst year since the Great Depression) and 5.2% below the median for 2000 through 2007.
The occupancy rate is slightly below the levels of 2008 - and 2008 was a tough year for the hotel industry!
Important: Even though the occupancy rate is close to 2008 levels, 2010 is a much more difficult year. The average daily rate (ADR) is off close to 8% from 2008 levels - so even with the similar occupancy rates, hotel room revenue is off sharply compared to two years ago.
Data Source: Smith Travel Research, Courtesy of HotelNewsNow.com
Existing Home Inventory declines slightly in September, Up year-over-year
by Calculated Risk on 9/30/2010 06:00:00 PM
Tom Lawler reports that at the end of September, listings on Realtor.com totaled 3,960,417, down 1.2% from 4,007,860 at the end of August. This is 1.7% higher than in September 2009.
The NAR reported inventory at 3.98 million at the end of August, and at 3.71 million in September 2009. So they will probably report inventory at around 3.85 million for September 2010. (NAR does not seasonally adjust inventory and this appears to be a normal seasonal decline. The months-of-supply metric uses seasonally adjusted sales, but NSA inventory.).
Since sales probably only increased slightly in September, the months-of-supply metric will probably still be well into double digits again.
Note: there is a seasonal pattern for existing home inventory. Usually inventory peaks in July and declines slightly through October - and then declines sharply at the end of the year as sellers take their homes off the market for the holidays.
Restaurant Index shows contraction in August
by Calculated Risk on 9/30/2010 03:31:00 PM
This is one of several industry specific indexes I track each month.
 Click on graph for larger image in new window.
Same store sales and customer traffic both declined again in August (on a year-over-year basis). Unfortunately the data for this index only goes back to 2002.
Note: Any reading above 100 shows expansion for this index.
From the National Restaurant Association (NRA): Restaurant Industry Outlook Remained Cautious as Restaurant Performance Index Was Essentially Flat in August
As a result of continued soft sales and traffic levels, the National Restaurant Association’s comprehensive index of restaurant activity remained below 100 for the fourth consecutive month in August. The Association’s Restaurant Performance Index (RPI) – a monthly composite index that tracks the health of and outlook for the U.S. restaurant industry – stood at 99.5 in August, essentially unchanged from the previous three months. In addition, the RPI stood below 100 for the fourth consecutive month, which signifies contraction in the index of key industry indicators.Restaurants are a discretionary expense, and this contraction could be because of the sluggish recovery or might suggest further weakness in consumer spending in the months ahead.
...
Restaurant operators reported a net decline in same-store sales for the fifth consecutive month in August ... Restaurant operators also continued to report a net decline in customer traffic levels in August..
emphasis added
The Economist: Expanding household Size
by Calculated Risk on 9/30/2010 01:34:00 PM
From The Economist: Cramped quarters: As children postpone their departure, households get larger
 Image credit: The Economist
[A]fter shrinking for decades, households have started to grow. Last year the average household had 2.59 people, up from 2.56 two years earlier, marking the first increase since 1993.Note: This data comes from the 2009 American Community Survey, and many caveats apply.
...
Much of this is almost certainly a response to the recession and the surge in unemployment. For young people who have lost their job or cannot find their first one, living with their parents becomes more attractive.
As Greg Ip noted, the overall U.S. population is still growing, and at the current growth rate that would usually mean the demand for over 1 million additional housing units per year. However since many people are doubling up (or as we always joke - have moved into their parent's basement), this keeps the demand for housing units down.
This might seem like a small increase in the number of people per household (from 2.56 to 2.59), however that has a significant impact on the number of housing units needed.
Some rough numbers: If we assume a population of 300 million, the slight increase in household size would suggest about 1.3 million fewer housing units were needed. (300 million divided 2.56) minus (300 million divided by 2.59) equals about 1.3 million. This is more than offset by the growing population over this two year period, but this shows why the excess inventory has remained very high even with a series low number of new housing units being completed.
We all expected this during the recession, but it will be important to watch if the household size starts to decline again.
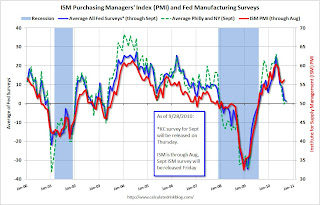
Kansas City Fed: Regional Manufacturing Activity rebounded in September
by Calculated Risk on 9/30/2010 11:13:00 AM
Usually I don't post all the regional manufacturing surveys, but it appears manufacturing is slowing right now - and the regional surveys provide early clues ...
From the Kansas City Fed:
Tenth District manufacturing activity rebounded in September, and producers’ expectations for future activity also improved.Here is an update to the graph comparing the regional Fed surveys with the ISM manufacturing survey, including the Kansas City survey released this morning:
...
The net percentage of firms reporting month-over-month increases in production in September was 14, up from 0 in August and equal to 14 in July ... The shipments, new orders, and order backlog indexes jumped back into positive territory.
...
The employment index was unchanged [at -2].
 Click on graph for larger image in new window.
For this graph I averaged the New York and Philly Fed surveys (dashed green, through September), and averaged five surveys including New York, Philly, Richmond, Dallas and Kansas City (blue).
The Institute for Supply Management (ISM) PMI (red) is through August (right axis).
The ISM Manufacturing index will be released tomorrow and the consensus is for a decline to 54.5 in September from 56.3 in August.
Chicago PMI increases in September
by Calculated Risk on 9/30/2010 09:45:00 AM
From the Institute for Supply Management – Chicago:
The Chicago Purchasing Managers reported the CHICAGO BUSINESS BAROMETER improved in September to chalk up a full twelve months of expansion.The overall index increased to 60.4 vs. 56.7. Note: any number above 50 shows expansion.
Employment index declined to 53.4 from 55.5 in August.
The new orders index increased to 61.4 from 55.0.
Overall this was a positive report. The national ISM manufacturing index will be released tomorrow.
Weekly Initial Unemployment Claims decrease
by Calculated Risk on 9/30/2010 08:30:00 AM
The DOL reports on weekly unemployment insurance claims:
In the week ending Sept. 25, the advance figure for seasonally adjusted initial claims was 453,000, a decrease of 16,000 from the previous week's revised figure of 469,000. The 4-week moving average was 458,000, a decrease of 6,250 from the previous week's revised average of 464,250.
 Click on graph for larger image in new window.
This graph shows the 4-week moving average of weekly claims since January 2000.
The dashed line on the graph is the current 4-week average. The four-week average of weekly unemployment claims decreased this week by 6,250 to 458,000.
The 4-week moving average has been moving sideways at an elevated level for about 10 months - and that suggests a weak job market.
Wednesday, September 29, 2010
Two Stories: JPMorgan halts some foreclosures, Fed to release crisis transaction details
by Calculated Risk on 9/29/2010 09:26:00 PM
Here are two stories we've been discussing in the comments ...
From David Streitfeld at the NY Times: JPMorgan Suspending Foreclosures
JPMorgan Chase, said it was halting 56,000 foreclosures because some of its employees might have improperly signed court documents. All of the suspensions are in the 23 states where foreclosures must be approved by a court, including New York, New Jersey, Connecticut, Florida and Illinois.It is amazing that the servicers haven't reviewed all their procedures already ...
And from Fed Chairman Ben Bernanke: Regulatory Reform Implementation
A final element of the Federal Reserve's efforts to implement the Dodd-Frank Act relates to the transparency of our balance sheet and liquidity programs. Well before enactment, we were providing a great deal of relevant information on our website, in statistical releases, and in regular reports to the Congress. Under a framework established by the act, the Federal Reserve will, by December 1, provide detailed information regarding individual transactions conducted across a range of credit and liquidity programs over the period from December 1, 2007, to July 20, 2010. This information will include the names of counterparties, the date and dollar value of individual transactions, the terms of repayment, and other relevant information. On an ongoing basis, subject to lags specified by the Congress to protect the efficacy of the programs, the Federal Reserve also will routinely provide information regarding the identities of counterparties, amounts financed or purchased and collateral pledged for transactions under the discount window, open market operations, and emergency lending facilities.Apparently disclosure isn't a problem now.
Fannie Mae and Freddie Mac: Serious Delinquent Rates decline
by Calculated Risk on 9/29/2010 05:01:00 PM

Click on graph for larger image in new window.
Fannie Mae reported today that the rate of serious delinquencies - at least 90 days behind - for conventional loans in its single-family guarantee business decreased to 4.82% in July, down from 4.99% in June - and up from 4.17% in July 2009.
"Includes seriously delinquent conventional single-family loans as a percent of the total number of conventional single-family loans."
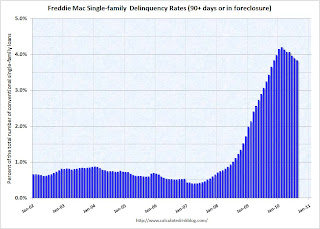 The second graph is for the delinquency rate for Freddie Mac. The rate declined to 3.83% in August (Freddie reports a month quicker than Fannie), from 3.89% in July.
Some of the rapid increase last year was probably because of foreclosure moratoriums, and distortions from modification programs because loans in trial mods were considered delinquent until the modifications were made permanent.
More modifications have become permanent and no longer counted as delinquent, and Fannie Mae and Freddie Mac are foreclosing again (they have a record number of REOs) - so there has been a decline in the delinquency rate.
Fed's Rosengren: Fed must respond "vigorously, creatively, thoughtfully, and persistently"
by Calculated Risk on 9/29/2010 01:31:00 PM
I cautioned that today was Fed speech day! Boston Fed president Eric Rosengren is currently a voting member of the FOMC ...
From Rosengren: How Should Monetary Policy Respond to a Slow Recovery?
I’ve called this talk “How Should Monetary Policy Respond to a Slow Recovery?” My answer to that question is: vigorously, creatively, thoughtfully, and persistently, as long as we have options at our disposal. And we do have options, despite having pushed short-term rates to the zero lower bound.On unemployment:
[T]he most recent recession is far less a reflection of dislocation in a few industries but rather reflects a general decline in almost all industries. ... in this recession there has been a peak to trough loss of employment of 5 percent or greater in construction, manufacturing, retail trade, wholesale trade, transportation, information technology, financial activities, and professional and business services. To me, this does not suggest that the driver is structural change in the economy increasing job mismatches – although no doubt some of that exists – but instead I see here a widespread decline in demand across most industries.And on QE2:
Now I’d like to make a few observations on Fed purchases of Treasury securities.And his conclusion:
First, the positives: Purchases of long-term Treasury securities are likely to push down long-term interest rates on Treasury bonds, but also are likely to reduce rates on other long-term securities. Some have argued that it would be difficult to reduce Treasury rates further, but Figure 13 highlights, importantly, that U.S. Treasury rates are still well above the zero bound, roughly equivalent to rates in Germany, and well above long-term rates in Japan.
Now some concerns: While purchases of Treasury securities have the advantage of not directly “allocating credit” to a particular industry, they have the disadvantage of only indirectly affecting the private borrowing rates that more directly affect private investment spending. In addition, Treasury purchases raise for some a concern that the Fed intends to monetize the federal debt, using monetary policy to accommodate the financing of fiscal policy. I can assure you that we have no desire or intention whatsoever to do so.
While lower long-term rates are likely the primary channel through which asset purchases would influence the economy, purchases of Treasury or mortgage-backed securities also expand the Federal Reserve’s balance sheet and increase the amount of reserves in the financial system. This expansion of reserves might serve as an effective signal that highlights the determination of the Federal Reserve to reduce disinflationary pressures.
Certainly, views on securities purchases differ within the ranks of policymakers and all manner of observers. I would just reiterate that it is important to keep firmly in mind the goal of such purchases: to stimulate the economy by reducing long-term interest rates to a level that is more consistent with where they would be, were we able to further reduce the federal funds rate.
While the economy is growing, it is currently growing too slowly to significantly reduce the unemployment rate or stem disinflationary pressures created by the high degree of slack in the economy. While fiscal policies may be the most effective way to stimulate the economy when short-term interest rates approach the zero bound, unconventional monetary policies provide additional policy options. Of course, policymakers need to carefully weigh the benefits and costs of unconventional monetary policy – some of which I have tried to share with you today. Yet all in all, my firm view is that it is important that policymakers be open to implementing policies consistent with achieving full employment, and an appropriate level of inflation, within a reasonable time frame.There is much more in this speech.
Fed's Plosser opposes QE2
by Calculated Risk on 9/29/2010 12:49:00 PM
With QE2 arriving on November 3rd - barring an upside surprise in the economic data - it is interesting to hear the views of the Fed presidents.
From Philadelphia Fed President Charles Plosser: Economic Outlook. On QE2:
[I]t is difficult, in my view, to see how additional asset purchases by the Fed, even if they move interest rates on long-term bonds down by 10 or 20 basis points, will have much impact on the near-term outlook for employment. Sending a signal that monetary policymakers are taking actions in an attempt to directly affect the near-term path of the unemployment rate, and then for those actions to have no demonstrable effects, would hurt the Fed’s credibility and possibly erode the effectiveness of our future actions to ensure price stability. It also risks leading the public to believe that the Fed is seeking to monetize the deficit and make it more difficult to return to normal policy when the time comes.And on the outlook:
While the near-term outlook has softened a bit, I expect growth in the national economy to be around 3 to 3½ percent over the next two years, with stronger business spending on equipment and software, moderate growth of consumer spending, and gradual improvement in household balance sheets.Although I agree that there will be some geographic and skill mismatches going forward because of the housing bubble - I don't think that is the main problem impacting the labor markets right now. There are many highly skilled people currently unemployed in many sectors - so Plosser's view appears incorrect.
The unemployment rate continues to be one of the biggest challenges our economy faces. Although unemployment will begin to decline gradually, it will take some time for it to return to its long-run level. As the economy strengthens and firms become convinced that the recovery is sustainable, hiring will pick up over the rest of this year and in 2011. But it may take even longer to address the sectoral, geographic, and skill imbalances that seem to plague the labor markets.
I expect inflation to remain subdued. As long as inflation expectations remain well anchored, I see little risk of a period of sustained deflation.
I'm surprised that Plosser is sticking with his optimistic (so far wrong) economic outlook. Right now Plosser is an alternate member of the FOMC and next year he will be a voting member (along with several other Fed presidents with similar views).
Fed's Kocherlakota revises down forecast
by Calculated Risk on 9/29/2010 10:31:00 AM
Minneapolis Federal Reserve President Narayana Kocherlakota spoke in London today. He has been one of more optimistic Fed presidents, and he revised down his forecast today ...
From Kocherlakota: Economic Outlook and the Current Tools of Monetary Policy
Our September estimates are distinctly lower than our August estimates. I now expect GDP growth to be around 2.4 percent in the second half of 2010 and around 2.5 percent in 2011.This still seems too optimistic, but he is moving in the right direction.
...
From the fourth quarter of 2009 through the second quarter of 2010, the change in the PCE price level was just over 0.5 percent, which works out to an annual rate of just over 1 percent. ... I expect inflation to remain at about this level during the rest of this year. However, our Minneapolis forecasting model predicts that it will rise back into the more desirable 1.5-2 percent range in 2011.
...
To summarize: GDP is growing, but more slowly than I expected or than we would like. Inflation is a little low, but only temporarily. The behavior of unemployment is deeply troubling.
And on the coming QE2:
My own guess is that further uses of QE would have a more muted effect on Treasury term premia. Financial markets are functioning much better in late 2010 than they were in early 2009. As a result, the relevant spreads are lower, and I suspect that it will be somewhat more challenging for the Fed to impact them.Kocherlakota is currently an alternate member of the FOMC and will be a voting member next year. It is interesting that certain Fed presidents are now revising down their overly optimistic forecasts - all but guaranteeing QE2 (even if he thinks it will have little impact).
Estimate of Decennial Census impact on September payroll employment: minus 78,000
by Calculated Risk on 9/29/2010 10:02:00 AM
The Census Bureau released the weekly payroll data for the week ending September 18th today (ht Bob_in_MA).
If we subtract the number of temporary 2010 Census workers in the week containing the 12th of the month, from the same week for the previous month - this provides a close estimate for the impact of the Census hiring on payroll employment.
The Census Bureau releases the actual number with the employment report.
 Click on graph for larger image in new window.
This graph shows the number of Census workers paid each week. The red labels are the weeks of the BLS payroll survey.
The Census payroll decreased from 83,955 for the week ending August 14th to 6,038 for the week ending September 18th.
So my estimate for the impact of the Census on September payroll employment is minus 78 thousand (this will probably be close). The employment report will be released on October 8th, and the headline number for September - including Census numbers - will probably be close to zero. But a key number will be the hiring ex-Census (so we will add back the Census workers again this month).
The following table compares the weekly payroll report estimate to the monthly BLS report on Census hiring - this shows the estimate is usually very close:
| Payroll, Weekly Pay Period | Payroll, Monthly BLS | Change based on weekly report | Actual Change (monthly) | |
|---|---|---|---|---|
| Jan | 25 | 24 | ||
| Feb | 41 | 39 | 16 | 15 |
| Mar | 96 | 87 | 55 | 48 |
| Apr | 156 | 154 | 61 | 67 |
| May | 574 | 564 | 418 | 410 |
| Jun | 344 | 339 | -230 | -225 |
| Jul | 200 | 196 | -144 | -143 |
| Aug | 84 | 82 | -116 | -114 |
| Sep | 6 | -78 | ||
| All thousands | ||||
There are very few temporary decennial workers left on the payroll, and this month marks the end of the weekly payroll report from the Census Bureau: "These data will continue through the end of September with the last release of data being the week of Sept. 26-Oct. 2."
I'll have more on the September employment report (due Oct 8th) this Sunday in the weekly schedule.
MBA: Mortgage Applications Purchase Index increases slightly
by Calculated Risk on 9/29/2010 07:34:00 AM
The MBA reports: Mortgage Refinance Applications Decrease Despite Decline in Rates in Latest MBA Weekly Survey
The Refinance Index decreased 1.6 percent from the previous week, which is the fourth straight weekly decrease. The seasonally adjusted Purchase Index increased 2.4 percent from one week earlier.
...
The average contract interest rate for 30-year fixed-rate mortgages decreased to 4.38 percent from 4.44 percent, with points increasing to 1.01 from 0.81 (including the origination fee) for 80 percent loan-to-value (LTV) ratio loans. The 30-year contract rate is a new low for this survey. The previous low was 4.43 percent for the week ending August 27, 2010.
 Click on graph for larger image in new window.
This graph shows the MBA Purchase Index and four week moving average since 1990.
Purchase applications have increased slightly from the lows in July and are at about the same level is in 1996 or 1997. This suggests existing home sales (closed transactions) in September, October, and even November will not be much above the August sales rate.
Tuesday, September 28, 2010
ATA: Truck Tonnage Index "Plunged" 2.7 Percent in August
by Calculated Risk on 9/28/2010 07:56:00 PM
From the American Trucking Association: ATA Truck Tonnage Index Plunged 2.7 Percent in August
The American Trucking Associations’ advance seasonally adjusted (SA) For-Hire Truck Tonnage Index fell 2.7 percent in August, which was the largest month-to-month decrease since March 2009. The latest drop lowered the SA index from 110 (2000=100) in July to 106.9 in August.
...
Compared with August 2009, SA tonnage climbed 2.9 percent, which was well below July’s 7.4 percent year-over-year gain. Year-to-date, tonnage is up 6.2 percent compared with the same period in 2009.
ATA Chief Economist Bob Costello said that August’s data highlights that the economy, while still growing, is slowing. “We fully anticipate sluggish economic growth for the remainder of this year and the latest tonnage numbers are reflecting that slowdown.”

Fed's Lockhart: The Approaching Monetary Policy Decision Dilemma
by Calculated Risk on 9/28/2010 05:44:00 PM
From Atlanta Fed President Dennis Lockhart: The Approaching Monetary Policy Decision Dilemma
In the coming weeks monetary policymakers must come to grips with the question of whether there is anything they can do to improve the situation in the economy and, if so, what that action should be. The circumstances of weak recovery, persistent unemployment, dangerously low inflation, and the policy interest rate (the primary tool of modern monetary policy) at the zero lower bound present a tough analytical challenge.Lockhart is not a voting member of the FOMC this year, but I think a consensus is building for QE2 in early November.
...
If action is taken by the Fed, a clear option is to grow the size of the balance sheet since the policy interest rate, for all practical purposes, cannot go any lower. Growth of the balance sheet would be accomplished by a second round of asset purchases (probably Treasury bills and notes) paid for by newly created money. The technical term for this policy is "quantitative easing," and the prospect of more of this approach is being referred to as QE2.
Will it work? And, how much would be needed to make a difference? In my view, a consensus on these pivotal questions remains to come together, and I will not take a position here today. In the weeks ahead my staff and I will be tackling these and related questions to prepare for the important decisions coming.
...
I cannot tell you how the economic policy story will play out. I can assure you, however, that the Fed has scope for further action to influence the course of recovery. And, importantly, I believe the Fed and the committee have the will to act—or not—as demanded by economic conditions in the near term.
Meredith Whitney on state budget crisis
by Calculated Risk on 9/28/2010 04:22:00 PM
From Jeff Cox at CNBC: States Are Poised to Be Next Credit Crisis for US: Whitney
"The similarities between the states and the banks are extreme to the extent that states have been spending dramatically and are leveraged dramatically," [Meredith Whitney] said. "Municipal debt has doubled since 2000, spending has grown way faster than revenues."Many states have serious budget and debt issues, but I doubt it will result in a "near-trillion-dollar bailout" (note that Whitney is saying an "attempt" at a bailout). More likely the states will raise some taxes and cut more services - and this will be a drag on growth for some time.
...
"You have to look at the states and the risk that the states pose, because the crisis with the states will result in an attempt at least for the third near-trillion-dollar bailout."
...
[On banks] "We think October, after the banks report, you'll see a really ugly Case-Shiller number, which means the fourth quarter is going to be very tough for banks."
I think Whitney is correct on the timing of the Case-Shiller numbers, but I don't think the numbers will be anywhere near as "ugly" as earlier price declines.
Misc: Case-Shiller, Manufacturing Surveys, QE2 and Europe
by Calculated Risk on 9/28/2010 12:26:00 PM
The headlines on Case-Shiller seemed contradictory this morning. Here are a few examples:
From the Financial Times: US home prices slip in July
From the WSJ: Home Prices Rose in July
From CNBC: US Home Prices Slipped In July And May Stabilize Near Lows
From MarketWatch: Home price growth slows in July
From HousingWire: S&P/Case-Shiller 20-city composite index rose 0.6% for July
The reason for the confusion is S&P Case-Shiller reports both seasonally adjusted (SA), and not seasonally adjusted (NSA) data. Because of concerns about the impact of foreclosures and government programs on prices, S&P switched to reporting NSA numbers in their press release, but many analysts are still using the SA numbers (I reported the SA numbers - see this post for the SA graphs from earlier this morning).
The important points are:
1) this is a three month average of May, June, and July. Seasonally this is the strongest time of the year for house prices.
2) sales collapsed in July, so the next report (for June, July and August) will probably show falling prices.
Here is an update to the graph comparing the regional Fed surveys with the ISM manufacturing survey, including the Richmond survey released this morning (Kansas City will be released Thursday):
 Click on graph for larger image in new window.
For this graph I averaged the New York and Philly Fed surveys (dashed green, through September), and averaged five surveys including New York, Philly, Richmond, Dallas and Kansas City (blue, through September - KC through August).
The Institute for Supply Management (ISM) PMI (red) is through August (right axis).
Last month, when the ISM survey came in slightly better than expected, I wrote: "Based on this graph, I'd expect either the Fed surveys to bounce back in September - or the ISM to decline." So far there has been little "bounce back" in the Fed surveys - so I expect a decline in the ISM survey.
The consensus is for a decline in ISM Manufacturing Index to 54.5 in September from 56.3 in August.
There was a very important article from Jon Hilsenrath at the WSJ yesterday: Fed Weighs New Tactics to Bolster Recovery (note: many people think that Hilsenrath has taken over Greg Ip's role (now at the Economist) and leaks to Hilsenrath might be part of the Fed's communication strategy).
I reviewed the article here, but the key points are the Fed is debating between announcing "massive bond purchases with a finite end" and a "smaller-scale program that they could adjust" over time. Based on the article, it appears the Fed is leaning towards the latter (small-scale program).
Although QE2 isn't a done deal, the odds are very high that the next round will be announced on November 3rd at 2:15 PM ET.
The crisis is not over in Europe.
From Reuters: Ireland Faces Threat of New Downgrades
Two more credit rating agencies warned Ireland on Tuesday that its debt was at risk of being downgraded further, setting off another leap in borrowing costs and heaping pressure on the government to accelerate the planned late-October release of a budget preview.The Ireland and Portugal to Germany bond spreads have hit new highs again today.
Richmond Fed: Regional manufacturing activity contracted after seven months of expansion
by Calculated Risk on 9/28/2010 10:00:00 AM
Note: Usually I don't post all the regional manufacturing surveys, however with the inventory adjustment over, export growth slowing, and domestic consumer demand sluggish, these surveys provide an early look at weakness in the manufacturing sector.
From the Richmond Fed: Manufacturing Activity Pulled Back in September, But Expectations Upbeat
Manufacturing activity in the central Atlantic region pulled back in September after expanding during the previous seven months, according to the Richmond Fed's latest survey. The index of overall activity was pushed lower as shipments and employment edged into negative territory. Other indicators also suggested softer activity. District contacts reported that the volume of new orders flattened, order backlogs turned negative, and delivery times held steady. Furthermore, manufacturers reported growth in capacity utilization flat lined, while inventories grew at a slightly quicker pace.This is further evidence of the slowdown in manufacturing.
...
In September, the seasonally adjusted composite index of manufacturing activity — our broadest measure of manufacturing — turned negative, losing thirteen points to −2 from August's reading of 11. Among the index's components, shipments fell fifteen points to −4, new orders lost ten points to finish at 0, and the jobs index declined fifteen points to −3.
Other indicators also suggested weaker activity. The backlogs of orders measure turned negative losing eleven points to −11, and the index for capacity utilization flattened declining fourteen points to 0. The delivery times index held steady at 8, while our gauges for inventories were somewhat higher in September.
...
Labor market activity also weakened in September. The manufacturing employment index registered a −3 versus August's reading of 12, and the average workweek measure lost fourteen points to 0. In addition, wage growth posted a five-point loss to 8.
Also, from CNBC: Consumer Confidence Falls to Lowest Level Since February
The Conference Board, an industry group, said its index of consumer attitudes fell to 48.5 in September from a revised 53.2 in August.


