 RSS Feed
 by Calculated Risk on 9/04/2010 01:21:00 PM
Saturday, September 04, 2010
Update: Total people receiving unemployment benefits
Here is a graph from the Atlanta Fed of the number of people receiving extended unemployment benefits ... Note: data as of Aug 7th - there were about 300,000 less people receiving benefits on Aug 14th (most recent data NSA). Click on graph for larger image.
From the Atlanta Fed:
The number of persons receiving extended benefits has shot up in the weeks following the reinstatement of the emergency unemployment compensation (EUC) program.That is an increase of almost 2 million people receiving aid since the program was reinstated.
Note: As people exhaust their regular benefits, they move on to receive extended benefits first through the federal EUC program and then their state’s extended benefits (EB) program.
• The number of persons receiving emergency unemployment compensation (EUC) has increased by nearly 1.6 million in the three weeks since the program was reinstated on July 22, 2010. For the week ending August 7, the number of claimants reached 4.9 million.
• Extended benefits (EB) claimants increased by more than 300,000 (or 50%) during the same period. There were 937,000 people claiming extended benefits for the week ending August 7.
• Currently, up to 73 weeks of benefits extensions are available including both the EUC and EB programs (53 weeks of EUC and 20 weeks of EB).
There are another 4.1 million people receiving regular unemployment benefits (NSA). So the total is close to 10 million (NSA).
Duration of Unemployment
by Calculated Risk on 9/04/2010 08:56:00 AM
An update by request ... Click on graph for larger image.
This graph shows the duration of unemployment as a percent of the civilian labor force. The graph shows the number of unemployed in four categories: less than 5 week, 6 to 14 weeks, 15 to 26 weeks, and 27 weeks or more.
Note: The BLS reports 15+ weeks, so the 15 to 26 weeks number was calculated.
In August 2010, the number of unemployed for 27 weeks or more declined significantly to 6.249 million (seasonally adjusted) from 6.752 million in July. It appears the number of long term unemployed has peaked, but it is still very difficult for these people to find a job - and this is a very serious employment issue.
The 5 to 14 week category increased sharply in August and is now at the highest level since October 2009 - and that is concerning.
Note: Even though these numbers are all seasonally adjusted, they can't be added together to calculate the unemployment rate. And a repeat of a popular graph ...
The second graph shows the job losses from the start of the employment recession, in percentage terms (as opposed to the number of jobs lost).
Best to all
Employment posts yesterday (with many graphs):
Friday, September 03, 2010
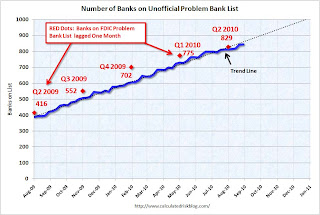
Unofficial Problem Bank List increases to 844 institutions
by Calculated Risk on 9/03/2010 10:56:00 PM
Note: this is an unofficial list of Problem Banks compiled only from public sources.
Here is the unofficial problem bank list for September 3, 2010.
Changes and comments from surferdude808:
It was a comparatively quiet week for the Unofficial Problem Bank List as there were only four additions and no removals with the FDIC taking the long holiday weekend off from closures.
The additions include First National Bank of Chester County, Chester, PA ($1.2 billion Ticker: FCEC); Lafayette Savings Bank, FSB, Lafayette, IN ($379 million Ticker: LSBI); Oregon Community Bank & Trust, Oregon, WI ($195 million); and Hull Federal Savings Bank, Baltimore, MD ($27 million). Other changes include Prompt Corrective Action Orders issued by the Federal Reserve against First Community Bank ($2.6 billion Ticker: FSNM) and Sunrise Bank ($134 million) and OTS against AnchorBank, fsb ($4.0 billion Ticker: ABCW).
The Unofficial Problem Bank List includes 844 institutions with aggregate assets of $412 billion. This week the FDIC released its official count of problem institutions at 829 with assets of $403 billion as of June 30th.
 Click on graph for larger image in new window.
This graph shows the number of banks on the unofficial list. The number of institutions has more than doubled since we started the list in early August 2009 - even with all the bank failures (failures are removed from the list). The number of assets is up 50 percent over the last year.
On August 7, 2009, we listed 389 institutions with $276 billion in assets, and now the list has 844 institutions and $412 billion in assets.
The red dots are the number of banks on the official problem bank list as announced in the FDIC quarterly banking profile for Q2 2009 through Q2 2010. The dots are lagged one month because of the delay in announcing formal actions.
The unofficial count is close to the official count (the difference is mostly timing issues), and the FDIC will probably have close to 1,000 banks on the list by the end of the year.
NFIB: Small Businesses Still Not Hiring
by Calculated Risk on 9/03/2010 08:15:00 PM
From NFIB: Small Businesses Still Not Hiring
William C. Dunkelberg, chief economist for the National Federation of Independent Business [said] “In August, most firms did not change employment, but for those that did, 11 percent (up one point from July) increased average employment by 2.3 employees, but 13 percent (down two points) reduced their workforces by an average of 3.5 workers. Job creation still has not crossed the 0 line in the small business sector.Note: A large percentage of small businesses are in real estate related fields and that will keep hiring down for some time. The August survey will be released on Sept 14th, but once again the key problem is "weak sales".
...
“Over the next three months, 13 percent plan to reduce employment (up three points), and 8 percent plan to create new jobs (down one point), yielding a seasonally adjusted net 1 percent of owners planning to create new jobs, a point worse than July, but at least it’s positive.
“Overall, the job creation picture is still bleak. Weak sales and uncertainty about the future continue to hold back any commitments to growth, hiring or capital spending."
Earlier employment posts today (with many graphs):
Rail Traffic increases 5.7% in August compared to August 2009
by Calculated Risk on 9/03/2010 04:12:00 PM
From the Association of American Railroads: Rail Time Indicators. The AAR reports traffic in August 2010 was up 5.7% compared to August 2009 - and traffic was 11.6% lower than in August 2008.
However traffic declined 1.6% from July on a Seasonally Adjusted (SA) basis.  Click on graph for larger image in new window.
This graph shows U.S. average weekly rail carloads (NSA). Traffic increased in 16 of 19 major commodity categories year-over-year.
From AAR:
• U.S. freight railroads originated 1,179,447 carloads in August 2010, an average of 294,862 carloads per week. That’s up 5.7% from August 2009 though down 11.6% from August 2008 on a non-seasonally adjusted basis. It’s also the highest weekly average for any month since November 2008 and reverses a string of three straight months in which average unadjusted carloads fell in absolute terms.As the graph above shows, rail traffic collapsed in November 2008, and now, a year into the recovery, traffic has only recovered part way.
• However, on a seasonally adjusted basis, U.S. rail carloads fell 1.6% in August 2010 from July 2010. As the chart below ... shows, on an unadjusted basis rail traffic almost always increases from July to August. In that chart, note the upward slope of the line segment from July 2010 to August 2010. That slope is not as steep as the line segments for the same period in most other years on the graph, or for most prior years not shown on the chart. In a nutshell, that explains why seasonally adjusted rail traffic in August 2010 is down a bit when unadjusted traffic is up.
excerpts with permission
Employment Diffusion Indices
by Calculated Risk on 9/03/2010 02:03:00 PM
A few more comments:
 Click on graph for larger image.
The BLS diffusion index for total private employment declined to 53.0 from 56.7 in July. For manufacturing, the diffusion index declined to 47.0 from 53.0 in July, and down sharply from 67.1 in April.
Think of this as a measure of how widespread job gains are across industries. The further from 50 (above or below), the more widespread the job losses or gains reported by the BLS. From the BLS:
Figures are the percent of industries with employment increasing plus one-half of the industries with unchanged employment, where 50 percent indicates an equal balance between industries with increasing and decreasing employment.The increases in the diffusion indices in 2009 and earlier this year, was a clear positive in the monthly employment reports. However the decrease in the diffusion indices over the last few months (falling below 50% for manufacturing in August), is disappointing.
Earlier employment posts today (with many graphs):
ISM Non-Manufacturing Index declines in August
by Calculated Risk on 9/03/2010 11:23:00 AM
Earlier employment posts:
The August ISM Non-manufacturing index was at 51.5%, down from 54.3% in July - and below expectations of 53.0%. The employment index showed contraction in August at 48.2%. Note: Above 50 indicates expansion, below 50 contraction.
 Click on graph for larger image in new window.
This graph shows the ISM non-manufacturing index (started in January 2008) and the ISM non-manufacturing employment diffusion index.
The overall ISM index, and the employment index, are both at the lowest level since January.
From the Institute for Supply Management: August 2010 Non-Manufacturing ISM Report On Business®
Economic activity in the non-manufacturing sector grew in August for the eighth consecutive month, say the nation's purchasing and supply executives in the latest Non-Manufacturing ISM Report On Business®.
The report was issued today by Anthony Nieves, C.P.M., CFPM, chair of the Institute for Supply Management™ Non-Manufacturing Business Survey Committee; and senior vice president — supply management for Hilton Worldwide. "The NMI (Non-Manufacturing Index) registered 51.5 percent in August, 2.8 percentage points lower than the 54.3 percent registered in July, indicating continued growth in the non-manufacturing sector but at a slower rate. The Non-Manufacturing Business Activity Index decreased 3 percentage points to 54.4 percent, reflecting growth for the ninth consecutive month, but at a slower rate than in July. The New Orders Index decreased 4.3 percentage points to 52.4 percent, and the Employment Index decreased 2.7 percentage points to 48.2 percent, reflecting contraction after one month of growth.
emphasis added
Employment-Population Ratio, Part Time Workers, Unemployed over 26 Weeks
by Calculated Risk on 9/03/2010 09:50:00 AM
Here are a few more graphs based on the employment report ...
Percent Job Losses During Recessions, aligned at Bottom Click on graph for larger image.
This graph shows the job losses from the start of the employment recession, in percentage terms - this time aligned at the bottom of the recession (Both the 1991 and 2001 recessions were flat at the bottom, so the choice was a little arbitrary).
The dotted line shows the impact of Census hiring. In August, there were only 82,000 temporary 2010 Census workers still on the payroll. The number of Census workers will continue to decline - and the remaining gap between the solid and dashed red lines will be gone soon.
Employment-Population Ratio
The Employment-Population ratio increased to 58.5% in August from 58.4% in July.  This graph shows the employment-population ratio; this is the ratio of employed Americans to the adult population.
Note: the graph doesn't start at zero to better show the change.
The Labor Force Participation Rate increased to 64.7% from 64.6% in July. This is the percentage of the working age population in the labor force. This increase was mostly because of the an increase in the teen participation rate (related to the very weak teen participation rate during the summer). The participation rate is well below the 66% to 67% rate that was normal over the last 20 years.
As the employment picture improves, people will return to the labor force, and that will put upward pressure on the unemployment rate.
Part Time for Economic Reasons 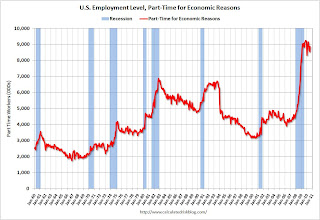 From the BLS report:
The number of persons employed part time for economic reasons (sometimes referred to as involuntary part-time workers) increased by 331,000 over the month to 8.9 million. These individuals were working part time because their hours had been cut back or because they were unable to find a full-time job.The number of workers only able to find part time jobs (or have had their hours cut for economic reasons) was at 8.9 million in August. This increase was bad news.
The all time record of 9.24 million was set in October 2009.
These workers are included in the alternate measure of labor underutilization (U-6) that increased to 16.7% in August from 16.5% in July.
Unemployed over 26 Weeks
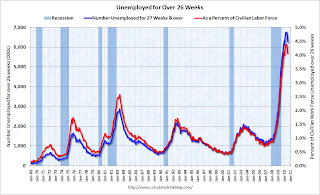 The blue line is the number of workers unemployed for 27 weeks or more. The red line is the same data as a percent of the civilian workforce.
According to the BLS, there are 6.249 million workers who have been unemployed for more than 26 weeks and still want a job. This is 4.1% of the civilian workforce. It appears the number of long term unemployed has peaked ... hopefully not because people are giving up.
Summary
The underlying details of the employment report were mixed. The positives: the upward revisions to the June and July reports, a slight increase in hours worked for manufacturing employees (flat for all employees), an increase in hourly wages, and the decrease in the long term unemployed. Other positives include the slight increase in the employment-population ratio and the participation rate.
The negatives include the hiring of only 60,000 ex-Census, the increase in the unemployment rate (including U-6), and the increase in part time workers for economic reasons.
Overall this was a weak report and is consistent with a sluggish recovery.
Earlier employment post today:
August Employment Report: 60K Jobs ex-Census, 9.6% Unemployment Rate
by Calculated Risk on 9/03/2010 08:30:00 AM
From the BLS:
Nonfarm payroll employment changed little (-54,000) in August, and the unemployment rate was about unchanged at 9.6 percent, the U.S. Bureau of Labor Statistics reported today. Government employment fell, as 114,000 temporary workers hired for the decennial census completed their work. Private-sector payroll employment continued to trend up modestly (+67,000).Census 2010 hiring decreased 114,000 in August. Non-farm payroll employment increased 60,000 in July ex-Census.
Both June and July payroll employment were revised up. "June was revised from -221,000 to -175,000, and the change for July was revised from -131,000 to -54,000."
 Click on graph for larger image.
This graph shows the unemployment rate vs. recessions.
Nonfarm payrolls decreased by 54 thousand in August. The economy has gained 229 thousand jobs over the last year, and lost 7.6 million jobs since the recession started in December 2007.
The second graph shows the job losses from the start of the employment recession, in percentage terms (as opposed to the number of jobs lost).The dotted line is ex-Census hiring. The two lines have almost joined since the decennial Census hiring is almost over.
For the current employment recession, employment peaked in December 2007, and this recession is by far the worst recession since WWII in percentage terms, and 2nd worst in terms of the unemployment rate (only early '80s recession with a peak of 10.8 percent was worse).
This is another weak report, however the upwards revisions to June and July were a positive. The participation rate increased slightly - and that is good news - but the unemployment rate also increased. I'll have much more soon ...
Update: For more, see: Employment-Population Ratio, Part Time Workers, Unemployed over 26 Weeks
Thursday, September 02, 2010
Krugman: On Inflation and Interest Rates
by Calculated Risk on 9/02/2010 11:46:00 PM
From Paul Krugman in the NY Times: The Real Story
... When Mr. Obama first proposed $800 billion in fiscal stimulus, there were two groups of critics. Both argued that unemployment would stay high — but for very different reasons.The second half slowdown arrived right on schedule (maybe a month early). And there is no question who was correct on inflation and interest rates.
One group — the group that got almost all the attention — declared that the stimulus was much too large, and would lead ... to skyrocketing interest rates and soaring inflation.
The other group, which included yours truly, warned that the plan was much too small given the economic forecasts then available. ... Critics in the second camp were particularly worried about what would happen this year, since the stimulus would have its maximum effect on growth in late 2009 then gradually fade out. Last year, many of us were already warning that the economy might stall in the second half of 2010.
But now what? Unemployment is still too high ...
Employment Report Preview
by Calculated Risk on 9/02/2010 08:30:00 PM
1) The consensus is for a headline payroll number of minus 90,000 and for the unemployment rate to increase to 9.6% in August from 9.5% in July.
Goldman Sachs is forecasting a minus 125,000 headline payroll number, with no change in private employment and minus 115,000 decline in decennial Census employment. That gives a negative 10,000 ex-Census.
2) My estimate is the decennial Census workforce was reduced by 116,000 in August. This suggests a consensus headline payroll number of +26,000 ex-Census (see point 4). I'll take the under on payroll employment ex-Census.
3) The unemployment rate is dependent on both job creation and the participation rate (both numbers from the household survey - payroll employment is from the establishment survey).
Usually the participation rate - the percent of the civilian population in the labor force - falls when the job market is weak. And a decline in the participation rate puts downward pressure on the unemployment rate (and the opposite is true when the participation rate increases). For technical reasons, there is a possibility that the participation rate increased in August - even with weak job creation - putting upward pressure on the unemployment rate.
4) And here is an easy prediction: there will be some confusion about which payroll number to report!
Here is an excerpt from a employment report preview story from CNBC:
Investors are likely to focus on the private payrolls number, analysts said, given that overall payrolls data is expected to have been influenced by the loss of government census hiring, among other factors.What "other factors"? The reason everyone has switched to the private payroll number is because of the hiring and layoffs associated with the decennial Census. But this misses any local and state government layoffs (kind of a big story right now).
Reporting that is consistent with non-decennial Census employment reports is to lead with the headline payroll number ex-Census. What has confused some people (I think) is that the Census hiring and layoffs is Not Seasonally Adjusted (NSA), and the headline number is SA. Usually it is not appropriate to mix NSA and SA numbers, but this is a rare exception.
I checked with the BLS, and I even submitted it as a question when the BLS had their first live chat back in March:
9:34 Michele Walker (BLS-CES) -Oh well ... this will be the last big change in decennial Census employment.
Submitted via email from Bill: Hi. The headline payroll number is seasonally adjusted, and the hiring for the 2010 Census is NSA. How would you suggest adjusting for the 2010 Census hiring to determine the underlying trend (not counting the snow storms!)?
Thanks for your question Bill.
There is an adjustment made for the 2010 Census. Before seasonally adjusting the estimates, BLS makes a special modification so that the Census workers do not influence the calculation of the seasonal factors. Specifically, BLS subtracts the Census workers from the not-seasonally adjusted estimates before running seasonal adjustment using X-12. After the estimates have been seasonally adjusted, BLS adds the Census workers to the seasonally adjusted totals. Therefore, to determine the underlying trend of the total nonfarm (TNF) employment estimates (minus the Census workers), simply subtract the Census employment from the seasonally adjusted TNF estimate.
Realtors, Builders oppose another Housing Tax Credit
by Calculated Risk on 9/02/2010 05:09:00 PM
A couple of quotes from Kathleen Pender at the San Francisco Chronicle: Little support for new home-buyer tax credit
"We are not advocating another one. We think it's important for the market to have time to recover on its own," says Walter Molony, spokesman for the National Association of Realtors.And HUD Secretary Shaun Donovan said yesterday, via Reuters: No talk of new homebuyer tax credit
...
"From a political standpoint, with Congress not wanting to increase the debt, it would be too expensive," [Bernard Markstein, senior economist with the National Association of Home Builders] says. "In terms of advisable, we are bordering on where tax credits become ineffective."
"It is not high on anyone's list that we have heard. We have not heard Congress talking about renewing it," Housing and Urban Development Secretary Shaun Donovan said in response to a reporter's question about a possible tax credit renewal.
Hotel Occupancy Rate: Just below 2008 Levels
by Calculated Risk on 9/02/2010 02:30:00 PM
Hotel occupancy is one of several industry specific indicators I follow ...
From HotelNewsNow.com: STR: Chain scales report weekly increases
Overall, the industry’s occupancy increased 10.6% to 60.1%, ADR rose 2.4% to US$96.50, and revenue per available room increased 13.2% to US$57.98.The following graph shows the four week moving average for the occupancy rate by week for 2008, 2009 and 2010 (and a median for 2000 through 2007).
 Click on graph for larger image in new window.
Notes: the scale doesn't start at zero to better show the change. The graph shows the 4-week average, not the weekly occupancy rate.
On a 4-week basis, occupancy is up 7.9% compared to last year (the worst year since the Great Depression) and 3.9% below the median for 2000 through 2007.
The occupancy rate is just below the levels of 2008 - but 2008 was a tough year for the hotel industry!
Data Source: Smith Travel Research, Courtesy of HotelNewsNow.com
Greece: Default Probabilities before and after policy response
by Calculated Risk on 9/02/2010 12:18:00 PM
Here is a graph from the Council of Foreign Relations blog: Greek Debt Crisis – Apocalypse Later Click on graph for larger image in new window.
This graph from Paul Swartz at the CFR shows the default probabilities on three different dates:
On April 30th, no European plan was yet in place to address the ballooning Greek debt, and default was considered a real possibility in the short term. On May 11th, just after the European Stabilization Mechanism (ESM) was announced, markets sharply cut their view on the odds of default across all time horizons. ... On September 1st, the market’s view of the probability of default within two years was lower than before the ESM was announced, but higher over longer time frames.So initially the policy response lowered the default probabilities across all time frames (from red to light blue), but now - after further analysis - the default probabilities have increased for longer time frames (green).
Pending Home Sales increase in July
by Calculated Risk on 9/02/2010 10:00:00 AM
From the NAR: Pending Home Sales Rise
The Pending Home Sales Index ... rose 5.2 percent to 79.4 based on contracts signed in July from a downwardly revised 75.5 in June, but remains 19.1 percent below July 2009 when it was 98.1. The data reflects contracts and not closings, which normally occur with a lag time of one or two months.This suggests a small increase in existing home sales in September (reported when transactions close), but this also suggests double digit months of supply for some time.
Lawrence Yun, NAR chief economist, cautioned that there would be a long recovery process. “Home sales will remain soft in the months ahead ..."
Weekly initial unemployment claims decline slightly
by Calculated Risk on 9/02/2010 08:30:00 AM
The DOL reports on weekly unemployment insurance claims:
In the week ending Aug. 28, the advance figure for seasonally adjusted initial claims was 472,000, a decrease of 6,000 from the previous week's revised figure of 478,000. The 4-week moving average was 485,500, a decrease of 2,500 from the previous week's revised average of 488,000.
 Click on graph for larger image in new window.
This graph shows the 4-week moving average of weekly claims since January 2000.
The dashed line on the graph is the current 4-week average. The four-week average of weekly unemployment claims decreased this week by 2,500 to 485,500.
Claims for last week were revised up from 473,000 to 478,000. So the level this week is about the same as initially reported last week.
The current level of the 4-week average suggests a weak job market.
Wednesday, September 01, 2010
Personal Bankruptcy Filings: Down from July, Up from August 2009
by Calculated Risk on 9/01/2010 06:54:00 PM
Note: The number of filings is volatile month to month - and August is frequently a bit lower than July.
From the American Bankruptcy Institute: August Consumer Bankruptcy Filings fall 8 Percent this Month
The 127,028 consumer bankruptcies filed in August represented a 8 percent decrease nationwide over the 137,698 filings recorded in July 2010, according to the American Bankruptcy Institute (ABI), relying on data from the National Bankruptcy Research Center (NBKRC). Though a decrease from the previous month, NBKRC’s data also showed that the August 2010 consumer filings represented a 6 percent increase from the 119,874 consumer filings recorded in August 2009. ...
“While monthly filings are volatile, consumer bankruptcies are still the highest they have been since Congress overhauled the bankruptcy law in 2005,” said ABI Executive Director Samuel J. Gerdano. “Consumer filings remain on track to top 1.6 million filings in 2010.”
 Click on graph for larger image in new window.
This graph shows the non-business bankruptcy filings by quarter using monthly data from the ABI and previous quarterly data from USCourts.gov.
In 2005 the so-called "Bankruptcy Abuse Prevention and Consumer Protection Act of 2005" was enacted. Since then the number of bankruptcy filings has increased steadily.
U.S. Light Vehicle Sales 11.5 Million SAAR in August
by Calculated Risk on 9/01/2010 04:00:00 PM
Based on an estimate from Autodata Corp, light vehicle sales were at a 11.47 million SAAR in August. That is down 18.9% from August 2009 (cash-for-clunkers), and down 0.5% from the July sales rate. Click on graph for larger image in new window.
This graph shows the historical light vehicle sales (seasonally adjusted annual rate) from the BEA (blue) and an estimate for August (red, light vehicle sales of 11.47 million SAAR from Autodata Corp).
The high for the year was in March, and sales have moved mostly sideways since then. The second graph shows light vehicle sales since the BEA started keeping data in 1967.
Note: dashed line is current month sales rate. The current sales rate is still below the bottom of the '90/'91 recession - when there were fewer registered drivers and a smaller population.
This was below most forecasts of around 11.6 million SAAR.
Some comments on August ISM Manufacturing Index
by Calculated Risk on 9/01/2010 12:15:00 PM
The Institute for Supply Management reported this morning that the PMI increased to 56.3 from 55.5 in July. Expectations were for a decrease to 53.0. Click on graph for larger image in new window.
Here is an update to the graph showing the regional Fed manufacturing surveys and the ISM index through August.
The Fed surveys suggested that the ISM index would probably decline, but the relationship is noisy. Based on this graph I'd expect either the Fed surveys to bounce back in September - or the ISM to decline. Here is a long term graph that hopefully puts the uptick in August in perspective.
In addition to the increase in the PMI, the production index increased to 59.9 from 57.0, and the employment index increased from 58.6 in July to 60.4. That suggests increased manufacturing employment in August.
However the new orders index declined in August to 53.1 from 53.5 in July (still expanding, but at a slower pace). And the inventory index was up for the 2nd month in a row to 51.4.
This report was somewhat better than expected, but I still expect the index to decline over the next couple of months.
General Motors: Sales off sharply from August 2009
by Calculated Risk on 9/01/2010 11:18:00 AM
Note: Sales in August 2009 were boosted by "Cash-for-clunkers".
From MarketWatch: GM August U.S. sales down 24.9% to 185,176 units
General Motors Co. said Wednesday that U.S. sales in August slumped 24.9% to 185,176 vehicles from 246,479 in August 2009.Note: in August 2009 U.S. light vehicle sales were 14.1 million (SAAR). This was related to "Cash-for-clunkers" - also General Motors emerged from bankruptcy on July 10, 2009.
I'll add reports from the other major auto companies as updates to this post.
Update1: From MarketWatch: Ford U.S. August sales slide 10.7% to 157,503
From MarketWatch: Chrysler U.S. August sales rise 7% to 99,611 units
NOTE: Once all the reports are released, I'll post a graph of the estimated total August light vehicle sales (SAAR: seasonally adjusted annual rate) - usually around 4 PM ET. Most estimates are for an increase to 11.6 million SAAR in August from the 11.5 million SAAR in July.


