 RSS Feed
 by Calculated Risk on 7/19/2010 11:42:00 PM
Monday, July 19, 2010
Update: Unemployment Benefits extension likely to pass
by Calculated Risk on 7/19/2010 07:40:00 PM
Earlier I mentioned I wasn't sure if the unemployment benefit extension would pass - it looks like it will pass tomorrow.
The WSJ reports Senate Set to Extend Jobless Benefits
On Tuesday, Democrats are likely to get the 60 votes they need to extend the benefits through November. ... The House is expected to approve the Senate's version Wednesday and send it to Mr. Obama for his signature.Note: this is an extension of the qualification dates for existing tiers of extended unemployment benefits, not additional weeks of benefits.
Moody's: Commercial Real Estate Price Index increases in May
by Calculated Risk on 7/19/2010 04:40:00 PM
Moody's reported today that the Moody’s/REAL All Property Type Aggregate Index increased 3.6% in May. This is a repeat sales measure of commercial real estate prices.
Below is a comparison of the Moodys/REAL Commercial Property Price Index (CPPI) and the Case-Shiller composite 20 index.
Notes: Beware of the "Real" in the title - this index is not inflation adjusted. Moody's CRE price index is a repeat sales index like Case-Shiller - but there are far fewer commercial sales - and that can impact prices. Click on graph for larger image in new window.
CRE prices only go back to December 2000.
The Case-Shiller Composite 20 residential index is in blue (with Dec 2000 set to 1.0 to line up the indexes).
It is possible that commercial real prices have bottomed - in general - but it is hard to tell because the number of transactions is very low and there are a number of distressed sales.
Commercial real estate values are now down 6.3% over the last year, and down 38.9% from the peak in late 2007.
Comments from PIMCO
As I've noted every month, this is a very thin market that is skewed by distressed sales. John Murray at PIMCO also cautioned about the CPPI index in a recent note: PIMCO U.S. Commercial Real Estate Project
National price indices such as the Moody’s Commercial Property Price Index (CPPI) can provide misleading indications of a recovery in CRE asset price levels. Since November 2009, the index has rebounded 3%.Comments from MIT Professor David Geltner
While it is natural to draw comparisons between the CPPI and the S&P/Case-Shiller index used to gauge residential home prices, we caution that indexes such as the CPPI are relatively meaningless in today’s limited transaction environment – commercial real estate transaction volume fell nearly 90% from 2007 to 2009.
Our ride along meetings highlight another limitation of the CPPI. Based on repeat transactions, the index excludes the truly distressed or overpriced properties acquired in the past few years that have yet to trade, and is instead skewed by the high proportion of trophy asset and Agency-financed multifamily transactions.
Dr. Geltner writes a column that appears on the Real Estate Analytics LLC website on the lower right under "Professor's Corner". This is based on last month's data, but still explains the market dynamics:
CPPI advanced in April, due to the very strong performance of “healthy” properties (i.e., those without the RCA “troubled asset” flag). Figure 4 shows that the healthy property breakout index (estimated using the same methodology as the CPPI only dropping out the “troubled assets”) rose 6.3% from March to April while the “distressed” index declined more than 5%. The “healthy property index” is now only 33% below the October 2007 peak, while properties falling into distress since then are still selling more than 50% below 2007 values on average.
 Graph from Dr. Geltner.
Whereas 2009 saw the advent of a bifurcated market between “healthy” and “distressed” properties, 2010 is now seeing what might be called a “trifurcated” market. Not only are distressed properties selling at sharp discounts, but “trophy” properties and solid “core” assets are selling at very respectable prices well above the general market average.Roughly, CRE prices are moving up for "trophy" properties, moving sideways for the general market, and falling again for distressed properties. But this is based on very few transactions ...
Lawler: Preview on Existing Home Sales
by Calculated Risk on 7/19/2010 03:10:00 PM
CR Note: Last month, housing economist Tom Lawler's forecast was well below the consensus of 6.2 million (SAAR) for May and close to the actual reported existing home sales (he does a bottom up calculation every month, and he has been very close). Here is his preview for this month:
The pace of existing home sales in June varied dramatically across the country in June, with some of the difference reflecting the pace of closings of contracts signed to beat the federal home buyer tax credit. Long Island was a “standout” to the upside, with home closings in June coming in at 73.8% higher than last June, reflecting the longer-than-national norm time to close signed contracts. Most other markets saw materially slower YOY sales growth in June compared to May, with a number of areas seeing YOY declines. And many markets where a year ago sales were dominated by foreclosure sales saw YOY sales declines, with the drops mainly reflecting significantly lower foreclosure sales.
Based on all the data I have so far, I estimate that existing home sales ran at a seasonally adjusted annual rate of about 5.3 million in June, down about 6.4% from May’s pace. July sales, of course, will see a MUCH bigger drop.
On the inventory front, the local realtor/MLS were on balance consistent with my national tracking, which showed active residential listings up about 1.6% from May. I don’t know if the NAR data will show the same thing however; the NAR apparently doesn’t use available national listings but instead uses reports from the sample of realtor/MLS groups it gets each month, and uses that to “gross up” total inventory in a fashion that clearly produces some “spurious” volatility.
CR Note: this was from housing economist Tom Lawler. The National Association for Realtors (NAR) will release the June existing home sales report on Thursday. The consensus is for a decline to 5.3 million sales in June (SAAR, seasonally adjusted annual rate).
Summers: More Fiscal Stimulus Now, Reduce Deficits when economy has recovered
by Calculated Risk on 7/19/2010 01:17:00 PM
Lawrence Summers writes in the Financial Times: America’s sensible stance on recovery
[W]here an economy’s level of output is constrained by demand and the central bank has at best a limited ability to relax that constraint because it cannot reduce interest rates to below zero, fiscal policy can have a significant impact on output and employment.It looks like the only additional stimulus will be an extension of the emergency unemployment benefits - and even that isn't clear.
...[and] there is a very strong presumption that there are likely to be beneficial effects from the expectation that budget deficits will be reduced after an economy has recovered and is no longer demand-constrained.
...
In most of the industrialised world, given that economies are in or near liquidity trap conditions, it is [these] propositions that should control policy. Together they make a case for fiscal actions that maintain or increase demand in the short run while reassuring markets on sustainability over the medium term.
NAHB Builder Confidence falls to lowest level since April 2009
by Calculated Risk on 7/19/2010 10:00:00 AM
Note: any number under 50 indicates that more builders view sales conditions as poor than good. Click on graph for larger image in new window.
This graph shows the builder confidence index from the National Association of Home Builders (NAHB).
The housing market index (HMI) was at 14 in June. This is the lowest level since April 2009.
The record low was 8 set in January 2009, but 14 is very low ... This second graph compares the NAHB HMI (left scale) with single family housing starts (right scale). This includes the July release for the HMI and the May data for starts (June starts will be released tomorrow).
This shows that the HMI and single family starts mostly move generally in the same direction - although there is plenty of noise month-to-month.
Press release from the NAHB: Builder Confidence Declines in July
Builder confidence in the market for newly built, single-family homes declined for a second consecutive month in July to its lowest level since April of 2009, according to the National Association of Home Builders/Wells Fargo Housing Market Index (HMI) released today. The HMI fell two points from a downwardly revised number in the previous month to 14 for July.This suggests futher declines in housing starts. The consensus is for a decrease to 580K (SAAR) in June from 593K in May. I'll take the under.
...
Each of the HMI's component indexes recorded declines in July. The component gauging current sales conditions fell two points to 15, while the component gauging sales expectations in the next six months edged down one point to 21 and the component gauging traffic of prospective buyers fell three points to 10.
Moody's Downgrades Ireland
by Calculated Risk on 7/19/2010 08:33:00 AM
From Matthew Saltmarsh at the NY Times: Moody’s Cuts Ireland’s Credit Rating
Moody’s Investors Service downgraded Ireland one notch, to Aa2 from Aa1 ... Moody’s also changed the outlook on the ratings to stable from negative.And from the WSJ: Spanish Bad Bank Debt Rises
“Today’s downgrade is primarily driven by the Irish government’s gradual but significant loss of financial strength, as reflected by its deteriorating debt affordability,” said Dietmar Hornung, a senior credit officer at Moody’s.
Bad debt held by Spanish banks topped €100 billion ($129 billion) for the first time in May, as more companies filed for bankruptcy and unemployment continued to rise amid the economic downturn.On Friday, the Committee of European Banking Supervisors (CEBS) will release the stress test results for 91 European Banks.
This ties in with the Sovereign debt series too!
Sunday, July 18, 2010
This and that ...
by Calculated Risk on 7/18/2010 09:18:00 PM
First, some earlier posts:
And some more stories:
Hungarian assets could come under selling pressure on Monday after the International Monetary Fund and European Union postponed the conclusion of a budgetary review in Budapest, insisting that the government must rethink its proposals.
excerpt with permission
Part 5A. What Happens If Things Go Really Badly? $15 Trillion of Sovereign Debt in Default
by Calculated Risk on 7/18/2010 03:48:00 PM
Here is the Weekly Summary and a look ahead (Housing, Bernanke testimony, Euro stress tests all coming up).
CR Note: This series is from reader "some investor guy".
In order to keep the Really Bad scenario from becoming massively long, it’s in several pieces. This one is only on sovereign defaults. There will be more on swaps and banking later in the week.
How likely or unlikely is the “Really Bad” scenario?
The author has built a number of risk simulation models for various purposes. Choosing scenarios or simulation outputs which show things going really badly involves some tradeoffs. There is always that small probability of Earth being hit by a huge asteroid resulting in mass extinction. I usually leave such events out of my models. Wars and disease are tough items to model, but government financial problems are often related. More on those in Part 6.
There is a strong tendency among people who are not researchers or modelers to think a particular bad scenario can’t or won’t occur. If you want to get attention from management or regulators and motivate them to do something, one effective technique is to show what would happen if something very similar to prior history repeated itself. When they say “there’s no way that many sovereigns could default at once”, you pull out the numbers and show them that it’s actually occurred several times in the past.
People who don’t do statistics are usually drawn to individual stories or scenarios. I look for scenarios which are informative about risks that might be mitigated in some way. It’s frustrating for everyone involved if they believe what you are presenting, but then can’t do anything about the risks or other problems.
So, out of the multitude of potential scenarios, I have settled upon one which is really bad, but doesn’t involve asteroids, mass extinctions, or apes taking over. It is consistent with prior bad episodes of sovereign debt default.
Here is the Really Bad scenario. It’s not a worst possible scenario. It is more like the Long Depression or the Great Depression reoccurring under 2010 conditions.
In the Really Bad scenario, 45% of the countries with large outstanding sovereign debts are in default within a 2-3 year period.
 Click on graph for larger image in new window.
As we saw in Part 2B, levels between 40% and 50% of sovereigns in default have been reached five times in the last two centuries, (1830s, 1840s, 1880s, 1930s, 1940s, source: Eight Centuries of Financial Crises, page 4).
So, who defaults? A simple method is to choose the 45% of countries with large sovereign debts (over $50 billion) that currently have the highest cumulative probability of default. They are assumed to default in the same order as implied by their cumulative probability of default at 6/30/10 from CMA: Greece, Argentina (again), Portugal, Ireland, Spain, Italy, Turkey, Indonesia, Belgium, South Africa, Thailand, South Korea, Poland, Brazil, Mexico and Malaysia.
This involves about $5.6 trillion of debt in default, about 16% of all sovereign debt. If historic trends repeat themselves, it all happens within about two years of the first default (Greece), and 11 home currencies are involved. At the low end recovery rate of 31% of face value, there are about $3.8 trillion of losses. This is about 2-3 times the amount currently embodied in credit default swap pricing which we calculated in Part 4 ($1.3-1.8 trillion).
But then, since this is a really bad scenario, Japan defaults too. This might occur because of a global economic slowdown, a rise in general risk premiums and interest rates raising Japan’s debt service (this could take longer, Japan’s average maturity is 5-6 years), Japan’s banking system being affected by defaults elsewhere in the world, lack of political will to make reforms, or several other mechanisms.
For those of you who say Japan’s default is an incredibly unlikely event, note the following. Many officials have a long term concern about Japan. If there are many other sovereign defaults, the time frame could speed up considerably.
1. Prime Minister Naoto Kan said “We cannot sustain public finance that overly relies on issuing bonds," Kan told parliament in his first policy speech. As we can see in the euro zone confusion that started from Greece, there is a risk of default if the growing public debt is neglected and if trust is lost in the bond market."
2. In the last year, the price of Japanese CDS have tripled. CMAVision estimates a 5 year probability of default of 8.3% from their CDS prices at June 30, 2010.
3. Japan has the highest debt to GDP ratio of any developed country. It is expected to reach 225% of GDP in 2010 (Source: The Outlook for Financing Japan’s Public Debt, IMF 2010)
4. “Japan is in danger of a slow motion sovereign debt crisis 5 to 10 years from now, warns Kenneth Rogoff, professor of public policy & economics at Harvard University.”
5. The IMF modeled the effect of sovereign defaults elsewhere on Japan. They found “Sovereign debt crisis and increased risk premium. Assessing the macroeconomic implications of a sharp rise in government bond yields, this scenario assumes an increase in the risk premium by 100 basis points for the U.S. and 200 basis points for the euro area without offsetting fiscal policy. If the risk premium in Japan remains unaffected, growth would slow through the export and exchange rate channel by between 0.5 to 1 percentage points in 2010. If, on the other hand, the risk premium in Japan also increases (by 100 basis points), growth could fall by as much as 2 percentage points. Given depressed demand, deflation would worsen by about 0.5to 1 percentage point below the baseline in 2011.” (source: IMF, Japan Staff Report for the 2010 Article IV Consultation, June 2010).
Japan has over a quarter of all sovereign debt outstanding worldwide. It’s default would be bigger than all of the others in this scenario combined.
 In our Really Bad scenario, another $9.7 trillion in sovereign debt goes into default. The total debt in default reaches $15.3 trillion, and almost half of all outstanding sovereign debt is in default. The losses are $10.5 trillion at the low end recovery rate of 31%.
At the low end, losses are $7.5 trillion (50% of face value). Of course, recoveries in some countries will be higher than others, but you get the general idea.
Next up: Part 5B. What Happens If Things Go Really Badly? More Things Can Go Badly: Credit Default Swaps, Interest Swaps and Options, Foreign Exchange.
Disclosure on Some Investor Guy: Based in the US, I currently own no foreign sovereigns. I do own some foreign bank bonds. Unless cited to another source, all research and opinions are my own, and could differ from just about anyone, potentially including: the firm I work for, regulators, politicians, the bond market, the CDS market, academics, doomers, polyannas, and people who are trying to sell you something. Nothing in the series is legal or investment advice, nor advice to buy or sell investments, concrete, remote doomsteads, or canned goods. Renting copies of Mad Max videos may be entertaining, however science fiction movies are no indication of future real world performance.
CR Note: This is from "Some investor guy".
Series:
• Part 1: How Large is the Outstanding Value of Sovereign Bonds?
• Part 2. How Often Have Sovereign Countries Defaulted in the Past?
• Part 2B: More on Historic Sovereign Default Research
• Part 3. What are the Market Estimates of the Probabilities of Default?
• Part 4. What are Total Estimated Losses on Sovereign Bonds Due to Default?
• Part 5A. What Happens If Things Go Really Badly? $15 Trillion of Sovereign Debt in Default
• Part 5B. Part 5B. What Happens If Things Go Really Badly? More Things Can Go Badly: Credit Default Swaps, Interest Swaps and Options, Foreign Exchange
• Part 5C. Some Policy Options, Good and Bad
• Part 5D. European Banks, What if Things Go Really Badly?
Weekly Summary and a Look Ahead
by Calculated Risk on 7/18/2010 11:29:00 AM
Three housing related reports will be released this week: the NAHB builder confidence survey on Monday, housing starts on Tuesday, and existing home sales on Thursday. Fed Chairman Bernanke will report to the Senate and House on Wednesday and Thursday, and on Friday, the European bank stress test results will be released.
Here is the daily schedule:
On Monday, the July NAHB homebuilder survey will be released at 10 AM. The consensus is for another low reading at about the same level as June (17).
On Tuesday, Housing Starts for June will be released at 8:30 AM. The consensus is for a decrease to 580K (SAAR) in June from 593K in May. Based on builder comments, I'll take the under again this month.
Also on Tuesday, the BLS will release the Regional and State Employment and Unemployment report for June at 10 AM.
On Wednesday, the AIA's Architecture Billings Index for June will be released (a leading indicator for commercial real estate). Also on Wednesday, the MBA will release the mortgage purchase applications index. This has fallen to the lowest level in over 13 years suggesting weak home sales will be reported in July and later this year.
On Wednesday, starting at 10 AM ET, Fed Chairman Ben Bernanke will report to the Senate Banking Committee: The Semiannual Monetary Policy Report to the Congress
Possibly on Wedneday, the Moodys/REAL Commercial Property Price Index (for May) will also be released.
On Thursday, the initial weekly unemployment claims report will be released. Consensus is for an increase to 450K from 429K last week.
Also on Thursday, the National Association for Realtors (NAR) will release the June existing home sales report. The consensus is for a decline to 5.3 million sales in June (SAAR, seasonally adjusted annual rate), from 5.66 million in May. A key number in the release will be existing home inventory. Inventory has increased year-over-year for the last two months, and this suggests that the months-of-supply will be in double digits later this summer.
Also on Thursday, starting at 9:30 AM ET, Fed Chairman Ben Bernanke will report to the House Financial Services Committee: Monetary Policy and the State of the Economy. The report will be the same as for the Senate, but the Q&A might be interesting.
Also on Thursday, the FHFA house price index, and the Conference Board's index of leading indicators will be released.
On Friday, the Committee of European Banking Supervisors (CEBS) will release the stress test results for 91 European Banks. And the FDIC will probably be busy too ...
And a summary of last week:
On a monthly basis, retail sales decreased 0.5% from May to June (seasonally adjusted, after revisions), and sales were up 4.8% from June 2009.
 Click on graph for larger image in new window.
This graph shows retail sales since 1992.
This is monthly retail sales, seasonally adjusted (total and ex-gasoline).
Retail sales are up 7.3% from the bottom, but still off 5.2% from the pre-recession peak. Retail sales have declined for two consecutive months. This was another weak report, and the decline in sales was worse than expected.
The Census Bureau reports:
[T]otal May exports of $152.3 billion and imports of $194.5 billion resulted in a goods and services deficit of $42.3 billion, up from $40.3 billion in April, revised.
 This graph shows the U.S. trade deficit, with and without petroleum, through May.
With oil prices and volumes down, oil imports decreased sharply in May, however other imports - especially from China - increased significantly. Most of the increase in the trade deficit since last year has been related to oil, but now it appears the ex-oil deficit is increasing sharply again.
Note: the lower than expected retail sales, and higher than expected trade deficit, have lead to several key analysts downgrading Q2 real GDP growth to around 2% annualized.
 From the Association of American Railroads: Rail Time Indicators. The AAR reports traffic in June 2010 was up 10.6% compared to June 2009 - but traffic was still 10.2% lower than in June 2008.
This graph shows U.S. average weekly rail carloads.
From AAR:
On a seasonally adjusted basis, U.S. rail carloads fell 1.3% in June 2010 from May 2010, following a 1.1% decline in May 2010 from April 2010. After bottoming out in May 2009, seasonally adjusted rail carloads trended upward, with some fits and starts along the way, through April 2010. They’ve now declined for two consecutive months. ... an economy several months into a recovery from the worst recession in decades should be yielding rail traffic levels heading north, not south.
 This graph shows the national LoanPerformance data since 1976. January 2000 = 100.
The index is up 2.9% over the last year, and off 28.5% from the peak.
CoreLogic expects prices to "moderate and possibly decline". I think this index will show a further price increase in June, as tax credit related existing home sales close. But I expect the index will show declines by the end of summer and into the fall.
 The Fed reported:
Industrial production edged up 0.1 percent in June ... capacity utilization rate for total industry remained unchanged in June at 74.1 percent, a rate 5.9 percentage points above the rate from a year earlier but 6.5 percentage points below its average from 1972 to 2009.This graph shows Capacity Utilization. This series is up 8.7% from the record low set in June 2009 (the series starts in 1967).
Capacity utilization at 74.1% is still far below normal - and well below the the pre-recession levels of 81.2% in November 2007.
 From Reuters: Consumer Sentiment Sinks To Lowest in 11 Months
 The survey's preliminary July reading on the overall index on consumer sentiment plummeted to 66.5 from 76.0 in June.Consumer sentiment is a coincident indicator - and this is further evidence of an economic slowdown.
Best wishes to all.
SoCal: Office Vacancy Rate increases, Rents Fall
by Calculated Risk on 7/18/2010 08:45:00 AM
From Roger Vincent at the Los Angeles Times: Office vacancies rise, rents drop in Southland again
Overall vacancy in Los Angeles, Orange, San Bernardino and Riverside counties rose to nearly 20% from 17% a year earlier, while average asking rents dropped to $2.37 a square foot per month from $2.52 ...More excess supply, but at least the new construction has stopped.
The weakest market was the Inland Empire, where vacancy surpassed 25% in the second quarter. Orange County was also weak, with 22% of its office space unleased.
Saturday, July 17, 2010
Double Dip Discussion
by Calculated Risk on 7/17/2010 07:47:00 PM
The frequency of "double dip" searches keeps increasing, see Google Trends ...
Paul Krugman writes: De Facto Double Dips
Let’s be clear: a recovery that involves growth so slow that unemployment and excess capacity rise, not fall, isn’t really a recovery. If we have only have 1 1/2 percent growth, that will amount to a double dip in all the senses that matter.I've been focused on a technical double dip (see Recession Dating and a "Double Dip"), but I agree with Krugman that a further slowdown - following the below trend first half of 2010 - will definitely feel like a recession - and it will probably lead to an unemployment rate "double dip".
And from Nouriel Roubini: Double-Dip Days
The global economy, artificially boosted since the recession of 2008-2009 by massive monetary and fiscal stimulus and financial bailouts, is headed towards a sharp slowdown this year as the effect of these measures wanes.The 2nd half slowdown is here. I still think we will avoid a technical double-dip recession, but it will probably feel like one.
...
At best, we face a protracted period of anemic, below-trend growth in advanced economies as deleveraging by households, financial institutions, and governments starts to feed through to consumption and investment.
...
The global slowdown – already evident in second-quarter data for 2010 – will accelerate in the second half of the year. ... The likely scenario for advanced economies is a mediocre U-shaped recovery, even if we avoid a W-shaped double dip. In the US, annual growth was already below trend in the first half of 2010 (2.7% in the first quarter and estimated at a mediocre 2.2% in April-June). Growth is set to slow further, to 1.5% in the second half of this year and into 2011.
...
Fasten your seat belts for a very bumpy ride.
Some day growth will pickup again. The debt problems will be with us for some time, but one of the keys for more growth is absorption of excess capacity. New investment is already happening for semiconductor manufacturing (see AMAT and other semi-equipment manufactures, and the WSJ Applied Materials Boosts Revenue Forecast)
But there is too much capacity in most of the economy. We see this in housing (the good news is there will be a record low number of new housing units delivered this year), and in overall industrial capacity utilization. As an example, domestic auto production is still about 25% below the level of 2006 - so there is no need to expand production. There is also excess capacity in office space, retail space, and other categories of commercial real estate.
The U.S. population is still growing, new households are being formed, and eventually this excess capacity will be absorbed. Until then the recovery will be sluggish and choppy (at best) ... and there are still the debt issues.
As Nouriel wrote: "Fasten your seat belts for a very bumpy ride."
Unofficial Problem Bank List at 796 Institutions
by Calculated Risk on 7/17/2010 04:13:00 PM
Note: this is an unofficial list of Problem Banks compiled only from public sources.
Here is the unofficial problem bank list for July 16, 2010.
Changes and comments from surferdude808:
The Unofficial Problem Bank List underwent several changes this week as the FDIC resumed shuttering banks and the OCC release their actions through the middle of June. There were nine additions and nine deletions, which leaves the total number of institutions on the Unofficial Problem Bank List unchanged at 796.
Deletions include the six failed institutions -- First National Bank of the South ($682 million Ticker: FNSC), Metro Bank of Dade County ($442 million), Woodlands Bank ($379 million), Turnberry Bank ($263 million), Olde Cypress Community Bank ($169 million), and Mainstreet Savings Bank, FSB ($97 million Ticker: MSFN). Other removals for action termination include West Coast Bank ($2.7 billion Ticker: WCBO), First National Community Bank ($155 million), and The First National Bank of Logan ($25 million).
Additions include Monroe Bank & Trust, Monroe, MI ($1.4 billion Ticker: MBTF); Bank of Whitman, Colfax, WA ($786 million); American Bank of Texas, National Association, Marble Falls, TX ($756 million); Landmark Bank, National Association, Fort Lauderdale, FL ($351 million); The Central National Bank of Alva, Alva, OK ($246 million); Pilot Bank, Tampa, FL ($238 million); Trans-Pacific National Bank, San Francisco, CA ($176 million); The First National Bank of Grant Park, Grant Park, IL ($123 million); and Community National Bank at Bartow, Bartow, FL ($75 million).
Other changes include the OTS issuing a Prompt Corrective Action order against Bayside Savings Bank ($66 million) and the OCC converting a Formal Agreement to a Consent Order against Merchants Bank of California, National Association ($91 million). Next week, we anticipate the FDIC will release its actions for June, so the list will likely undergo many changes.
Another example of state and local government distress
by Calculated Risk on 7/17/2010 11:48:00 AM
From Lauren Etter at the WSJ: Roads to Ruin: Towns Rip Up the Pavement
Paved roads ... are being torn up across rural America and replaced with gravel or other rough surfaces as counties struggle with tight budgets and dwindling state and federal revenue. State money for local roads was cut in many places amid budget shortfalls.Back to the stone age ...
Sovereign Debt Series Summary
by Calculated Risk on 7/17/2010 08:24:00 AM
For those that missed any part of the series ...
Part 1: How Large is the Outstanding Value of Sovereign Bonds?
Part 2. How Often Have Sovereign Countries Defaulted in the Past?
Part 2B: More on Historic Sovereign Default Research
Part 3. What are the Market Estimates of the Probabilities of Default?
Part 4. What are Total Estimated Losses on Sovereign Bonds Due to Default?
UPDATE on Sunday: Part 5A. What Happens If Things Go Really Badly? $15 Trillion of Sovereign Debt in Default
Coming soon: Part 5B. What Happens If Things Go Really Badly? More Things Can Go Badly: Credit Default Swaps, Interest Swaps and Options, Foreign Exchange.
Friday, July 16, 2010
A quick summary of the week
by Calculated Risk on 7/16/2010 11:59:00 PM
I'll have the weekly summary on Sunday, but the news flow was definitely downbeat.
Chase Homeowner Assistance Event comes to Orange County
by Calculated Risk on 7/16/2010 09:33:00 PM
I think this is a traveling road show, but the size is pretty amazing ... I'll try to drop by next week. From the O.C. Register: 5-day loan mod event starts Friday
Chase is having a 5-day event in Costa Mesa to help struggling homeowners who have Chase, EMC or WaMu-serviced mortgages.Local Sign at bus stop, photo credit: Bill
...
More than 50 of Chase’s home loan counselors will be available ...
Bill writes: "There must be a lot of troubled
Bank Failures #92 to #96: Florida, Michigan, South Carolina
by Calculated Risk on 7/16/2010 06:13:00 PM
Grim Reaper scythes down the weeds
Only stubble left
by Soylent Green is People
From the FDIC: NAFH National Bank, Miami, Florida, Acquires All the Deposits of Two Institutions in Florida and One Institution in South Carolina
Metro Bank of Dade County, Miami, Turnberry Bank, Aventura, Florida, and First National Bank of the South, Spartanburg, South Carolina
As of March 31, 2010, Metro Bank of Dade County had total assets of $442.3 million and total deposits of $391.3 million; Turnberry Bank had total assets of $263.9 million and total deposits of $196.9 million; and First National Bank of the South had total assets of $682.0 million and total deposits of $610.1 million.From the FDIC: CenterState Bank of Florida, National Association, Winter Haven, Florida, Assumes All of the Deposits of Olde Cypress Community Bank, Clewiston, Florida
...
The FDIC estimates that the cost to the Deposit Insurance Fund (DIF) for Metro Bank of Dade County will be $67.6 million; for Turnberry Bank, $34.4 million; and for First National Bank of the South, $74.9 million.
...
These closings bring the total for the year to 94 banks in the nation, and the fifteenth and sixteenth in Florida and the third in South Carolina. Prior to these failures, the last bank closed in Florida was Peninsula Bank, Englewood, on June 25, 2010, and the last bank closed in South Carolina was Woodlands Bank, Bluffton, earlier today.
As of March 31, 2010, Olde Cypress Community Bank had approximately $168.7 million in total assets and $162.4 million in total deposits.From the FDIC: Commercial Bank, Alma, Michigan, Assumes All of the Deposits of Mainstreet Savings Bank, FSB
...
The FDIC estimates that the cost to the Deposit Insurance Fund (DIF) will be $31.5 million. ... Olde Cypress Community Bank is the 95th FDIC-insured institution to fail in the nation this year, and the seventeenth in Florida. The last FDIC-insured institution closed in the state was Turnberry Bank, Aventura, earlier today.
As of March 31, 2010, Mainstreet Savings Bank, FSB had approximately $97.4 million in total assets and $63.7 million in total deposits.Will we see 100 today?
...
The FDIC estimates that the cost to the Deposit Insurance Fund (DIF) will be $11.4 million. ... Mainstreet Savings Bank, FSB is the 96th FDIC-insured institution to fail in the nation this year, and the fourth in Michigan. The last FDIC-insured institution closed in the state was New Liberty Bank, Plymouth, on May 14, 2010.
Bank Failure #91: Woodlands Bank, Bluffton, South Carolina
by Calculated Risk on 7/16/2010 05:09:00 PM
Woodlands Bank squanders their trust
Grasshoppers rescued
by Soylent Green is People
From the FDIC: Bank of the Ozarks, Little Rock, Arkansas, Assumes All of the Deposits of Woodlands Bank, Bluffton, South Carolina
As of March 31, 2010, Woodlands Bank had approximately $376.2 million in total assets and $355.3 million in total depositsFriday arrives ...
...
The FDIC estimates that the cost to the Deposit Insurance Fund (DIF) will be $115.0 million. ... Woodlands Bank is the 91st FDIC-insured institution to fail in the nation this year, and the second in South Carolina. The last FDIC-insured institution closed in the state was Beach First National Bank, Myrtle Beach, on April 9, 2010.
Mortgage Repurchase: The growing writedown
by Calculated Risk on 7/16/2010 02:01:00 PM
Another graph from the BofA Second Quarter 2010 Earnings Presentation (ht Brian)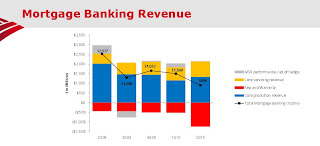 Click on graph for larger image in new window.
This graph shows the components of BofA mortgage banking revenue. The increasing red contribution is from "Rep and warranty" - these are the loans being pushed back on BofA. The second graph/chart is from First Horizon National's second quarter presentation (page 8).
Notice the pipeline of repurchase requests continues to grow, the high rescission rate of 40-50%, and the loss severity of 50-55% (the loss to First Horizon on mortgages they have to repurchase).
Note: the FHFA issued subpoenas last week "seeking documents related to private-label mortgage-backed securities" in which Fannie Mae and Freddie Mac invested. That could lead to more repurchase requests for the Wall Street banks.


