 RSS Feed
 by Calculated Risk on 6/13/2010 09:15:00 PM
Sunday, June 13, 2010
Small businesses "collapse" around the Gulf
Here is the Weekly Summary and a Look Ahead
From Kim Murphy at the LA Times: As businesses collapse, claimants still waiting for checks from BP
Across the gulf, residents already shellshocked by the tar balls, oil soup and dead sea life washing up on their beaches are now getting hit with a second wave: the sudden collapse of their livelihoods, and the equally intimidating challenge of getting BP to pay for it.One real estate agent said his "phone quit ringing a month ago", but is that because of the oil gusher or other factors? This will takes years to sort out ...
...
Hotels, restaurants, machine shops, bars, tour companies all became collateral damage when the Gulf of Mexico ... became an industrial cleanup site.
Concern about auto sales
by Calculated Risk on 6/13/2010 05:31:00 PM
From Neal Boudette and Sharon Terlep at the WSJ: Auto-Sales Optimism Fades
According to AutoData, light vehicle sales were up 17.2% over the first five months of 2010 - compared to the same period in 2009. This was an increase from 3.95 million to 4.63 million cars and light trucks.
However - according to Boudette and Terlep - fleet sales were up 32% during the first five months, and sales to individuals were only up 13%.
And without individual buyers it will be hard to maintain sales growth.
George Pipas, the top sales analyst at Ford Motor Co., said he is seeing evidence that consumers are deferring decisions on major purchases, in large part because home values and income growth haven't rebounded.It will be sometime before home values increase significantly (I expect further price declines later this year), and income growth in most industries will be muted with high unemployment. So we should probably expect the growth in auto sales to slow significantly.
"These are two things that really have to happen before you will see auto sales move up more significantly," Mr. Pipas said.
Weekly Summary and a Look Ahead
by Calculated Risk on 6/13/2010 11:59:00 AM
Two housing related reports will be released this week: the NAHB builder confidence survey on Tuesday and housing starts on Wednesday.
On Tuesday, the June Empire State manufacturing survey will be released at 8:30 AM. The consensus is for a slight increase from the May reading. Also on Tuesday, the June NAHB homebuilder survey will be released at 10 AM. The consensus is for about the same level as May.
Also on Tuesday, St. Louis Fed President James Bullard will speak on "Getting Serious About Asset Bubbles and Monetary Policy" in Hong Kong at 6:15 AM ET.
On Wednesday, Housing Starts for May will be released at 8:30 AM. The consensus is for a 3.3% decrease to 650K (SAAR) in May from 672K in April. Based on the sharp decline for permits in April, starts might fall even further in May (I'll take the under this month). Also at 8:30 AM, the BLS will release the Producer Price Index (PPI) for May. The consensus is for a decrease of 0.5%.
Also on Wednesday, the MBA will release the mortgage purchase applications index. This has been falling sharply suggesting a sharp decline in home sales after the expiration of the tax credit. And the Federal reserve will release the May Industrial Production and Capacity Utilization report at 9:15 AM. Expectations are for production to increase 1% and capacity utilization to increase to 74.5% (the highest levels since late 2008).
On Thursday, the May Consumer Price Index (CPI) will be released at 8:30 AM. The consensus is for a 0.2% decrease in prices. Also on Thursday, the closely watched initial weekly unemployment claims will be released. Consensus is for a decline to 450K from 456K last week. Also on Thursday, the Philly Fed survey and the Conference Board's index of leading indicators will both be released at 10 AM.
And on Friday, the BLS will release the Regional and State Employment and Unemployment report for May at 10 AM. And of course the FDIC will probably have another busy Friday afternoon ...
And a summary of last week:
On a monthly basis, retail sales decreased 1.2% from April to May (seasonally adjusted, after revisions), and sales were up 6.9% from May 2009 (easy comparison).
 Click on graph for larger image in new window.
This graph shows retail sales since 1992. This is monthly retail sales, seasonally adjusted (total and ex-gasoline).
The red line shows retail sales ex-gasoline and shows the increase in final demand ex-gasoline has been sluggish.
Retail sales are up 8% from the bottom, but still off 4.6% from the pre-recession peak.
 This graph shows the MBA Purchase Index and four week moving average since 1990.
The purchase index has collapsed following the expiration of the tax credit suggesting home sales will fall sharply too. This is the lowest level for the purchase index since February 1997. From the MBA:
“Purchase and refinance applications dropped this week, even after an adjustment for the Memorial Day holiday. Purchase applications are now 35 percent below their level of four weeks ago, as homebuyers have not yet returned to the market following the expiration of the homebuyer tax credit at the end of April,” said Michael Fratantoni, MBA’s Vice President of Research and Economics.
 The Association of American Railroads reported traffic in May 2010 was up 15.8% compared to May 2009 - and traffic was still 11.8% lower than in May 2008.
This graph shows U.S. average weekly rail carloads. Traffic increased in 18 of 19 major commodity categories YoY.
From AAR:
U.S. railroads averaged 294,758 carloads per week in April 2010 and 288,793 in March 2010. Thus, May 2010’s average was actually down slightly from those months ... One month does not a trend make, but it would obviously be worrisome if the decline continued.
The Census Bureau reports:
[T]otal April exports of $148.8 billion and imports of $189.1 billion resulted in a goods and services deficit of $40.3 billion, up from $40.0 billion in March, revised. April exports were $1.0 billion less than March exports of $149.8 billion. April imports were $0.8 billion less than March imports of $189.9 billion.
 This graph shows the U.S. trade deficit, with and without petroleum, through April.
The blue line is the total deficit, and the black line is the petroleum deficit, and the red line is the trade deficit ex-petroleum products.
Although both imports and exports were off slightly in April, both have been increasing sharply - but are still below the pre-crisis levels. Once again China and oil are the major contributors to the trade deficit.
Best wishes to all.
Obama Pushes for $50 Billion in State Aid
by Calculated Risk on 6/13/2010 08:13:00 AM
From Jackie Calmes and Sheryl Gay Stolberg at the NY Times: Obama Presses for Aid to Cities and States
President Obama on Saturday implored Congress to provide more aid to states and cities to blunt “the devastating economic impact of budget cuts” by local governments that imperil the jobs of teachers, the police, firefighters and other public employees.The WaPo quotes Obama as writing there will be "massive layoffs of teachers, police and firefighters" without the additional funds.
In a letter to Democratic and Republican Congressional leaders, Mr. Obama said the “mounting employment crisis” in the states “could set back the pace of our economic recovery.” ... education secretary, Arne Duncan, has said that without federal aid, up to 300,000 fewer teachers would be in classrooms this fall ...
Saturday, June 12, 2010
FHA Reform Bill Passes House
by Calculated Risk on 6/12/2010 10:11:00 PM
Just an update on H.R. 5072: FHA Reform Act of 2010
The bill passed in the house 406-4. This bill has several provisions, but a key for the housing market is the increase in the maximum annual premium payments for mortgage insurance.
The current maximum is an annual premium of 0.50% of the outstanding principal balance for loans with the original principal obligation under 95% LTV, and 0.55% for loans with the original principal obligation over 95% LTV.
This legislation will increase the maximums to 1.50% and 1.55% respectively.
The proposed effective date is September 30, 2010. There is no senate version yet.
Unofficial Problem Bank List: 760 Institutions
by Calculated Risk on 6/12/2010 04:09:00 PM
This is an unofficial list of Problem Banks compiled only from public sources.
Here is the unofficial problem bank list for June 11, 2010.
Changes and comments from surferdude808:
Extremely quiet week for the Unofficial Problem Bank List as the OCC did not release its actions for May. No doubt that will happen next week.CR Note: A special thanks to surferdude808 for tracking all the institutions and compiling this list (no one else is doing this).
Only three changes to report. There were two removals -- the failed Washington First International Bank ($521 million) and an action termination by the OCC against Mission Oaks National Bank ($187 million Ticker: MOKB).
The other change is an updated Prompt Corrective Action against Imperial Savings and Loan Association ($9.6 million).
The Unofficial Problem Bank List stands at 760 institutions with aggregate assets of $385 billion.
Q1 2010: Mortgage Equity Withdrawal strongly Negative
by Calculated Risk on 6/12/2010 01:15:00 PM
Note: This is not Mortgage Equity Withdrawal (MEW) data from the Fed. The last MEW data from Fed economist Dr. Kennedy was for Q4 2008. My thanks to Jim Kennedy and the other Fed contributors for the previous MEW updates. For those interested in the last Kennedy data, here is a post, and the spreadsheet from the Fed is available here.
The following data is calculated from the Fed's Flow of Funds data and the BEA supplement data on single family structure investment. This is an aggregate number, and is a combination of homeowners extracting equity (hence the name "MEW", but there is very little MEW right now!), normal principal payments and debt cancellation. Click on graph for larger image in new window.
For Q1 2010, the Net Equity Extraction was a record low of minus $122 billion, or a negative 4.4% of Disposable Personal Income (DPI). This is not seasonally adjusted.
This graph shows the net equity extraction, or mortgage equity withdrawal (MEW), results, using the Flow of Funds (and BEA data) compared to the Kennedy-Greenspan method.
The Fed's Flow of Funds report showed that the amount of mortgage debt outstanding declined sharply in Q1, and this was probably mostly because of debt cancellation per foreclosure sales, and some from modifications, and partially due to homeowners paying down their mortgages as opposed to borrowing more. Note: most homeowners pay down their principal a little each month unless they have an IO or Neg AM loan, so with no new borrowing, equity extraction would always be slightly negative.
Mark Whitehouse at the WSJ argues: Default, Not Thrift, Pares U.S. Debt
The falling debt burden conjures up images of a nation seeking to repent after a decade of profligacy, conscientiously paying down mortgages and credit-card balances. That may be true in some cases, but it’s not the norm. In fact, people are making much more progress in shedding their debts by defaulting on mortgages and reneging on credit cards.I think that is correct - most of the decline in mortgage debt outstanding is probably because of debt cancellations via foreclosures, short sales, and some modifications.
N.Y. State "classic budgetary sleight-of-hand"
by Calculated Risk on 6/12/2010 08:38:00 AM
From Danny Hakim at the NY Times: New York Plan Makes Fund Both Borrower and Lender (ht jb)
Gov. David A. Paterson and legislative leaders have tentatively agreed to allow the state and municipalities to borrow nearly $6 billion to help them make their required annual payments to the state pension fund.Oh my ...
And, in classic budgetary sleight-of-hand, they will borrow the money to make the payments to the pension fund — from the same pension fund.
Daily Show: More Spilling Fields
by Calculated Risk on 6/12/2010 12:49:00 AM
Since we all need a laugh ...
| The Daily Show With Jon Stewart | Mon - Thurs 11p / 10c |
| The Spilling Fields - BP Ad Campaign | |
Friday, June 11, 2010
Bank Failure #82: Washington First International Bank, Seattle, WA
by Calculated Risk on 6/11/2010 08:11:00 PM
Sucked up TARP funds like sponges
Wrung dry by losses
by Soylent Green is People
From the FDIC: East West Bank, Pasadena, California, Assumes All of the Deposits of Washington First International Bank, Seattle, Washington
As of March 31, 2010, Washington First International Bank had approximately $520.9 million in total assets and $441.4 million in total deposits. ...It wouldn't be Friday without a bank failure ...
The FDIC estimates that the cost to the Deposit Insurance Fund (DIF) will be $158.4 million. .... Washington First International Bank is the 82nd FDIC-insured institution to fail in the nation this year, and the seventh in Washington. The last FDIC-insured institution closed in the state was Frontier Bank, Everett, on April 30, 2010.
Housing Tax Credit Fraud Extension
by Calculated Risk on 6/11/2010 06:20:00 PM
No one could have predicted ...
James Hagerty at the WSJ has the story: Tax Credit Extension Could Help Tax Cheaters. Hagerty discusses comments from two real estate agents: Glenn Kelman, chief executive of Redfin Corp. who noted that some customers who signed contracts after April 30th were pushing to close by June 30th. Kelman suspects fraud. And Schahrzad Berkland, an agent for Fidelity Pacific Real Estate in San Diego who noticed that pending sales for April have continued to rise ... something that is very odd. (Note to FBI: more fraud for you guys!)
I noted yesterday: "I'm sure some people will commit fraud and backdate documents."
Extending the closing date will encourage even more fraud. All the mortgage lenders have been giving priority to purchase applications over refinance applications, and 60 days is more than enough time.
If short sales are a problem, then make the extension very narrow - a 30 day extension for short sales, with the servicer processing the short sale certifying that it was 1) a short sale and 2) that they were in possession of a signed contract by April 30th (with a significant penalty for a false statement).
Otherwise this extension should be titled the "Housing Tax Credit Fraud Extension Amendment". Geesh ...
LA Port Traffic: Imports Surge Year-over-year in May
by Calculated Risk on 6/11/2010 03:58:00 PM
Notes: this data is not seasonally adjusted. There is a very distinct seasonal pattern for imports, but not for exports. LA area ports handle about 40% of the nation's container port traffic.
Sometimes port traffic gives us an early hint of changes in the trade deficit. The following graph shows the loaded inbound and outbound traffic at the ports of Los Angeles and Long Beach in TEUs (TEUs: 20-foot equivalent units or 20-foot-long cargo container). Although containers tell us nothing about value, container traffic does give us an idea of the volume of goods being exported and imported.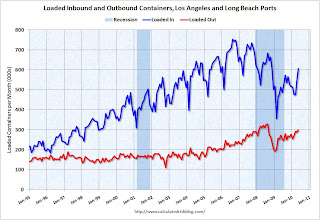 Click on graph for larger image in new window.
Loaded inbound traffic was up 18.3% compared to May 2009. Inbound traffic was still down 5% vs. two years ago (May 08).
Loaded outbound traffic was up 9.4% from May 2009. Just as with imports, exports are still off from 2 years ago (off 7.3%).
For imports there is usually a significant dip in either February or March, depending on the timing of the Chinese New Year, and then usually imports increase until late summer or early fall as retailers build inventory for the holiday season. So this increase in May imports is part of the normal seasonal pattern.
Based on this data, it appears the trade deficit with Asia increased in May. Once again it appears imports are increasing faster than exports and the pre-crisis global imbalances have returned.
Report: FBI to "arrest hundreds of people" next week for Mortgage Fraud
by Calculated Risk on 6/11/2010 01:20:00 PM
From the Financial Times: FBI to target mortgage fraud
The FBI is preparing to arrest hundreds of people across the US as early as next week for offences including encouraging borrowers to falsify income on mortgage applications, misleading home owners about foreclosure rescue programmes, and inflating home appraisals ... The FBI is scheduled to release its 2009 mortgage report on June 17.The FBI usually only arrests people engaged in fraud for profit and not fraud for housing - they typically don't arrest borrowers who misrepresented their income - they arrest mortgage brokers who encouraged people to falsify their income. Although the distinction was blurred during the bubble ...
excerpt with permission
Tanta wrote a great piece on this in 2007: Unwinding the Fraud for Bubbles
There is a tradition in the mortgage business of distinguishing between two major types of mortgage fraud, called “Fraud for Housing” and “Fraud for Profit.” The former is the borrower-initiated fraud—inflating income or assets, lying about employment, etc.—that is motivated by the borrower’s desire to get housing (not the same thing as “real estate”), by means of getting a loan he or she doesn’t actually qualify for. ...The FBI will probably be busy for years.
Fraud for profit is simply someone trying to extract cash—not housing—out of the transaction somewhere. ...
The problem with this traditional distinction is that, recently, we seem to have an epidemic of predator meeting predator and forming an alliance: a borrower willing to commit fraud for housing meets up with a seller or lender willing to commit fraud for profit, and the thing gets jacked up to a whole new level of nastiness.
Here is another scam in Florida from Sally Kestin at the Sun Sentinel: Squatters take over S. Fla. homes in what police call latest fraud in housing crisis (ht Ray).
Manufacturing and Trade Inventory-to-Sales Ratio: Inventory Adjustment Over
by Calculated Risk on 6/11/2010 10:00:00 AM
The Manufacturing and Trade Inventories and Sales report from the Census Bureau today showed that the inventory adjustment is over:
Inventories. Manufacturers’ and trade inventories, adjusted for seasonal variations but not for price changes, were estimated at an end-of-month level of $1,354.3 billion, up 0.4 percent (±0.1%) from March 2010, but down 2.8 percent (±0.3%) from April 2009.
Inventories/Sales Ratio. The total business inventories/sales ratio based on seasonally adjusted data at the end of April was 1.23. The April 2009 ratio was 1.43.
 Click on graph for larger image in new window.
This graph shows the inventory to sales ratio. This has declined sharply to 1.23 (SA) from the peak of 1.48 back in Jan 2009. This could decline further - the trend is definitely down over time - but clearly the inventory adjustment is over.
This is important because the change in inventory added significantly to Q4 GDP growth and some to Q1 GDP. See BEA line 13: the contribution to GDP in Q4 2009 from 'Change in private inventories' was 3.79 of the 5.9 percent annualized increase in Q4 GDP. In Q1 2010. the 'change in private inventories' was 1.65 of the 3.0 percent annualized increase.
Any boost to Q2 GDP from inventory changes will be minor.
It now appears the inventory adjustment is over. Further growth in inventories will depend on increases in underlying demand. This is part of the 2nd half slowdown forecast.
Retail Sales decline in May
by Calculated Risk on 6/11/2010 08:30:00 AM
On a monthly basis, retail sales decreased 1.2% from April to May (seasonally adjusted, after revisions), and sales were up 6.9% from May 2009 (easy comparison). Click on graph for larger image in new window.
This graph shows retail sales since 1992. This is monthly retail sales, seasonally adjusted (total and ex-gasoline).
The red line shows retail sales ex-gasoline and shows the increase in final demand ex-gasoline has been sluggish.
Retail sales are up 8% from the bottom, but still off 4.6% from the pre-recession peak. The second graph shows the year-over-year change in retail sales (ex-gasoline) since 1993.
Retail sales ex-gasoline increased by 5.6% on a YoY basis (6.9% for all retail sales). The year-over-year comparisons are easy now since retail sales collapsed in late 2008. Retail sales bottomed in December 2008.
Here is the Census Bureau report:
The U.S. Census Bureau announced today that advance estimates of U.S. retail and food services sales for May, adjusted for seasonal variation and holiday and trading-day differences, but not for price changes, were $362.5 billion, a decrease of 1.2 percent (±0.5%) from the previous month, but 6.9 percent (±0.7%) above May 2009.This is just one month, but this is a weak report.
Thursday, June 10, 2010
Senate Bill would extend Housing Tax Credit Closing Deadline
by Calculated Risk on 6/10/2010 11:59:00 PM
From Dina ElBoghdady at the WaPo: Bill would extend home buyers' deadline for tax credit
Home buyers hoping to take advantage of a lucrative federal tax credit would get three extra months to complete their purchases under a proposal introduced in the Senate on Thursday.I've wasted enough posts explaining why this was a poor use of taxpayers' money .. but a three month extension to close? Geesh ... that is ridiculous.
Hotel Occupancy Increases
by Calculated Risk on 6/10/2010 08:32:00 PM
From HotelNewsNow.com: STR: Economy segment tops occupancy increases
Overall, in year-over-year measurements, the industry’s occupancy increased 1.0 percent to 57.1 percent. Average daily rate dropped 2.3 percent to US$93.93. Revenue per available room decreased 1.3 percent to US$53.61.Note: This was a difficult comparison because of the timing of Memorial Day.
The following graph shows the four week moving average for the occupancy rate by week for 2008, 2009 and 2010 (and a median for 2000 through 2007).
 Click on graph for larger image in new window.
Notes: the scale doesn't start at zero to better show the change.
The graph shows the distinct seasonal pattern for the occupancy rate - higher in the summer because of leisure/vacation travel.
The occupancy rate collapsed in the 2nd half of 2008 (blue line), and 2009 was the worst year since the Great Depression.
For the last three months, the occupancy rate has been running above the same period in 2009 - but still well below the normal level.
Last year leisure travel (summer) held up better than business travel, now it appears business travel is recovering - and we will soon see if leisure travel will also pick up this year.
Data Source: Smith Travel Research, Courtesy of HotelNewsNow.com
Update on European Bond and CDS Spreads
by Calculated Risk on 6/10/2010 05:54:00 PM
Here are two graphs from the Atlanta Fed weekly Financial Highlights released today (graph as of June 9th):
UPDATE: As I noted, this data is as of June 9th (or earlier). The spreads narrowed today. Nemo has links to the data on the sidebar of his site. "The 10-year Obligacion del Estado fell to 4.48%, for a spread of 187 bps ... [lower than the] 211 bps the Atlanta Fed cited." Click on graph for larger image in new window.
From the Atlanta Fed:
Following a decline after the initial reports of the EU/IMF €750 billion package and ECB bond purchases, peripheral euro area bond spreads (over German bonds) have widened.
In particular, the bond spreads for Italy and Spain have widened the most relative to their levels before the rescue package was unveiled.
After initially declining four weeks ago, sovereign debt spreads have begun widening for peripheral euro area countries. As of June 9, the 10-year bond spread stands at 554 basis points (bps) for Greece, 258 bps for Ireland, 265 bps for Portugal, and 211 bps for Spain.
The spread to Italian bonds has increased 76 bps since May 11, from 1% to 1.75%, while Portuguese bond spreads are 112 bps higher during the same period. U.K. bond spreads are essentially unchanged.

Similarly, CDS spreads have widened after the initial response to the stabilization package.After declining following the policy response, the bond and CDS spreads have resumed their steady climb.
Is this what IMF Managing Director Dominique Strauss-Kahn meant by "contained"?
Debt Problem "Contained" in Europe, Market and Short Sale Fraud
by Calculated Risk on 6/10/2010 04:00:00 PM
Quote of the day via Bloomberg (ht Bob_in_MA):
We do believe the recovery is strong,” Dominique Strauss-Kahn said in an interview with Bloomberg HT television in Istanbul. While rising debt levels are a risk to growth, mainly in Europe, authorities in the region “are now really committed to solve it” and “the problem has been contained,” he said.And this reminds us of Fed Chairman Bernanke's testimony on March 28, 2007:
"[T]he impact on the broader economy and financial markets of the problems in the subprime market seems likely to be contained."Uh oh, not another problem "contained"!
 Click on graph for larger image in new window.
And a market graph from Doug Short of dshort.com (financial planner).
This graph shows the ups and downs of the market since the high in 2007.
And on short sale fraud, from Bloomberg: Banks Face Short-Sale Fraud as Home ‘Flopping’ Rises (ht Mike in Long Island, Brian, Alex)
Two Connecticut real estate agents ... are scheduled to be sentenced in Hartford’s federal court in August after pleading guilty to fraud. Their crime involved persuading lenders to approve the sale of homes for less than the balance owed --known as a short sale -- without disclosing that there were better offers. They then flipped the houses for a profit.There are many versions of short sale fraud. Here is a story I recently heard from a reliable source:
A homeowner in California's Inland Empire bought for $350,000, refinanced during the boom for over $700,000 (cash out), and put in a pool, fixed up the house, and bought some toys. After house prices collapsed, and his loan reset to the fully amortizing rate, he talked his bank into a short sale (the homeowner is a real estate agent) - to his cousin for $350,000! The previous homeowner is now leasing the home from his cousin ...
The house was listed on the MLS for one minute at midnight (to satisfy the bank). And then listed as pending. These one minute listings are a red flag for possible fraud. Whether the transaction is not arms length (as above), or the listing agent is just trying to get both sides of the commission - this is not the best deal for the lenders (and frequently taxpayers).
This is a classic agency problem. As part of a short sale agreement, I think the bank should hire the listing agent - and also require the property to be listed openly for a minimum period.
Q1 Flow of Funds: Household Net Worth off $11.4 Trillion from Peak
by Calculated Risk on 6/10/2010 11:59:00 AM
The Federal Reserve released the Q1 2010 Flow of Funds report today: Flow of Funds.
According to the Fed, household net worth is now off $11.4 Trillion from the peak in 2007, but up $6.3 trillion from the trough in Q1 2009. A majority of the decline in net worth is from real estate assets with a loss of about $6.4 trillion in value from the peak. Stock market losses are still substantial too. Click on graph for larger image in new window.
This is the Households and Nonprofit net worth as a percent of GDP.
This includes real estate and financial assets (stocks, bonds, pension reserves, deposits, etc) net of liabilities (mostly mortgages). Note that this does NOT include public debt obligations.
Note that this ratio was relatively stable for almost 50 years, and then we saw the stock market and housing bubbles. This graph shows homeowner percent equity since 1952.
Household percent equity (as measured by the Fed) collapsed when house prices collapsed in 2007 and 2008.
In Q1 2010, household percent equity (of household real estate) was up to 38.2% from the all time low of 33.3% last year. The increase was due to both an increase in the value of household real estate and a $99 billion decline in mortgage debt.
Note: something less than one-third of households have no mortgage debt. So the approximately 50+ million households with mortgages have far less than 38.2% equity. The third graph shows household real estate assets and mortgage debt as a percent of GDP. Household assets as a percent of GDP decreased slightly in Q1 as the value of real estate assets declined slightly, and GDP increased.
Mortgage debt declined by $99 billion in Q1. Mortgage debt has now declined by $377 billion from the peak.


