by Calculated Risk on 6/10/2010 08:32:00 PM
Thursday, June 10, 2010
Hotel Occupancy Increases
From HotelNewsNow.com: STR: Economy segment tops occupancy increases
Overall, in year-over-year measurements, the industry’s occupancy increased 1.0 percent to 57.1 percent. Average daily rate dropped 2.3 percent to US$93.93. Revenue per available room decreased 1.3 percent to US$53.61.Note: This was a difficult comparison because of the timing of Memorial Day.
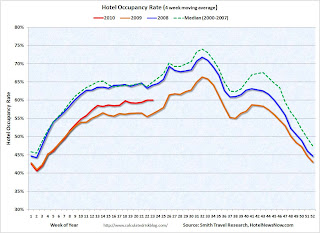
The following graph shows the four week moving average for the occupancy rate by week for 2008, 2009 and 2010 (and a median for 2000 through 2007).
 Click on graph for larger image in new window.
Notes: the scale doesn't start at zero to better show the change.
The graph shows the distinct seasonal pattern for the occupancy rate - higher in the summer because of leisure/vacation travel.
The occupancy rate collapsed in the 2nd half of 2008 (blue line), and 2009 was the worst year since the Great Depression.
For the last three months, the occupancy rate has been running above the same period in 2009 - but still well below the normal level.
Last year leisure travel (summer) held up better than business travel, now it appears business travel is recovering - and we will soon see if leisure travel will also pick up this year.
Data Source: Smith Travel Research, Courtesy of HotelNewsNow.com


