 RSS Feed
 by Calculated Risk on 6/10/2010 11:20:00 AM
Thursday, June 10, 2010
Ceridian-UCLA: Diesel Fuel index increases sharply in May
This is the new UCLA Anderson Forecast and Ceridian Corporation index using real-time diesel fuel consumption data: Pulse of Commerce IndexTM
Press Release: PCI Strikes Optimistic Note For U.S. Economy with 3.1 Percent Gain in May
With a monthly increase not seen since February 1999, the Ceridian-UCLA Pulse of Commerce Index™ (PCI) by UCLA Anderson School of Management climbed 3.1 percent in May. The increase represents the strongest indicator yet from the PCI that the U.S. economy is on the upswing.
...
“Absent good news from the usual recovery indicators – consumer optimism expressed by buying homes and cars, and business optimism expressed by hiring – the spike in the PCI is indeed very welcome news for the economy,” said Ed Leamer, the PCI’s chief economist. “One month does not make a trend, but at least we are back in a recovery groove.”
The May result makes up for April’s decline of 0.3 percent and for the PCI’s flat, overall performance during the first four months of 2010.
...
The PCI is based on an analysis of real-time diesel fuel consumption data ...
 Click on graph for larger image in new window.
This graph shows the index since January 1999.
Note: This index appears to lead Industrial Production (IP), but there is a significant amount of monthly noise. This is a new index and might be interesting to follow along with the Trucking and Railroad data.
Here is a video of Leamer's comments on the report. After a few months of almost no growth, this index increased sharply in May.
Trade Deficit increases slightly in April
by Calculated Risk on 6/10/2010 09:07:00 AM
The Census Bureau reports:
[T]otal April exports of $148.8 billion and imports of $189.1 billion resulted in a goods and services deficit of $40.3 billion, up from $40.0 billion in March, revised. April exports were $1.0 billion less than March exports of $149.8 billion. April imports were $0.8 billion less than March imports of $189.9 billion.
 Click on graph for larger image.
The first graph shows the monthly U.S. exports and imports in dollars through April 2010.
On a year-over-year basis, exports are up 20% and imports are up 24%. This is an easy comparison because of the collapse in trade at the end of 2008 and into early 2009.
The second graph shows the U.S. trade deficit, with and without petroleum, through April.
 The blue line is the total deficit, and the black line is the petroleum deficit, and the red line is the trade deficit ex-petroleum products.
Import oil prices increased slightly to $77.13 in April - and are up 97% from the low of February 2009 (at $39.22). Oil import volumes were down in April.
Although both imports and exports were off slightly in April, both have been increasing sharply - but are still below the pre-crisis levels. Once again China and oil are the major contributors to the trade deficit.
Weekly Initial Unemployment Claims at 456,000
by Calculated Risk on 6/10/2010 08:30:00 AM
The DOL reports on weekly unemployment insurance claims:
In the week ending June 5, the advance figure for seasonally adjusted initial claims was 456,000, a decrease of 3,000 from the previous week's revised figure of 459,000 [revised up from 453,000]. The 4-week moving average was 463,000, an increase of 2,500 from the previous week's revised average of 460,500.
...
The advance number for seasonally adjusted insured unemployment during the week ending May 29 was 4,462,000, a decrease of 255,000 from the preceding week's revised level of 4,717,000.
 Click on graph for larger image in new window.
This graph shows the 4-week moving average of weekly claims since January 2000.
The four-week average of weekly unemployment claims increased this week by 2,500 to 463,000.
The dashed line on the graph is the current 4-week average. Initial weekly claims first fell to this level in December 2009, and have been at the same level for about 6 months. The current level of 456,000 (and 4-week average of 463,000) is still high, and suggests ongoing weakness in the labor market.
Wednesday, June 09, 2010
California Senate Passes bill to extend anti-deficiency rules to some Refinanced Mortgages
by Calculated Risk on 6/09/2010 10:05:00 PM
Under California law, purchase money loans are non-recourse. However once a homeowner refinances, the entire mortgage is recourse ... that is probably going to change:
From Jim the Realtor: SB 1178 – Amended
SB 1178, the bill passed by the California State Senate by a 30-4 vote, is on its way to the Assembly.Jim wonders if some homeowners will wait until June 1, 2011 to default. I doubt it. Most borrowers I've spoken with have no idea about recourse vs. non-recourse, and purchase money vs. refinance.
The new intent:This bill preserves a borrowers protection from a deficiency judgment when loans are refinanced, but only to the extent that the refinance is used to pay debt incurred to purchase the real property. The provisions of this bill become operative on June 1, 2011.Yes, there was an amendment slipped in last week that eliminated the cash-out refinances, even those used for home improvement. The current bill is only applies to those who refinanced the mortgage used to purchase the home.
Note that additional money borrowed above the original purchase loan amount will still be recourse if this becomes law.
Waste Traffic Indicator?
by Calculated Risk on 6/09/2010 05:50:00 PM
From Bloomberg: Waste on Freight Cars Gains Most Since ’94 Confirming Rebound (ht Brian)
If garbage is any indication, the U.S. economy is strengthening.And here is the graph:
The number of freight cars carrying waste jumped 45 percent in April and May from the same period last year ... according to the Washington-based Association of American Railroads.
...
Shipments of waste and scrap have a higher correlation with economic growth than coal or copper, according to data compiled by Bloomberg News.
 Click on graph for larger image in new window.
From the Association of American Railroads: Rail Time Indicators: Waste and Scrap Materials traffic in May 2010 was "up 37.1% from May 2009 and down 20.4% from May 2008."
Waste traffic was down from the April level. The Bloomberg article suggests this confirms the "economy is strengthening" - I'd say this shows the recovery has been sluggish (still well below the May 2008 level) and the economy might have slowed in May (although one month doesn't make a trend).
Fed's Beige Book: "modest" economic growth, "Shadow" inventory of Foreclosed Homes
by Calculated Risk on 6/09/2010 02:00:00 PM
From the Federal Reserve: Beige book
Economic activity continued to improve since the last report across all twelve Federal Reserve Districts, although many Districts described the pace of growth as "modest."On Real Estate:
Residential real estate activity improved since the last report. Most Districts noted an increase in home sales and construction prior to the April 30th deadline for the homebuyer tax credit, with contacts in many of these Districts also indicating a corresponding slowing in activity in May. Tight credit, the elevated inventory of homes available for sale, and the "shadow inventory" of foreclosed properties on banks' balance sheets held back residential development in the New York, Cleveland, Atlanta, and Chicago Districts. Commercial real estate activity generally remained weak. Office, industrial, and retail vacancy rates continued to drift upward in many Districts putting downward pressure on rents. However, lower rents were said to have led to an increase in leasing activity in New York, Philadelphia, Richmond, Kansas City, Dallas, and San Francisco. The elevated inventory of existing properties for sale or rent continued to weigh on new private nonresidential construction. However, stronger industrial demand was noted in several Districts. Public construction increased in Philadelphia, Cleveland, and Chicago, but slowed in Minneapolis.This is the first mention of shadow inventory on banks' balance sheet (at least recently).
Happy "Froth" Day
by Calculated Risk on 6/09/2010 12:30:00 PM
Jon Lansner at the O.C. Register notes the fifth anniversary of then Fed Chairman Alan Greenspan's "Froth" speech: Greenspan’s froth not bubble, 5 years later
“Although a ‘bubble’ in home prices for the nation as a whole does not appear likely, there do appear to be, at a minimum, signs of froth in some local markets where home prices seem to have risen to unsustainable levels.” [said Fed Chairman Alan Greenspan, June 9, 2005 in testimony to Congress]Perhaps to celebrate "Froth Day", Fed Chairman Bernanke made this statement:
[U]nderlying housing activity appears to have firmed only a little since mid-2009, with activity being weighed down, in part, by a large inventory of distressed or vacant existing houses and by the difficulties of many builders in obtaining credit.So there are too many "distressed or vacant existing houses", and not enough credit for builders to add to that oversupply.
Bernanke Testimony before House Budget Committee at 10 AM
by Calculated Risk on 6/09/2010 09:50:00 AM
Fed Chairman Ben Bernanke will testify before the House Budget Committee at 10 AM. The topic is State of the Economy: View from the Federal Reserve
Note: Bernanke has promised not to discuss fiscal policy.
Here is the CNBC feed. (starts at 10 AM ET)
Here is the CSpan feed
Prepared testimony: Economic and financial conditions and the federal budget
MBA: Mortgage Purchase Applications decline 35% over last four weeks
by Calculated Risk on 6/09/2010 07:33:00 AM
The MBA reports: Mortgage Applications Decrease in Latest MBA Weekly Survey
The Refinance Index decreased 14.3 percent from the previous week and the seasonally adjusted Purchase Index decreased 5.7 percent from one week earlier.
...
“Purchase and refinance applications dropped this week, even after an adjustment for the Memorial Day holiday. Purchase applications are now 35 percent below their level of four weeks ago, as homebuyers have not yet returned to the market following the expiration of the homebuyer tax credit at the end of April,” said Michael Fratantoni, MBA’s Vice President of Research and Economics. “Although rates remained essentially flat, refinance applications dropped this past week for the first time in a month. Despite the historically low rates, many homeowners have already refinanced recently, remain underwater on their mortgages, have uncertain job situations, or have damaged credit following this downturn, and therefore may not qualify to refinance.”
...
The average contract interest rate for 30-year fixed-rate mortgages decreased to 4.81 percent from 4.83 percent, with points decreasing to 1.02 from 1.05 (including the origination fee) for 80 percent loan-to-value (LTV) ratio loans.
 Click on graph for larger image in new window.
This graph shows the MBA Purchase Index and four week moving average since 1990.
The purchase index has collapsed following the expiration of the tax credit suggesting home sales will fall sharply too. This is the lowest level for the purchase index since February 1997.
Late Night Futures
by Calculated Risk on 6/09/2010 12:04:00 AM
Wednesday: The MBA will release the mortgage purchase applications index. This has been falling sharply suggesting a sharp decline in home sales after the expiration of the tax credit. Also on Wednesday, Wholesale Inventories and the Fed’s Beige Book will be released.
Fed Chairman Ben Bernanke will testify at 10 AM before the house budget committee (the hearing is about the State of the Economy: View from the Federal Reserve), and the NY Fed’s Brian Sack will speak at noon at the New York Association of Business Economics.
The Asian markets are mixed tonight.
The CNBC Pre-Market Data shows the S&P 500 down 6 points and the Dow futures are down about 60 points.
The Euro is down slightly at 1.195 dollars
Best to all.
Tuesday, June 08, 2010
Europe Update: Strikes in Spain, UK Austerity, ECB Bond Purchases
by Calculated Risk on 6/08/2010 06:57:00 PM
Form the NY Times: Spain Hit by Strike Over Austerity Measures
Spanish public workers went on strike on Tuesday against a cut in their wages in what could be the first of several union-led protests against the government’s latest austerity measures.From The Times: Osborne’s four-year austerity programme
George Osborne braced the country for cuts in government spending of up to 20 per cent as he laid the ground for an austerity programme to last the whole parliament.From Der Spiegel (a week ago): ECB Buying Up Greek Bonds (ht Chris)
Bonds worth about €3 billion are now being purchased on every trading day, with €2 billion of the bonds coming from Athens.From Bloomberg: Greek Default Seen by Almost 75% in Poll Doubtful About Trichet
Global investors have little confidence in Europe’s efforts to contain its debt crisis or in European Central Bank President Jean-Claude Trichet, with 73 percent calling a default by Greece likely.From the NY Times: E.U. Finance Ministers Agree on Tighter Oversight
Despite continuing tensions over economic policy, European Union finance ministers agreed Tuesday on far-reaching steps to tighten oversight of national governments’ budgets and crack down on falsification of economic data, in a concerted effort to avert a further loss of confidence in the euro.
Market Update, and the $24 Billion Medicaid Aid to States Debate
by Calculated Risk on 6/08/2010 04:01:00 PM
The euro is up slightly to 1.1944 dollars. The TED spread increased to 43.24 (a measure of credit stress). This TED spread has been increasing slowly ... 
And a market graph from Doug Short of dshort.com (financial planner).
This graph shows the ups and downs of the market since the high in 2007.
And on the issue of state budget cuts, from the NY Times yesterday: Medicaid Cut Places States in Budget Bind
The Medicaid provision ... was considered such a sure bet by many governors and legislative leaders that they prematurely included the money in their budgeting. ... at least 30 states will have to close larger-than-anticipated shortfalls in the coming fiscal year unless Congress passes a six-month extension of increased federal spending on Medicaid.
...
In California, Gov. Arnold Schwarzenegger’s proposed budget assumed $1.5 billion in increased federal aid for Medicaid. ... In New York, which started its fiscal year on April 1 without a financial plan, Gov. David A. Paterson’s proposed budget included $1.1 billion in unsecured federal financing.
...
“I’m very concerned about the level of federal spending and what it would mean for the long term,” said Gov. Jim Douglas of Vermont, a Republican and chairman of the National Governors Association. “But for the short term, states need this bridge to sustain the safety net of human services programs and education.”
Has the 2nd half slowdown started?
by Calculated Risk on 6/08/2010 01:21:00 PM
I've been forecasting a 2nd half slowdown in GDP growth based on:
1) less Federal stimulus spending in the 2nd half of 2010,
2) the end of the inventory correction,
3) more household saving leading to slower growth in personal consumption expenditures,
4) another downturn in housing (lower prices, less residential investment),
5) slowdown in China and Europe and
6) cutbacks at the state and local level.
Some recent reports - like the disappointing employment report for May, reports of pending home sales collapsing in May (after the expiration of the tax credit), soft retail sales in April, a soft month for rail traffic in May - might suggest the slowdown has already started.
However other recent reports - like the ISM manufacturing and service surveys, Industrial Production and Capacity Utilization in April and U.S. auto sales - suggest decent expansion in Q2.
My guess is GDP growth in Q2 will be close to 3% - sluggish for a recovery, but about the same as Q1. So I don't think the 2nd half slowdown has started yet.
Note on housing: I think the news flow will soon turn negative for housing. Existing home sales will be strong in May and June (reported at close) and house prices will be decent through June (reported with a significant lag), but housing starts, new home sales, and house prices later this summer will probably all turn down. And pending home sales will collapse in May, and existing home sales will follow this summer. I think we will see new lows (but not huge declines) for the repeat sales house price indexes later this year.
BLS: Low Labor Turnover, Job Openings Increase in April
by Calculated Risk on 6/08/2010 10:00:00 AM
From the BLS: Job Openings and Labor Turnover Summary
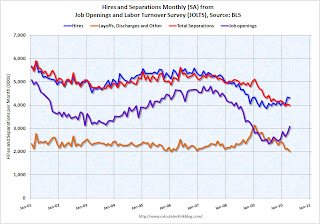
There were 3.1 million job openings on the last business day of April 2010, the U.S. Bureau of Labor Statistics reported today. The job openings rate increased over the month to 2.3 percent. The hires rate (3.3 percent) and the separations rate (3.1 percent) were unchanged.Note: The difference between JOLTS hires and separations is similar to the CES (payroll survey) net jobs headline numbers. The CES (Current Employment Statistics, payroll survey) is for positions, the CPS (Current Population Survey, commonly called the household survey) is for people.
The following graph shows job openings (purple), hires (blue), Total separations (include layoffs, discharges and quits) (red) and Layoff, Discharges and other (yellow) from the JOLTS.
Unfortunately this is a new series and only started in December 2000.
 Click on graph for larger image in new window.
Notice that hires (blue) and separations (red) are pretty close each month. Right now about 4 million people lose their jobs each month, and over 4 million are hired (this is the labor turnover in the economy).
When the hires (blue line) is above total separations (as in April), the economy is adding net jobs, when the blue line is below total separations, the economy is losing net jobs.
According to the JOLTS report, there were 4.304 million hires in April (SA), and 4.000 million total separations, or 304 thousand net jobs gained. The comparable CES report showed a gain of 290 thousand jobs in April (after revision).
Note: Hires include Census 2010 temporary hires.
Layoffs and discharges have declined sharply from early 2009 - and are near a series low - and that is a good sign. And the number of job openings increased sharply in April, although the level is still pretty low.
Job openings and "layoffs and discharges" have been improving, but the overall labor turnover is still low.
Small Business Optimism improves slightly in May
by Calculated Risk on 6/08/2010 08:34:00 AM
From NFIB: Small Business Optimism Increases But Not Enough to Spur Hiring, Capital Spending
The National Federation of Independent Business Index of Small Business Optimism gained 1.6 points in May with a reading of 92.2. Although not a strong sign of recovery, it is headed in the right direction. It is the best reading since September 2008’s 92.9 index that occurred just before the five-point decline in October that started the rapid deterioration in the fourth quarter of 2008. In May, seven of the 10 index components rose, but job creation and capital expenditure plans barely gained and remained at recession levels.The outlook has improved, but the recovery is sluggish and hiring is "bleak".
“The performance of the economy is mediocre at best,” said William C. Dunkelberg, NFIB’s chief economist.
...
In May, firms still shed workers ... The small business sector is not contributing to private sector employment growth.
“"The recovery in optimism we are currently experiencing is very weak compared to recoveries after 1982 or 1975."Note: although the press release doesn't mention it, there is a heavy concentration of construction related businesses in the small business sector - and obviously that is one of the weakest sectors.
Monday, June 07, 2010
Bernanke: Economy "won't feel terrific"
by Calculated Risk on 6/07/2010 11:30:00 PM
From Sewell Chan at the NY Times: Bernanke Forecasts a Fitful Recovery
“My best guess is that we’ll have a continued recovery, but it won’t feel terrific,” Mr. Bernanke told the broadcast journalist Sam Donaldson in a question-and-answer session at the Woodrow Wilson International Center for Scholars.The Asian markets are up somewhat tonight.
...
“Even though technically we’ll be in recovery and the economy will be growing, unemployment will still be high for a while and that means that a lot of people will be under financial stress,” he said.
The CNBC Pre-Market Data shows the S&P 500 up about 5 points and the Dow futures are up about 40 points.
The Euro is up slightly at 1.196 dollars
Best to all.
Distressed Sales: Sacramento as an Example, May 2010
by Calculated Risk on 6/07/2010 06:42:00 PM
The Sacramento Association of REALTORS® is breaking out monthly resales by equity sales (conventional resales), and distressed sales (Short sales and REO sales), and I'm following this series as an example to see mix changes in a distressed area. 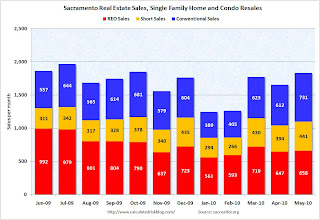 Click on graph for larger image in new window.
Here is the May data.
The Sacramento Association started breaking out REO sales in 2008, but they have only broken out short sales since June 2009 - so we now have one year of data.
In May, 60.1% of all resales (single family homes and condos) were distressed sales. This is the lowest level over the last year.
Note: This data is not seasonally adjusted.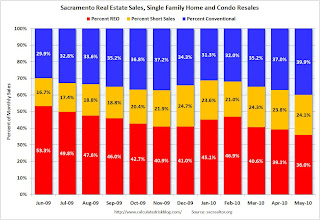 The second graph shows the percent of REO, short sales and conventional sales. The percent of short sales is near the high set in December and will probably continue to increase later this year (2010 is the year of the short sale!).
The percent of REOs has been generally declining (seasonally there are a larger percentage of REOs in the winter). Also there appears to be a higher percentage of conventional sales associated with the tax credit.
Also total sales in May were off 1.8% compared to May 2009; the 12th month in a row with declining YoY sales - even with the tax credit buying this year!
On financing, 57 percent were either all cash (23.3%) or FHA loans (33.6%), suggesting most of the activity in distressed former bubble areas like Sacramento is first time home buyers using government-insured FHA loans, and investors paying cash.
Starting in June we can do some year-over-year comparisons. It appears short sales will be up substantially YoY and REOs down, and it will be interesting to see the level of total distressed sales once the tax credit buying is behind us (July).
Rail Traffic Softens in May
by Calculated Risk on 6/07/2010 03:49:00 PM
From the Association of American Railroads: Rail Time Indicators. The AAR reports traffic in May 2010 was up 15.8% compared to May 2009 - and traffic was still 11.8% lower than in May 2008. Click on graph for larger image in new window.
This graph shows U.S. average weekly rail carloads. Traffic increased in 18 of 19 major commodity categories YoY.
From AAR:
• U.S. freight railroads originated 1,153,675 carloads in May 2010, an average of 288,419 carloads per week. That’s up 15.8% from May 2009 (which is the second highest percentage gain ever, behind April 2010 — see chart ...) but down 11.8% from May 2008.As the graph above shows, rail traffic collapsed in November 2008, and now eleven months into the recovery, traffic has only recovered about half way. This is more evidence of a sluggish recovery ... and the decline in May is concerning, although one month does not make a trend (and May was "a bit overstated" due to the timing of Memorial Day).
• U.S. railroads averaged 294,758 carloads per week in April 2010 and 288,793 in March 2010. Thus, May 2010’s average was actually down slightly from those months ... One month does not a trend make, but it would obviously be worrisome if the decline continued.
• As was the case in April 2010, the big year-over-year percentage gains in May 2010 U.S. rail traffic were partly a function of easy comparisons (May 2009 was a miserable month for rail traffic) and partly a function of real traffic growth.
• For the purposes of AAR rail traffic data, May 2010 consists of the four weeks ending May 29 — i.e., it does not include Memorial Day, which was May 31 this year. However, the May 2009 and May 2008 comparison months do include Memorial Day. The net result is that May 2010 data is a bit overstated relative to the two previous years, and June 2010 will be a bit understated relative to the two previous years. It is impossible to know exactly how much rail traffic is affected.
excerpts with permission
Consumer Credit increases slightly in April
by Calculated Risk on 6/07/2010 03:00:00 PM
The Federal Reserve reports:
Consumer credit increased at an annual rate of 1/2 percent in April 2010. Revolving credit decreased at an annual rate of 12 percent, and nonrevolving credit increased at an annual rate of 7 percent.
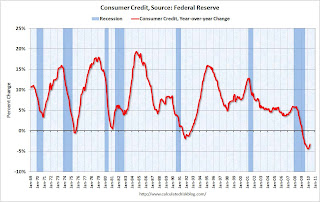 Click on graph for larger image in new window.
This graph shows the year-over-year (YoY) change in consumer credit. Consumer credit is off 3.2% over the last 12 months.
Note: The Fed reports a simple annual rate (multiplies change in month by 12) as opposed to a compounded annual rate. Consumer credit does not include real estate debt.
Usually there is a fairly sharp increase in consumer credit during a robust recovery - but that isn't happening this time because household balance sheets are still a mess. Just another reminder that the recovery will be sluggish and choppy ...
Impact of Decennial Census on Unemployment Rate
by Calculated Risk on 6/07/2010 12:00:00 PM
Last week I posted the Impact of Census 2010 on Payroll Report
My estimate was that the 2010 Census would add 417,000 payroll jobs in May; the actual was 411,000 payroll jobs.
My preliminary estimate is the Census will subtract 200,000 payroll jobs in June - and most of the remaining temporary Census jobs (564,000 total in May) will be unwound by September.
I've been puzzling over how much (if any) these temporary jobs lowered the unemployment rate in May. I think these workers come from three groups:
1) already employed workers taking a part time job,
2) people not in the workforce picking up a little temporary income (like retirees or students who would otherwise not be in the workforce), and
3) the unemployed taking a part time job.
Sure enough there was an increase in people working multiple jobs in May. The number of multiple jobholders jumped by 210,000 in May (seasonally adjusted). There can be other reasons for this increase, but if we assume these are mostly Census workers, then about half the 411,000 additional Census workers already have other jobs - so for these workers, the temporary Census jobs has no impact on the unemployment rate.
The other half are probably otherwise unemployed workers, or people not in the workforce (although the participation rate declined in May). If we assume that this is mostly unemployed workers, these temporary hires lowered the unemployment rate by around 0.1% (from 9.8% to 9.7%).


