 RSS Feed
 by Calculated Risk on 4/16/2010 10:45:00 PM
Friday, April 16, 2010
Unofficial Problem Bank List hits 698
This is an unofficial list of Problem Banks compiled only from public sources.
Here is the unofficial problem bank list for April 16, 2010.
Changes and comments from surferdude808:
The closures this week and publication of actions issued by the OCC during March contributed to a large number of changes in the Unofficial Problem Bank List this week.
There were 25 institutions with assets of $8.7 billion added this week while 9 institutions with assets of $6.4 billion were removed. The net of this activity results in an Unofficial Problem Bank List that has 698 institutions with combined assets of $366.5 billion, up from 682 institutions with assets of $364.1 billion last week.
The Unofficial Problem Bank List has mostly closed the gap with the latest FDIC Official Problem Bank List that included 702 institutions. Notable among the 25additions are Far East National Bank, Los Angeles, CA ($2 billion); BNC National Bank, Phoenix, AZ ($867 million Ticker: BNCC.PK); First Community Bank, National Association, Lexington, SC ($605 million Ticker: FCCO); Citizens National Bank of Paintsville, Paintsville, IL ($582 million Ticker: CZNL.OB); and Golden Bank, National Association, Houston, TX ($507 million).
The removals include an action termination by the Federal Reserve against KCB Bank ($143 million), and the 8 failures -- Riverside National Bank of Florida ($3.4 billion), City Bank ($1.1 billion), Tamalpais Bank ($629 million), First Federal Bank of North Florida ($393 million), Innovative Bank ($269 million), Butler Bank ($268 million), AmericanFirst Bank ($90 million), and Lakeside Community Bank ($53 million).
Bank Failure #50: City Bank, Lynnwood, Washington
by Calculated Risk on 4/16/2010 09:28:00 PM
Not that one, nor that one...yet.
Not that one either.
by Soylent Green is People
From the FDIC: Whidbey Island Bank, Coupeville, Washington, Assumes All Of The Deposits Of City Bank, Lynnwood, Washington
As of December 31, 2009, City Bank had approximately $1.13 billion in total assets and $1.02 billion in total deposits.
...
The FDIC estimates that the cost to the Deposit Insurance Fund (DIF) will be $323.4 million.... City Bank is the 50th FDIC-insured institution to fail in the nation this year, and the fifth in Washington. The last FDIC-insured institution closed in the state was Rainier Pacific Bank, Tacoma, February 26, 2010.
Bank Failure #49: Tamalpais Bank, San Rafael, California
by Calculated Risk on 4/16/2010 08:50:00 PM
Now banks eat banks nationwide.
Ms. Bair = Ms. PacMan?
by Soylent Green is People
From the FDIC: Union Bank, National Association, San Francisco, California, Assumes All Of The Deposits Of Tamalpais Bank, San Rafael, California
As of December 31, 2009, Tamalpais Bank had approximately $628.9 million in total assets and $487.6 million in total deposits.This bank made some really bad CRE loans, see from David Johnson: When smart money said "no more," not-so-smart Marin bank loaned the Lembis $41 million.
...
The FDIC estimates that the cost to the Deposit Insurance Fund (DIF) will be $81.1 million. ... Tamalpais Bank is the 49th FDIC-insured institution to fail in the nation this year, and the third in California. The last FDIC-insured institution closed in the state was Innovative Bank, Oakland, earlier today.
Bank Failure #48: Innovative Bank, Oakland
by Calculated Risk on 4/16/2010 08:12:00 PM
Nothing's new under the sun
Same mistakes, same end.
by Soylent Green is People
From the FDIC: Center Bank, Los Angeles, California, Assumes All Of The Deposits Of Innovative Bank, Oakland, California
As of December 31, 2009, Innovative Bank had approximately $268.9 million in total assets and $225.2 million in total deposits.
...
The FDIC estimates that the cost to the Deposit Insurance Fund (DIF) will be $37.8 million. ... Innovative Bank is the 48th FDIC-insured institution to fail in the nation this year, and the 3rd in California. The last FDIC-insured institution closed in the state was La Jolla Bank, FSB, La Jolla, February 19, 2010.
Bank Failures #44 - 47: Florida and Massachusetts
by Calculated Risk on 4/16/2010 06:07:00 PM
Soaring peaks of verdant green
All debt, I.O.U's.
by Soylent Green is People
From the FDIC: TD Bank, National Association, Wilmington, Delaware, Acquires All the Deposits of Three Florida Institutions
TD Bank, National Association (N.A.), Wilmington, Delaware, acquired the banking operations, including all the deposits, of three Florida-based institutions. ... AmericanFirst Bank, Clermont; First Federal Bank of North Florida, Palatka; and Riverside National Bank of Florida, Fort PierceFrom the FDIC: People's United Bank, Bridgeport, Connecticut, Assumes All of the Deposits of Butler Bank, Lowell, Massachusetts
...
As of December 31, 2009, AmericanFirst Bank had total assets of $90.5 million and total deposits of $81.9 million; First Federal Bank of North Florida had total assets of $393.3 million and total deposits of $324.2 million; and Riverside National Bank of Florida had total assets of $3.42 billion and total deposits of $2.76 billion.
...
The FDIC estimates that the cost to the Deposit Insurance Fund (DIF) for AmericanFirst Bank will be $10.5 million; for First Federal Bank of North Florida, $6.0 million; and for Riverside National Bank of Florida, 491.8 million.
...
These were the 44th, 45th, and 46th banks to fail in the nation this year, and the seventh, eighth, and ninth banks to close in Florida. Prior to these failures, the last bank closed in the state was Key West Bank, Key West, on March 26, 2010.
As of December 31, 2009, Butler Bank had approximately $268.0 million in total assets and $233.2 million in total deposits.That makes 5 today.
...
The FDIC estimates that the cost to the Deposit Insurance Fund (DIF) will be $22.9 million. .... Butler Bank is the 47th FDIC-insured institution to fail in the nation this year, and the first in Massachusetts. The last FDIC-insured institution closed in the state was Ludlow Savings Bank, Ludlow, October 21, 1994.
Bank Failure #43: Lakeside Community Bank, Sterling Heights, Michigan
by Calculated Risk on 4/16/2010 05:22:00 PM
Summer monsoons wreak havoc
Bankers devastate.
by Soylent Green is People
From the FDIC: FDIC Approves The Payout Of The Insured Deposits Of Lakeside Community Bank, Sterling Heights, Michigan
As of December 31, 2009, Lakeside Community Bank had approximately $53.0 million in total assets and $52.3 million in total deposits.A small one to start the day ...
...
Lakeside Community Bank is the 43rd FDIC-insured institution to fail this year, and the first in Michigan. The last institution closed in the state was Citizens State Bank, New Baltimore, on December 18, 2009. The FDIC estimates the cost of the failure to its Deposit Insurance Fund to be approximately $11.2 million
Report: No Push to Extend Homebuyer Tax Credit
by Calculated Risk on 4/16/2010 03:07:00 PM
From Amy Hoak at MarketWatch: End of road for home-buy credit
Two groups that once lobbied strongly for the credit -- the National Association of Realtors and the National Association of Home Builders -- have no plans to make a push for its extension, according to spokesmen from both groups. And the word from NAR's government-affairs department is that another extension isn't in the cards.The first round of the homebuyer tax credit was widely criticized by economists as inefficient and misdirected. The tax credit went mostly to people who would have bought anyway - and it just provided an incentive for people to move from renting to owning without reducing the overall stock of housing units.
The evidence suggests the extension was even more costly and inefficient than the original credit. So no further extension is good news for the economy ...
SEC Charges Goldman Sachs with Fraud
by Calculated Risk on 4/16/2010 11:31:00 AM
From the SEC: SEC Charges Goldman Sachs With Fraud in Structuring and Marketing of CDO Tied to Subprime Mortgages
The Securities and Exchange Commission today charged Goldman, Sachs & Co. and one of its vice presidents for defrauding investors by misstating and omitting key facts about a financial product tied to subprime mortgages as the U.S. housing market was beginning to falter.
The SEC alleges that Goldman Sachs structured and marketed a synthetic collateralized debt obligation (CDO) that hinged on the performance of subprime residential mortgage-backed securities (RMBS). Goldman Sachs failed to disclose to investors vital information about the CDO, in particular the role that a major hedge fund played in the portfolio selection process and the fact that the hedge fund had taken a short position against the CDO.
"The product was new and complex but the deception and conflicts are old and simple," said Robert Khuzami, Director of the Division of Enforcement. "Goldman wrongly permitted a client that was betting against the mortgage market to heavily influence which mortgage securities to include in an investment portfolio, while telling other investors that the securities were selected by an independent, objective third party."
...
The SEC's complaint alleges that after participating in the portfolio selection, Paulson & Co. effectively shorted the RMBS portfolio it helped select by entering into credit default swaps (CDS) with Goldman Sachs to buy protection on specific layers of the ABACUS capital structure. Given that financial short interest, Paulson & Co. had an economic incentive to select RMBS that it expected to experience credit events in the near future. Goldman Sachs did not disclose Paulson & Co.'s short position or its role in the collateral selection process in the term sheet, flip book, offering memorandum, or other marketing materials provided to investors.
March State Unemployment Rates: New Record Highs in California, Florida, Georgia and Nevada
by Calculated Risk on 4/16/2010 10:05:00 AM
From the BLS: Regional and State Employment and Unemployment Summary
Regional and state unemployment rates were little changed in March. Twenty-four states recorded over-the-month unemployment rate increases, 17 states and the District of Columbia registered rate decreases, and 9 states had no rate change, the U.S. Bureau of Labor Statistics reported today. Forty-four states and the District of Columbia recorded jobless rate increases from a year earlier, 5 states had decreases, and 1 state had no change.
...
Michigan again recorded the highest unemployment rate among the states, 14.1 percent in March. The states with the next highest rates were Nevada, 13.4 percent; California and Rhode Island, 12.6 percent each; Florida, 12.3 percent; and South Carolina, 12.2 percent. North Dakota continued to register the lowest jobless rate, 4.0 percent in March, followed by South Dakota and Nebraska, 4.8 and 5.0 percent, respectively. The rates in California, Florida, and Nevada set new series highs, as did the rate in Georgia (10.6 percent).
emphasis added
 Click on graph for larger image in new window.
This graph shows the high and low unemployment rates for each state (and D.C.) since 1976. The red bar is the current unemployment rate (sorted by the current unemployment rate).
Fifteen states and D.C. now have double digit unemployment rates. New Jersey and Indiana are close.
Four states and set new series record highs: California, Florida, Nevada and Georgia.
Housing Starts mixed in March
by Calculated Risk on 4/16/2010 08:30:00 AM
 Click on graph for larger image in new window.
Total housing starts were at 626 thousand (SAAR) in March, up 1.6% from the revised February rate, and up 30% from the all time record low in April 2009 of 479 thousand (the lowest level since the Census Bureau began tracking housing starts in 1959).
Single-family starts were at 531 thousand (SAAR) in March, down 0.9% from the revised February rate, and 49% above the record low in January and February 2009 (357 thousand).  The second graph shows total and single unit starts since 1968. This shows the huge collapse following the housing bubble, and the slow and sluggish recovery in housing starts.
Here is the Census Bureau report on housing Permits, Starts and Completions.
Housing Starts:
Privately-owned housing starts in March were at a seasonally adjusted annual rate of 626,000. This is 1.6 percent (±15.2%)* above the revised February estimate of 616,000 and is 20.2 percent (±15.3%) above the March 2009 rate of 521,000.
Single-family housing starts in March were at a rate of 531,000; this is 0.9 percent (±12.1%)* below the revised February figure of 536,000. The March rate for units in buildings with five units or more was 88,000.
Housing Completions:
Privately-owned housing completions in March were at a seasonally adjusted annual rate of 656,000. This is 3.1 percent (±16.7%)* below the revised February estimate of 677,000 and is 21.2 percent (±8.9%) below the March 2009 rate of 833,000.
Single-family housing completions in March were at a rate of 486,000; this is 5.9 percent (±14.6%)* above the revised February rate of 459,000. The March rate for units in buildings with five units or more was 161,000.
Thursday, April 15, 2010
LA Area Port Traffic Increases in March
by Calculated Risk on 4/15/2010 09:49:00 PM
Notes: this data is not seasonally adjusted. There is a very distinct seasonal pattern for imports, but not for exports. LA area ports handle about 40% of the nation's container port traffic.
Sometimes port traffic gives us an early hint of changes in the trade deficit. The following graph shows the loaded inbound and outbound traffic at the ports of Los Angeles and Long Beach in TEUs (TEUs: 20-foot equivalent units or 20-foot-long cargo container). Although containers tell us nothing about value, container traffic does give us an idea of the volume of goods being exported and imported. Click on graph for larger image in new window.
Loaded inbound traffic was up 2.6% compared to March 2009. (up 9.6% compared to last year using three month average). Inbound traffic was still down 9.2% vs. two years ago (Mar08).
Loaded outbound traffic was up 13.6% from March 2009. (+24.9% using three months average) Just as with imports, exports are still off from 2 years ago (off 8.0%).
Looking at the graph (red line), exports recovered in the first half of 2009, but then export traffic only increased gradually since last summer. Export traffic picked up again in March.
It is harder to tell about imports (blue line) because of the large seasonal swings. Usually there is a large dip in either February or March - depending on the timing of the Chinese New Year - and that didn't happen this year. The lack of a large seasonal dip might suggest a significant increase in imports too.
WaMu Examiner Ridiculed, Called "Housing 'bubble' boy"
by Calculated Risk on 4/15/2010 06:30:00 PM
From Jim Puzzanghera at the LA Times: Regulators did little to halt reckless practices at WaMu
Federal banking examiners found serious problems at Washington Mutual Bank at least five years before its 2008 collapse, but their supervisors showed little concern ... During those five years, examiners constantly warned of "less than satisfactory" loan underwriting, the "horrible performance" of its subprime-backed mortgage securities and the failure of WaMu executives and federal regulatory supervisors to do much about it.Once again the field examiners did their job, but their efforts were ridiculed. I was asked by a reporter a couple of years ago who was to blame for the housing bubble, and I said the list is long, but it starts with the regulators ...
One examiner said he was derided by colleagues as "the housing 'bubble' boy" for his "gloom and doom" predictions for some risky loans, and another complained that critics of subprime loans were called "chicken little."
...
Former OTS Director John Reich, who served from 2005 to 2009, referred to WaMu Chief Executive Kerry Killinger as "my largest constituent" in a 2007 e-mail.
That attitude pervaded the upper levels of the agency ...
 | This photo from 2003 shows two regulators: John Reich (then Vice Chairman of the FDIC and later at the OTS) and James Gilleran of the Office of Thrift Supervision (with the chainsaw) and representatives of three banker trade associations: James McLaughlin of the American Bankers Association, Harry Doherty of America's Community Bankers, and Ken Guenther of the Independent Community Bankers of America. |
Greece, Market and More
by Calculated Risk on 4/15/2010 03:55:00 PM
A few links ...
This graph is from Doug Short of dshort.com (financial planner): "Four Bad Bears".
Note that the Great Depression crash is based on the DOW; the three others are for the S&P 500.
Measured using our favorite valuation technique, Professor Shiller's cyclically adjusted PE analysis, the S&P 500 has a PE of 22X. The long-term average (1880-2010) is about 16X. The current level is actually close to the big bull market peaks of the past--with the exception of the gigantic one that peaked in 2000.
Greece capitulated ... took an important step towards a bail-out from its eurozone partners and the International Monetary Fund as it formally sought “consultations” over a €30bn-plus ($40bn, £26bn) loan package to stave off default.
... Greece’s finance minister, George Papaconstantinou, said Athens wanted to discuss “a multi-year economic policy programme with the Commission, the European Central Bank and the International Monetary Fund”.
excerpt with permission
Historically, recoveries have been proportional to the recessions -- severe recessions have strong recoveries and mild recessions have weak recoveries. So far the recovery in industrial production this cycle looks about average. But given the depth and severity of the recessions an average rebound is disappointing.
NAHB Builder Confidence increases in April
by Calculated Risk on 4/15/2010 01:00:00 PM
The increase this month was driven by traffic of prospective buyers and current sales - and this was the last month that buyers can take advantage of the housing tax credit - so this increase was no surprise.
Note: any number under 50 indicates that more builders view sales conditions as poor than good. Click on graph for larger image in new window.
This graph shows the builder confidence index from the National Association of Home Builders (NAHB).
The housing market index (HMI) was at 19 in April. This is an increase from 15 in March.
The record low was 8 set in January 2009. This is very low - and this is what I've expected - a long period of builder depression. The HMI has been in the 15 to 19 range since May 2009.  This second graph compares the NAHB HMI (left scale) with single family housing starts (right scale). This includes the April release for the HMI and the February data for starts (March starts will be released tomorrow).
This shows that the HMI and single family starts mostly move generally in the same direction - although there is plenty of noise month-to-month.
And right now they are moving sideways - at best.
Press release from the NAHB: (TBA)
Hotel Occupancy increases during Easter Week
by Calculated Risk on 4/15/2010 12:06:00 PM
From HotelNewsNow.com: STR: Upscale segment tops occ. increases
Overall the industry’s occupancy increased 12.6 percent to 59.2 percent; ADR ended the week virtually flat with a 0.4-percent decrease to US$96.31; and RevPAR was up 12.1 percent to US$57.00.The following graph shows the occupancy rate by week and the 52 week rolling average since 2000.
“We saw strong RevPAR growth this week because of a favorable Easter comparison,” said Chad Church, industry research manager at STR.
 Click on graph for larger image in new window.
Notes: the scale doesn't start at zero to better show the change.
The graph shows the distinct seasonal pattern for the occupancy rate; higher in the summer because of leisure/vacation travel, and lower on certain holidays.
The occupancy rate was boosted by the Easter holiday, and even still the occupancy rate was below the average for this week of around 63% (usually without Easter). The 52 week average is moving up - and that is a good sign for hotels.
Data Source: Smith Travel Research, Courtesy of HotelNewsNow.com
Industrial Production, Capacity Utilization increase in March
by Calculated Risk on 4/15/2010 09:39:00 AM
From the Fed: Industrial production and Capacity Utilization
Industrial production edged up 0.1 percent in March and increased at an annual rate of 7.8 percent in the first quarter. Manufacturing output rose 0.9 percent in March, led by widespread gains among durable goods industries. Factory production was likely held down in February by the winter storms but nonetheless rose at an annual rate of 6.6 percent for the first quarter as a whole. The output of mines increased 2.3 percent in March. Utilities output dropped 6.4 percent; after a relatively cold February, demand for heating fell in March as temperatures climbed to above-normal levels. At 101.6 percent of its 2002 average, industrial output in March was 4.0 percent above its year-earlier level. Capacity utilization for total industry advanced 0.2 percentage point to 73.2 percent, a rate 7.4 percentage points below its average from 1972 to 2009, but 3.7 percentage points above the rate from a year earlier.
 Click on graph for larger image in new window.
This graph shows Capacity Utilization. This series is up 7.2% from the record low set in June 2009 (the series starts in 1967).
Capacity utilization at 73.2% is still far below normal - and 9.1% below the the pre-recession levels of 80.5% in November 2007.
Note: y-axis doesn't start at zero to better show the change.
Also - this is the highest level for industrial production since Dec 2008, but production is still 9.6% below the pre-recession levels at the end of 2007.
RealtyTrac: March Foreclosure Activity Highest on Record
by Calculated Risk on 4/15/2010 08:54:00 AM
From RealtyTrac: Foreclosure Activity Increases 7 Percent in First Quarter
RealtyTrac® ... today released its U.S. Foreclosure Market Report™ for Q1 2010, which shows that foreclosure filings — default notices, scheduled auctions and bank repossessions — were reported on 932,234 properties in the first quarter, a 7 percent increase from the previous quarter and a 16 percent increase from the first quarter of 2009. One in every 138 U.S. housing units received a foreclosure filing during the quarter.This is the highest monthly total - and highest quarterly total - since RealtyTrac started tracking foreclosures in 2005 (and that probably means this is the highest ever). Note that the initial stage filings (Notice of Default and Lis Pendens depending on the state) were flat with Q1 2009, but that later stage filings (of Trustee Sale and Notice of Foreclosure Sale and repossessions) surged:
Foreclosure filings were reported on 367,056 properties in March, an increase of nearly 19 percent from the previous month, an increase of nearly 8 percent from March 2009 and the highest monthly total since RealtyTrac began issuing its report in January 2005.
“Foreclosure activity in the first quarter of 2010 followed a very similar pattern to what we saw in the first quarter of 2009: a shallow trough in January and February followed by a substantial spike in March,” said James J. Saccacio, chief executive officer of RealtyTrac. “One difference, however, is that the increases were more tilted toward the final stage of foreclosure, with REOs increasing 9 percent on a quarterly basis in the first quarter of 2010 compared to a 13 percent quarterly decrease in REOs in the first quarter of 2009.
“This subtle shift in the numbers pushed REOs to the highest quarterly total we’ve ever seen in our report and may be further evidence that lenders are starting to make a dent in the backlog of distressed inventory that has built up over the last year as foreclosure prevention programs and processing delays slowed down the normal foreclosure timeline.”
Foreclosure auctions were scheduled for the first time on a total of 369,491 properties during the quarter, the highest quarterly total for scheduled auctions in the history of the report. Scheduled auctions increased 12 percent from the previous quarter and were up 21 percent from the first quarter of 2009.It appears that the banks are starting to clear out the foreclosure backlog.
Bank repossessions (REOs) also hit a record high for the report in the first quarter, with a total of 257,944 properties repossessed by the lender during the quarter — an increase of 9 percent from the previous quarter and an increase of 35 percent from the first quarter of 2009.
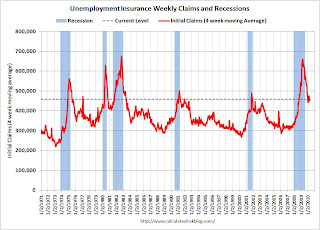
Weekly Initial Unemployment Claims Increase to 484,000
by Calculated Risk on 4/15/2010 08:34:00 AM
The DOL reports on weekly unemployment insurance claims:
In the week ending April 10, the advance figure for seasonally adjusted initial claims was 484,000, an increase of 24,000 from the previous week's unrevised figure of 460,000. The 4-week moving average was 457,750, an increase of 7,500 from the previous week's unrevised average of 450,250.
...
The advance number for seasonally adjusted insured unemployment during the week ending April 3 was 4,639,000, an increase of 73,000 from the preceding week's revised level of 4,566,000.
 Click on graph for larger image in new window.
This graph shows the 4-week moving average of weekly claims since 1971.
The four-week average of weekly unemployment claims increased this week by 7,500 to 457,750.
The dashed line on the graph is the current 4-week average. The current level of 484,000 (and 4-week average of 457,750) is still high, and suggests continuing weakness in the jobs market. This is much worse than expected.
Wednesday, April 14, 2010
Lawler: BoA and Chase on Second Mortgages
by Calculated Risk on 4/14/2010 11:06:00 PM
The following report is from housing economist Tom Lawler:
In a House Financial Services Committee meeting today on “Second Liens and Other Barriers to Principal Reduction as an Effective Foreclosure Mitigation Program, spokespersons from BoA, Citi, JPMorgan Chase, and Wells Fargo explained the potential dangers of broad principal reductions, as well as tried to dismiss the silly claim that many second mortgages have “virtually no value” because so many borrowers with seconds have total mortgage balances at or exceeding the value of the home collateralizing those mortgages. Below are some observations on BoA’s and Chase’s testimony.
BoA provided a few interesting stats: of the 10.4 million first lien mortgages that it services, 15% of second mortgages owned by BoA, while 16% have second mortgages with other lenders. (Thus, 31% have second liens!).
BoA also said that about 90% of BoA’s owned second-lien mortgage portfolio is made up of “standalone originations used to finance a specific customer need, such as education expenses or home improvements, with “(t)he remainder consists of piggy back (combo) loans originated with the home purchase.” BoA made this point to highlight that the vast bulk of its second mortgage lending was collateralized consumer credit lending, where the borrower’s ability to pay was a major factor behind extending the credit.
Here is what BoA said about their second mortgage portfolio:
“Most of our second loans continue to have collateral value, and of those where the second loan is underwater, a significant number are still performing. Indeed, out of 2.2 million second liens in Bank of America’s held for investment portfolio – only 91,000 seconds – about four percent – are (i) delinquent, (ii) behind a delinquent first mortgage and (iii) not supported by any equity.”
BoA’s spokesperson vexed a number of investors in first-lien mortgages (or securities backed by such mortgages) by saying that in cases where the first and second are held by different investors, the “logic of 2MP” (the administrations second mortgage program) where “the holder of the second lien is required to forebear a similar percentage as the first lien holder” seems “equitable” to BoA – despite the subordinate nature of the second, and despite the fact that the 2MP program does not require second mortgage holders to forgive principal, even when the first mortgage holder does!
Here is what Chase said about its Home Equity (second) mortgage portfolio:
Chase owns about $131 billion in Home Equity loans and lines as of February 28, 2010.
• Approximately $25 billion are home equity loans and $106 billion are home equity lines of credit.And on the issue of broad-based principal reduction programs, as well as the “subordinate” nature of second mortgages, here is what Chase had to say:
• Approximately $33 billion are in first lien position and $98 billion in second lien position.
• 5% of Chase’s home equity portfolio is 30 days or more delinquent. Total home equity line, home equity loan, first lien and second lien delinquency rates are within two percentage points of the overall total.
• About 50% of the total Chase second lien portfolio is underwater, and 95% of this portfolio is performing (less than 60 days past due). 30% of second lien mortgages have combined loan-to-value ratios over 125% and 94% of this portfolio is performing.
• For $40 billion of Chase-owned second lien mortgages, Chase also services a first lien mortgage:• 92% of these first lien mortgages are performing.• About 10% of Chase’s total serviced portfolio of first lien mortgage loans has a Chase-owned second lien.
• 28% of these first lien mortgages are by themselves underwater (loan- to-value ratio of over 100%).
• 45% of first lien mortgages have a combined loan- to-value ratio of over 100%.
• Our best estimate is that about 20% of Chase serviced first lien mortgages may have a second lien from another lender and about 70% do not have a second lien.
“We do think that large scale, broad–based principal reduction programs raise serious policy concerns, for both first and second lien mortgage loans, and particularly for current borrowers with an ability to repay their obligations. In Chase’s view, such programs could be potentially very harmful to consumers, investors and future mortgage market conditions – and should not be undertaken without first attempting other solutions, including more targeted modification efforts.
“Like all loans, mortgage contracts are based on a promise to repay money borrowed. Importantly, there is no provision in the mortgage contract, express or implied, that the lender will restore equity or reduce the repayment amount if the value of the collateral – be it a home, a car or a stock market investment – depreciates. If we re-write the mortgage contract retroactively to restore equity to any mortgage borrower because the value of his or her home declined, what responsible lender will take the equity risk of financing mortgages in the future? What responsible regulator would want lenders to take such risk?
“We are also concerned that broad-based principal reduction could result in reduced access to credit and higher costs for consumers if market risk to lenders and investors materially increases. Borrowers likely will be required to increase their down payments, credit criteria will be further tightened and risk premiums for mortgage credit will increase and get passed on to consumers. Less affluent borrowers would likely be harmed disproportionately.
“The benefits of a broad-based principal reduction program are to a large degree unknown and in Chase’s view, outweighed by the risks and the facts that we do know.”
And here is Chase on why many second loan portfolios are performing better than firsts, as well as the risks involved in broad-based principal reduction plans:
“Many borrowers remain current on their home equity loans because they want to honor their obligations and protect their credit. Our data show that 97% of borrowers in Chase’s $98 billion second lien portfolio are performing on their loans (less than 60 days past due). For second liens that have a cumulative loan-to-value ratio greater than 100%, 95% of borrowers are performing. Regardless of loan-to-value, as long as borrowers continue to do the right thing and fulfill their contractual obligations, second liens that are current and producing cash flow to investors have value."
“Additionally, a broad-based second-lien principal reduction plan would be forgiving past consumption by borrowers rather than housing investment. According to both internal Chase and Federal Reserve data, over 50% of borrowers used home equity loan proceeds for repayment of debt or personal consumption. No more than 15-20% used home equity proceeds to purchase a home. A broad-based program of principal reduction would be very expensive. To bring underwater borrowers “even” to a loan to value ratio of 100%, we estimate:
• It would have an industry-wide cost of $700 billion to $900 billion.And on the issue of LIEN priority, here is what Chase had to say:
• The cost to Fannie Mae, Freddie Mac and FHA alone would be in the neighborhood of $150 billion.
• The Federal Reserve and Department of Treasury would have additional exposure through their ownership interests and risk guarantees of AIG, GMAC, and other institutions.
• Mortgage lenders would incur a significant reduction in capital now, potentially impairing their ability to extend future credit – mortgage or otherwise.
• And if house prices decline further, the costs would be even higher, representing the implicit “put” at 100% CLTV. “
“It is important not to confuse payment priority with lien priority. In almost all scenarios, second lien holders have rights equal to a first lien holder with respect to a borrower’s cash flow. The same is true with respect to other secured or unsecured debt, such as credit cards or car loans. Generally, consumers can decide how they want to manage their monthly payments. In fact, almost 64% of borrowers who are 30-59 days delinquent on a first lien serviced by Chase are current on their second lien. It is only at liquidation or property disposition that first lien investors have priority.”
The banks’ testimony, of course, was in response to a letter from Barney Frank, who has been heavily lobbied (and influenced) by the Mortgage Investors Coalition to get second mortgage holders to write down their loans. In that letter Congressman Frank incorrectly argued that because many borrowers with second mortgages have total mortgage indebtedness that exceeds the value of their homes, these second mortgages “have no real economic value,” and he urged banks “in the strongest possible terms to take immediate steps to write down these second mortgages.”
Here, by the way, are some residential mortgage servicing statistics as of the end of last year for the top four mortgage servicers:
| 12/31/2009 | Delinquency Stats: Q4/09 | |||||
|---|---|---|---|---|---|---|
| Company Name | Number of Loans Serviced1 | 30-day | 60-day | 90+-day | In Foreclosure | Total Past Due |
| Bank of America | 14,011,029 | 3.4% | 1.7% | 6.5% | 3.3% | 14.8% |
| Wells Fargo | 12,168,836 | 2.4% | 1.2% | 3.5% | 1.9% | 9.0% |
| Chase | 9,689,312 | 3.0% | 1.4% | 4.6% | 3.2% | 12.2% |
| CitiMortgage, Inc. | 5,118,563 | 2.3% | 1.4% | 4.9% | 1.7% | 10.4% |
1 includes first liens and subordinate liens
These “mega” servicers were, through the economies of scale in processing payments, able to charge a pretty small fee to service loans and still make what appeared to be a decent amount of money. However, as problem loans mounted it became clear that the companies were woefully understaffed to deal with these problem loans effectively, leading to extremely poor loss mitigation efforts, poorly designed foreclosure prevention/modification programs.
All of these companies finally began materially increasing the size of their staffs devoted to troubled loan management, and the administration’s HAMP effort helped prompt them to do so by providing hefty premiums to servicers. However, it took companies quite a while to get staff and board and train them, as was clearly evidence in last year’s overall servicing performance.
NOTE: This was from housing economist Tom Lawler.
Iceland Bank "Black Report"
by Calculated Risk on 4/14/2010 08:16:00 PM
The English version of the Black Report on the Iceland bank failures was released today. It has it all - regulatory capture, oblivious politicians, shadow banking, loans to shareholders to buy shares and more. (ht Steinn)
Here is the website with the English version.
The following graph is from Chapter 21: Causes of the Collapse of the Icelandic Banks - Responsibility, Mistakes and Negligence Click on graph for larger image in new window
Here is an excerpt from the long report:
[This figure] shows the lending of the three big banks’ parent companies, classified by type of borrowers. The lending by the parent companies amounted usually to 50-60% of all lending by the banking groups from mid-2004. ... the largest and steadiest increase in lending was to holding companies on the one hand and to foreign parties on the other. The increase in lending to foreign parties was notably larger. The increase was especially big during the latter part of 2007. During the first part of 2007 the Icelandic banks increased their lending to foreign parties by 800 million EUR, to 8.3 billion EUR. During the latter part of that year, i.e. after the beginning of the international liquidity crisis in mid-summer 2007, the lending to foreign parties increased however by 11.4 billion EUR, to 20.7 billion EUR. Thereby, lending by the banks’ parent companies to foreign parties increased by more than 120% in just six months. As stated in Chapter 8, this increase was seen in all three banks, an increase of 5 billion in Kaupthing and 3 billion each in Landsbanki and Glitnir. The [Special Investigation Commission] (SIC) notes that this increased lending started at about the same time as the liquidity crisis in the international financial markets began. The increase was so substantial that it can be assumed that many of the new customers had turned to the Icelandic banks after other banks had made arrangements to reduce their lending and that these customers had therefore been refused service by other banks.It sounds like the Icelandic banks were making bad loans right at the wrong time.
One of the key problems identified in the report is "weak equity". Although some of these arrangment were complicated, basically the bank would loan money to an owner who would buy shares in the bank - and use those shares as collateral for the loan. This boosted the apparent capital, and allowed the bank to lend more money. Amazing.
The largest owners of all the big banks had abnormally easy access to credit at the banks they owned, apparently in their capacity as owners.Geesh - that reminds me of Enron.
...
The banks had invested their funds in their own shares. Share capital, financed by the company itself, is not the protection against loss it is intended to be. Here this is referred to as “weak equity”. Weak equity in the three banks amounted to about ISK 300 billion by mid year 2008. At the same time, the capital base of the banks was about ISK 1,186 billion in total. Weak equity, therefore, represented more than 25% of the banks’ capital base. If only the core component of the capital base is examined, i.e. shareholders’ equity, according to the annual accounts, less intangible assets, the weak equity of the three banks amounted to more than 50% of the core component in mid year 2008.
Here is the executive summary for a quick read.


