 RSS Feed
 by Calculated Risk on 5/07/2025 09:32:00 AM
Wednesday, May 07, 2025
Wholesale Used Car Prices Increased in April; Up 4.9% Year-over-year
From Manheim Consulting today: Wholesale Used-Vehicle Prices Increased in April
Wholesale used-vehicle prices (on a mix, mileage, and seasonally adjusted basis) were much higher in April compared to March. The Manheim Used Vehicle Value Index (MUVVI) increased to 208.2, an increase of 4.9% from a year ago and also higher than March levels by 2.7%. This is the highest reading for the index since October 2023. The seasonal adjustment dampened the rise seen in the month, as non-seasonally adjusted values increased sharply on the back of the tariff announcement in early April. The non-adjusted price in April increased by 3.3% compared to March, moving the unadjusted average price up 4.3% year over year.
emphasis added
 Click on graph for larger image.
This index from Manheim Consulting is based on all completed sales transactions at Manheim’s U.S. auctions.
The Manheim index suggests used car prices increased in April (seasonally adjusted) and were up 4.9% YoY.
The tariffs are likely making some used cars more attractive.
MBA: Mortgage Applications Increase in Latest MBA Weekly Survey
by Calculated Risk on 5/07/2025 07:00:00 AM
From the MBA: Mortgage Applications Increase in Latest MBA Weekly Survey
Mortgage applications increased 11.0 percent from one week earlier, according to data from the Mortgage Bankers Association’s (MBA) Weekly Mortgage Applications Survey for the week ending May 2, 2025.
The Market Composite Index, a measure of mortgage loan application volume, increased 11.0 percent on a seasonally adjusted basis from one week earlier. On an unadjusted basis, the Index increased 12 percent compared with the previous week. The Refinance Index increased 11 percent from the previous week and was 51 percent higher than the same week one year ago. The seasonally adjusted Purchase Index increased 11 percent from one week earlier. The unadjusted Purchase Index increased 12 percent compared with the previous week and was 13 percent higher than the same week one year ago.
“The economic news last week included a negative reading for first-quarter GDP growth and further signs of contraction in the manufacturing sector, mixed with a solid employment report for April. The net impact on mortgage rates was mostly downward but just back to levels from early April. The 30-year fixed rate declined to 6.84 percent,” said Mike Fratantoni, MBA’s SVP and Chief Economist. “Conventional purchase application volume increased 13 percent and was up 9 percent from year-ago levels, a surprisingly strong move given lingering economic uncertainty. Borrowers of conventional loans tend to have larger loan sizes and more apt to be move-up buyers. Government purchase loans were also up 6 percent for the week, led by a 9 percent growth in FHA purchase applications.”
Added Fratantoni, “With rates moving lower, refinance volume increased 11 percent, led by VA refinance applications, which were up 26 percent.”
...
The average contract interest rate for 30-year fixed-rate mortgages with conforming loan balances ($806,500 or less) decreased to 6.84 percent from 6.89 percent, with points increasing to 0.68 from 0.67 (including the origination fee) for 80 percent loan-to-value ratio (LTV) loans. The effective rate decreased from last week.
emphasis added
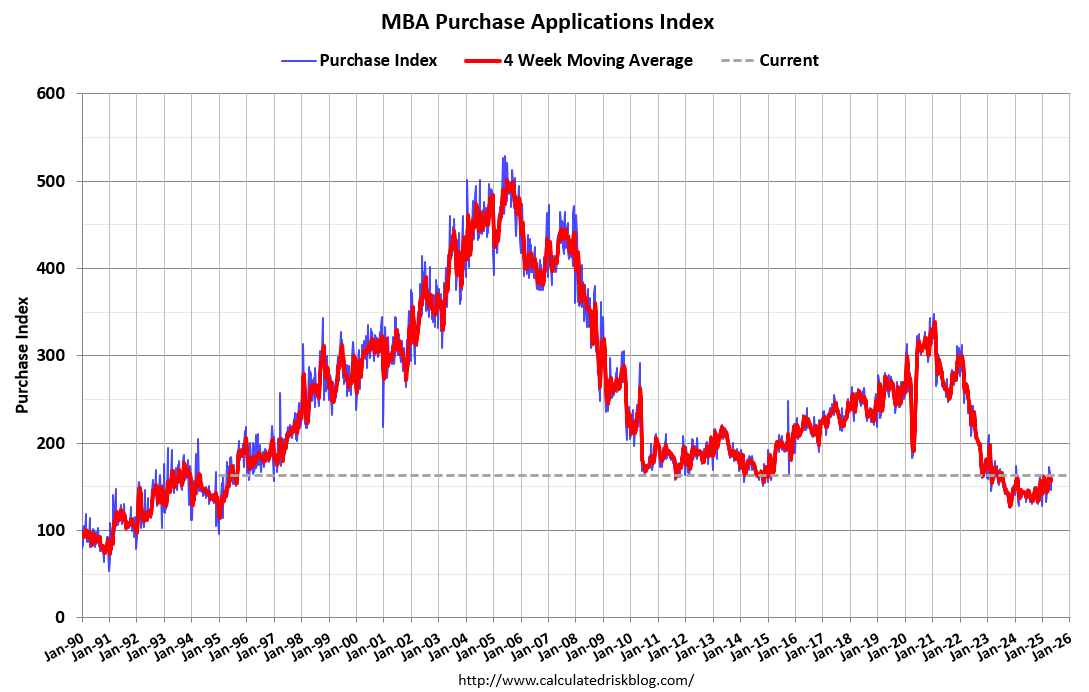 Click on graph for larger image.
The first graph shows the MBA mortgage purchase index.
According to the MBA, purchase activity is up 13% year-over-year unadjusted.
Red is a four-week average (blue is weekly).
Purchase application activity is up from the lows in late October 2023 and is 8% above the lowest levels during the housing bust.
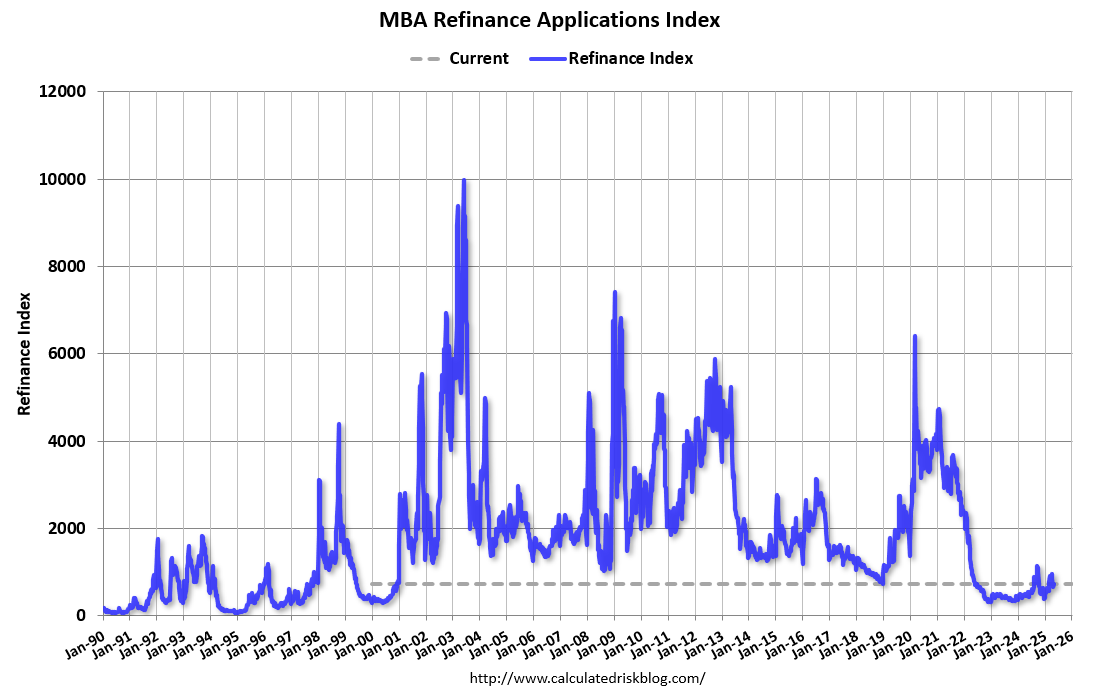
The second graph shows the refinance index since 1990.
The refinance index increased but remained very low.
Tuesday, May 06, 2025
Wednesday: FOMC Meeting
by Calculated Risk on 5/06/2025 07:46:00 PM
 Note: Mortgage rates are from MortgageNewsDaily.com and are for top tier scenarios.
Wednesday:
• At 7:00 AM ET, The Mortgage Bankers Association (MBA) will release the results for the mortgage purchase applications index.
• At 2:00 PM, FOMC Meeting Announcement. No change to to the Fed funds rate is expected at this meeting.
• At 2:30 PM, Fed Chair Jerome Powell holds a press briefing following the FOMC announcement.
TSA: Airline Travel Unchanged YoY
by Calculated Risk on 5/06/2025 02:01:00 PM
Anecdotally, I've heard that airlines ticket prices are falling. That suggests less travel. Also, the Real ID restrictions go in place tomorrow, and that might impact domestic airline travel.
This is also something to watch with less international travel.
Here are the daily travel numbers from the TSA.
This data is as of May 5, 2025.
 Click on graph for larger image.
This data shows the 7-day average of daily total traveler throughput from the TSA (Blue).
This data is as of May 5, 2025.
 Click on graph for larger image.
This data shows the 7-day average of daily total traveler throughput from the TSA (Blue).
Air travel is essentially unchanged YoY (up about 0.3% YoY).
The red line is the percent of 2019 for the seven-day average. Air travel - as a percent of 2019 - is up about 4% from pre-pandemic levels.
The red line is the percent of 2019 for the seven-day average. Air travel - as a percent of 2019 - is up about 4% from pre-pandemic levels.
Asking Rents Mostly Unchanged Year-over-year
by Calculated Risk on 5/06/2025 10:29:00 AM
Today, in the Real Estate Newsletter: Asking Rents Mostly Unchanged Year-over-year
Brief excerpt:
Another monthly update on rents.This is much more in the article.
Tracking rents is important for understanding the dynamics of the housing market. Slower household formation and increased supply (more multi-family completions) has kept asking rents under pressure.
More recently, immigration policy has become a negative for rentals.
Apartment List: Asking Rent Growth -0.3% Year-over-year ...
On the supply side of the rental market, our national vacancy index ticked up to 7 percent, setting a new record high in the history of that monthly data series, which goes back to the start of 2017. After a historic tightening in 2021, multifamily occupancy has been slowly but consistently easing for over three years amid an influx of new inventory. 2024 saw the most new apartment completions since the mid-1980s, and although we’re past the peak of new multifamily construction, this year is still expected to bring a robust level of new supply.Realtor.com: 20th Consecutive Month with Year-over-year Decline in RentsIn March 2025, the U.S. median rent recorded its 20th consecutive year-over-year decline, dropping 1.2% for 0-2 bedroom properties across the 50 largest metropolitan areas.

Trade Deficit increased to $140.5 Billion in March
by Calculated Risk on 5/06/2025 08:30:00 AM
The Census Bureau and the Bureau of Economic Analysis reported:
The U.S. Census Bureau and the U.S. Bureau of Economic Analysis announced today that the goods and services deficit was $140.5 billion in March, up $17.3 billion from $123.2 billion in February, revised.
March exports were $278.5 billion, $0.5 billion more than February exports. March imports were $419.0 billion, $17.8 billion more than February imports.
emphasis added
 Click on graph for larger image.
Exports and imports increased in March.
Exports were up 6.7% year-over-year; imports were up 27.1% year-over-year.
Exports have generally increased recently, and imports increased sharply as importers rushed to beat tariffs.
The second graph shows the U.S. trade deficit, with and without petroleum.
 The blue line is the total deficit, and the black line is the petroleum deficit, and the red line is the trade deficit ex-petroleum products.
Note that net, exports of petroleum products are positive and have been increasing.
The trade deficit with China increased to $17.9 billion from $17.2 billion a year ago.
The surge in imports in January through March happened as some importers were avoiding the coming tariffs.
Monday, May 05, 2025
Tuesday: Trade Balance
by Calculated Risk on 5/05/2025 07:15:00 PM
 From Matthew Graham at Mortgage News Daily: Mortgage Rates Roughly Unchanged to Start New Week
Mortgage rates faced a slight headwind on Monday as economic data caused weakness in the bond market. This would typically result in higher mortgage rates, but in today's case, the damage was minimal.Tuesday:
One thing to keep in mind is that mortgage rates don't change in real time with the market. Lenders set rates once in the morning and only change them when the bond market experiences a certain threshold of volatility. A small handful of lenders met that threshold and ended up raising rates this afternoon, but the average lender remained right in line with Friday. [30 year fixed 6.82%]
emphasis added
• At 8:30 AM: Trade Balance report for March from the Census Bureau. The consensus is the trade deficit to be $129.0 billion. The U.S. trade deficit was at $122.7 billion in February as importers rushed to beat the tariffs.
Recession Watch Metrics
by Calculated Risk on 5/05/2025 02:14:00 PM
Early in February, I expressed my "increasing concern" about the negative economic impact of "executive / fiscal policy errors", however, I concluded that post by noting that I was not currently on recession watch.
In early April, I went on recession watch, but I'm still not yet predicting a recession for several reasons: the U.S. economy is very resilient and was on solid footing at the beginning of the year, the administration might reverse many of the tariffs (we've seen that before), and Congress might take back complete authority for tariffs. Also, perhaps these tariffs are not enough to topple the economy.
"We should be looking to trade with the rest of the world, and we should do what we do best, and they should do what they do best ... Trade should not be a weapon.”In the short term, it is mostly trade policy that will negatively impact the economy. However, there are several policies that will negatively impact the economy in the long run, and I'll discuss those later.
Here is some of the data I'm watching.
Housing: Housing is the basis of one of my favorite models for business cycle forecasting.
 This graph shows the YoY change in New Home Sales from the Census Bureau. Currently new home sales (based on 3-month average of NSA data) are up 2% year-over-year.
Usually when the YoY change in New Home Sales falls about 20%, a recession will follow. An exception for this data series was the mid '60s when the Vietnam buildup kept the economy out of recession. Another exception was in late 2021 - we saw a significant YoY decline in new home sales related to the pandemic and the surge in new home sales in the second half of 2020. I ignored that downturn as a pandemic distortion. Also note that the sharp decline in 2010 was related to the housing tax credit policy in 2009 - and was just a continuation of the housing bust.
The YoY change in new home sales in late 2022 and early 2023 suggested a possible recession. But as I noted earlier, I was able to look past the pandemic distortion and was able to predict a pickup in new home sales due to the low level of existing home inventory and because homebuilders could offer mortgage incentives that would somewhat offset the sharp increase in mortgage rates.
There are no special circumstances now, and if this measure falls to off 20% a recession seems likely.
Yield Curve: The yield curve is a commonly used leading indicator. I dismissed it when the yield curve inverted in 2019 and again in 2022. Both times dismissing the yield curve was correct (the recession in 2020 was obviously due to the pandemic, so we will never know if the yield curve failed to predict a recession in 2019).

Here is a graph of 10-Year Treasury Constant Maturity Minus 2-Year Treasury Constant Maturity from FRED since 1976.
The yield curve reverted to normal last year and is currently positive at 0.50. If this inverts, this might suggest a recession is coming.


Heavy Truck (and Vehicle Sales): Another indicator I like to use is heavy truck sales. This graph shows heavy truck sales since 1967 using data from the BEA. he dashed line is the April 2025 seasonally adjusted annual sales rate (SAAR) of 403 thousand. Note: "Heavy trucks - trucks more than 14,000 pounds gross vehicle weight."
Heavy truck sales were at 505 thousand SAAR in April, up from 450 thousand in March, and up 0.8% from 501 thousand SAAR in April 2025 (essentially unchanged YoY).
Usually, heavy truck sales decline sharply prior to a recession and sales were solid in April. It is likely that some April truck buyers rushed to beat the tariffs - and we might see some weakness next month.
 And light vehicle sales were strong in April.
 This graph shows light vehicle sales since the BEA started keeping data in 1967. This is more of a concurrent indicator than heavy trucks.
Light vehicle sales were at 17.27 million SAAR in April, down 3.1% from March, and up 7.8% from April 2024 as some buyers rushed to beat the tariffs.
Unemployment: Two other concurrent indicators are the unemployment rate (using the "Sahm Rule") and weekly unemployment claims.
 Here is a graph of the Sahm rule from FRED since 1959.
The Sahm Rule was at 0.27 in March (Last data at FRED) and increased to 0.30 in April.
If this increases to 0.5 it will suggest a possible recession.
 And weekly unemployment claims always rise sharply at the beginning of a recession (other events - like hurricane Katrina - can cause a temporary spike in weekly claims).
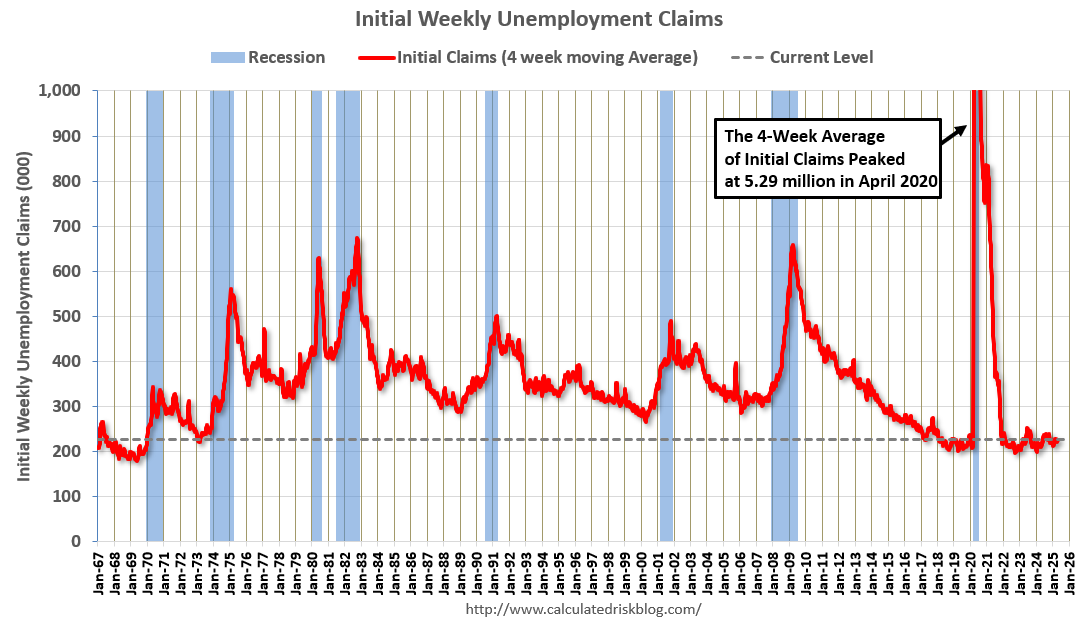 And weekly unemployment claims always rise sharply at the beginning of a recession (other events - like hurricane Katrina - can cause a temporary spike in weekly claims).
As I noted earlier, I'm not sure how to estimate the economic damage caused by these tariffs. And they might just go away (no one knows). There are also boycotts of U.S. goods and less international tourism based on both the tariffs and the inflammatory rhetoric of the new administration.
None of the leading are suggesting recession. For now, I'll focus on the leading indicators (especially housing) and I'll update this post monthly while I'm on recession watch.
ICE Mortgage Monitor: Home Prices Continue to Cool
by Calculated Risk on 5/05/2025 11:56:00 AM
Today, in the Real Estate Newsletter: ICE Mortgage Monitor: Home Prices Continue to Cool
Brief excerpt:
House Price Growth Continues to SlowThere is much more in the newsletter.
Here is the year-over-year in house prices according to the ICE Home Price Index (HPI). The ICE HPI is a repeat sales index. ICE reports the median price change of the repeat sales. The index was up 2.4% year-over-year in March, down from 3.5% YoY in February. The early look at the April HPI shows a 1.9% YoY increase.
• Improved inventory levels are providing more options and a softer price dynamic for homeowners shopping this springThere is much more in the mortgage monitor.
• Annual home price growth cooled to a revised +2.4% in March from +3.5% at the start of the year, with an early look at April data via ICE’s enhanced Home Price Index suggesting price growth has cooled further to +1.9% which would mark the slowest growth rate in nearly two years
• Early April data also shows home prices rose by a modest 0.1% in the month on a seasonally adjusted basis, which would mark the softest single month growth since late 2023 when mortgage rates had climbed above 7.5%
• If recent seasonally adjusted gains persist, the annual home price growth rate would cool further in Q2
• Single family prices were up by +2.1% from the same time last year, with condos down -0.4%, marking the first such annual decline since 2012
• All in, nearly half of major markets are seeing condo prices down from last years levels, with the largest declines in Florida, especially in areas heavily impacted by last year’s hurricanes

ISM® Services Index Increased to 51.6% in April
by Calculated Risk on 5/05/2025 10:00:00 AM
(Posted with permission). The ISM® Services index was at 51.6%, up from 50.8% last month. The employment index increased to 49.0%, from 46.2%. Note: Above 50 indicates expansion, below 50 in contraction.
From the Institute for Supply Management: Services PMI® at 51.6% April 2025 Services ISM® Report On Business®
Economic activity in the services sector expanded for the 10th consecutive month in April, say the nation's purchasing and supply executives in the latest Services ISM® Report On Business®. The Services PMI® registered 51.6 percent, indicating expansion for the 56th time in 59 months since recovery from the coronavirus pandemic-induced recession began in June 2020.This was below consensus expectations.
The report was issued today by Steve Miller, CPSM, CSCP, Chair of the Institute for Supply Management® (ISM®) Services Business Survey Committee: “In April, the Services PMI® registered 51.6 percent, 0.8 percentage point higher than the March figure of 50.8 percent. The Business Activity Index registered 53.7 percent in April, 2.2 percentage points lower than the 55.9 percent recorded in March. This is the index’s 59th consecutive month of expansion. The New Orders Index recorded a reading of 52.3 percent in April, 1.9 percentage points higher than the March figure of 50.4 percent. The Employment Index stayed in contraction territory for the second month in a row; the reading of 49 percent is a 2.8-percentage point increase compared to the 46.2 percent recorded in March.
“The Supplier Deliveries Index registered 51.3 percent, 0.7 percentage point higher than the 50.6 percent recorded in March. This is the fifth consecutive month that the index has been in expansion territory, indicating slower supplier delivery performance. (Supplier Deliveries is the only ISM® Report On Business® index that is inversed; a reading of above 50 percent indicates slower deliveries, which is typical as the economy improves and customer demand increases.)
“The Prices Index registered 65.1 percent in April, a 4.2-percentage point increase from March’s reading of 60.9 percent and a fifth consecutive reading above 60 percent. The Inventories Index registered its third consecutive month in expansion territory in April, registering 53.4 percent, an increase of 3.1 percentage points from March’s figure of 50.3 percent. The Inventory Sentiment Index expanded for the 24th consecutive month, registering 56.1 percent, down 0.5 percentage point from March’s reading of 56.6 percent. The Backlog of Orders Index registered 48 percent in April, a 0.6-percentage point increase from the March figure of 47.4 percent, indicating contraction for the eighth time in the last nine months.
“Eleven industries reported growth in April, a drop of three from the 14 industries reported in January and February. The Services PMI® has expanded in 55 of the last 58 months dating back to June 2020. The April reading of 51.6 percent is 1 percentage point below the 12-month average reading of 52.6 percent.”
Miller continues, “April’s change in indexes was a reversal of March’s direction, with increases in three (New Orders, Employment and Supplier Deliveries) of the four subindexes that directly factor into the Services PMI®. Of those four, only the Business Activity Index had a lower reading compared to March. Employment continues to be the only one of these subindexes in contraction territory, with two straight months of contraction. From December through February, all four subindexes were in expansion. Regarding tariffs, respondents cited actual pricing impacts as concerns, more so than uncertainty and future pressures. Respondents continue to mention federal agency budget cuts as a drag on business, but overall, results are improving.”
emphasis added


