 RSS Feed
 by Calculated Risk on 4/24/2010 08:49:00 AM
Saturday, April 24, 2010
Vehicle Sales: Fleet Turnover Ratio
Way back, during the darkest days of the recession, I wrote a couple of optimistic posts about auto sales - Vehicle Sales (Jan 2009) and Looking for the Sun (Feb 2009). By request, here is an update to the U.S. fleet turnover graph.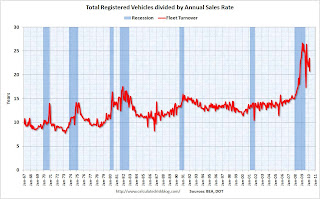 Click on graph for larger image in new window.
This graph shows the total number of registered vehicles in the U.S. divided by the sales rate through March 2010 - and gives a turnover ratio for the U.S. fleet (this doesn't tell you the age or the composition of the fleet).
The recent wild gyrations were due to the cash-for-clunkers program. Note: We are getting used to wild gyrations in economic numbers - just watch the housing numbers over the next few months!
The estimated ratio for March was just under 21 years - still very high, but well below the peak of almost 27 years. The turnover ratio will probably decline further over the next few years.
As expected some vehicles were removed from the fleet during the recession (scrappage exceeded sales), from RL Polk: Polk Finds More Vehicles Scrapped than Added to Fleet:
More than 14.8 million cars and light trucks were retired from the fleet between July 1, 2008 and September 30, 2009, compared to new registrations of slightly more than 13.6 million, resulting in an overall scrap rate of 6.1 percent. This includes thousands of units scrapped during last year’s CARS program, known as ‘Cash for Clunkers,’ and follows a trend seen by Polk over the past five years.Removing vehicles from the fleet reduces the turnover ratio, but most of the expected decline in the ratio will come from further increases in sales.
Polk also reports an increase in the average age of light vehicles on the road, up 21 percent in the past 14 years. The average age for all light vehicles during the 15-month period is 10.2 years ...
 The second graph shows light vehicle sales since the BEA started keeping data in 1967.
 Light vehicle sales were at a 11.8 million SAAR in March. To bring the turnover ratio down to more normal levels, unit sales will probably have to rise to 14 or 15 million SAAR eventually. Of course cars are lasting longer - note the general uptrend in the first graph - so the turnover ratio probably will not decline to the previous level. Also this says nothing about the composition of the fleet (perhaps smaller cars).
Friday, April 23, 2010
Unofficial Problem Bank List April 23, 2010
by Calculated Risk on 4/23/2010 11:38:00 PM
This is an unofficial list of Problem Banks compiled only from public sources.
Here is the unofficial problem bank list for April 23, 2010.
Changes and comments from surferdude808:
Bank closings dictated many changes to the Unofficial Problem Bank List this week. The failures in Illinois -- Amcore Bank, National Association ($3.8 billion), Broadway Bank ($1.2 billion), New
Century Bank ($510 million), Wheatland Bank ($437 million), Lincoln Park Savings Bank ($205 million), Peotone Bank and Trust Company ($136 million), and Citizens Bank and Trust Company of Chicago ($77 million) -- removed seven banks and $6.3 billion of assets.
Another removal this week was Paragon Bank & Trust ($107 million), a subsidiary of Capitol Bancorp (Ticker: CBC), which merged with its affiliate Michigan Commerce Bank that is also subject to a formal action. There were four additions this week including Sun National Bank, Vineland, NJ ($3.6 billion Ticker: SNBC); Great Florida Bank, Coral Gables, FL ($1.8 billion Ticker: GFLB); Central Virginia Bank, Powhatan, VA ($472 million Ticker: CVBK); and The Bank of Currituck, Moyock, NC ($197 million).
The net of these changes result in the Unofficial Problem Bank List having 694 institutions with aggregate assets of $366.1 billion. Other changes include the termination of the Prompt Corrective Action against Heritage Bank, Topeka, KS, and a name change for AmericasBank to CFG Community Bank. Next week, we look for the FDIC to release its new actions for March 2010.
Bank Failures #55 - 57: More Illinois
by Calculated Risk on 4/23/2010 08:12:00 PM
Good banks are few, far between
Even less so now
by Soylent Green is People
From the FDIC: Northbrook Bank and Trust Company, Northbrook, Illinois, Assumes All of the Deposits of Lincoln Park Savings Bank, Chicago, Illinois
As of December 31, 2009, Lincoln Park Savings Bank had approximately $199.9 million in total assets and $171.5 million in total deposits....From the FDIC: First Midwest Bank, Itasca, Illinois, Assumes All of the Deposits of Peotone Bank and Trust Company, Peotone, Illinois
The FDIC estimates that the cost to the Deposit Insurance Fund (DIF) will be $48.4 million.... Lincoln Park Savings Bank is the 55th FDIC-insured institution to fail in the nation this year, and the eighth in Illinois. The last FDIC-insured institution closed in the state was New Century Bank, Chicago, earlier today.
As of December 31, 2009, Peotone Bank and Trust Company had approximately $130.2 million in total assets and $127.0 million in total deposits. ...From the FDIC: Wheaton Bank & Trust, Wheaton, Illinois, Assumes All of the Deposits of Wheatland Bank, Naperville, Illinois
The FDIC estimates that the cost to the Deposit Insurance Fund (DIF) will be $31.7 million. ... Peotone Bank and Trust Company is the 56th FDIC-insured institution to fail in the nation this year, and the ninth in Illinois. The last FDIC-insured institution closed in the state was Lincoln Park Savings Bank, Chicago, earlier today.
As of December 31, 2009, Wheatland Bank had approximately $437.2 million in total assets and $438.5 million in total deposits. ...Seven in Illinois today ...
The FDIC estimates that the cost to the Deposit Insurance Fund (DIF) will be $133.0 million. ... Wheatland Bank is the 57th FDIC-insured institution to fail in the nation this year, and the tenth in Illinois. The last FDIC-insured institution closed in the state was Peotone Bank and Trust Company, Peotone, earlier today.
Bank Failures #51 -54: Illinois
by Calculated Risk on 4/23/2010 07:13:00 PM
Feds round up gangster-banksters
So much deja-vu
by Soylent Green is People
From the FDIC: Harris National Association, Chicago, Illinois, Assumes All Of The Deposits Of Amcore Bank, National Association, Rockford, Illinois
As of December 31, 2009, Amcore Bank, National Association had approximately $3.8 billion in total assets and $3.4 billion in total deposits....From the FDIC: MB Financial Bank, National Association, Chicago, Illinois, Assumes All Of The Deposits Of Broadway Bank, Chicago, Illinois
The FDIC estimates that the cost to the Deposit Insurance Fund (DIF) will be $220.3 million. .... Amcore Bank, National Association is the 51st FDIC-insured institution to fail in the nation this year, and the fourth in Illinois. The last FDIC-insured institution closed in the state was Bank of Illinois, Normal, on March 3, 2010.
As of December 31, 2009, Broadway Bank had approximately $1.2 billion in total assets and $1.1 billion in total deposits. ...From the FDIC: Republic Bank Of Chicago, Oak Brook, Illinois, Assumes All Of The Deposits Of Citizens Bank&Trust Company Of Chicago, Chicago, Illinois
The FDIC estimates that the cost to the Deposit Insurance Fund (DIF) will be $394.3 million. ... Broadway Bank is the 52nd FDIC-insured institution to fail in the nation this year, and the fifth in Illinois. The last FDIC-insured institution closed in the state was Amcore Bank, National Association, Rockford, earlier today.
As of December 31, 2009, Citizens Bank&Trust Company of Chicago had approximately $77.3 million in total assets and $74.5 million in total deposits....From the FDIC: MB Financial Bank, National Association, Chicago, Illinois, Assumes All Of The Deposits Of New Century Bank, Chicago, Illinois
The FDIC estimates that the cost to the Deposit Insurance Fund (DIF) will be $20.9 million. ... Citizens Bank&Trust Company of Chicago is the 53rd FDIC-insured institution to fail in the nation this year, and the sixth in Illinois. The last FDIC-insured institution closed in the state was Broadway Bank, Chicago, earlier today.
As of December 31, 2009, New Century Bank had approximately $485.6 million in total assets and $492.0 million in total deposits....
The FDIC estimates that the cost to the Deposit Insurance Fund (DIF) will be $125.3 million..... New Century Bank is the 54th FDIC-insured institution to fail in the nation this year, and the seventh in Illinois. The last FDIC-insured institution closed in the state was Citizens Bank&Trust Company of Chicago, Chicago, earlier today.
Rating Agency Testimony: "Must say yes" to Wall Street
by Calculated Risk on 4/23/2010 03:34:00 PM
From Kevin Hall at McClatchy Newspapers: Executives testify: Bond-rating agencies corrupted themselves
Testifying under oath before the Senate Permanent Subcommittee on Investigations, officials who were closely involved in giving investment-grade ratings to complex financial instruments backed by shaky U.S. mortgages described how they were pressured to give Wall Street what it wanted.The testimony is pretty amazing, but how is this being fixed?
...
Called to appear before the panel, Richard Michalek, a former Moody's vice president and senior credit officer, described the ratings process for deals that could bring more than $1 million in fees as a "must say yes" atmosphere.
Home Sales: Distressing Gap
by Calculated Risk on 4/23/2010 01:00:00 PM
First a comment on the seasonal adjustment ... on a Not Seasonally Adjusted (NSA) basis, the Census Bureau reported there were 38,000 new homes sold in March. That is up from 31,000 in March 2009.
Some (or all) of the increase was due to a one time event - the tax credit that expires in April. The Census Bureau doesn't know the number of homes sold due to the tax credit, so they report the Seasonally Adjusted Annual Rate (SAAR) assuming this is the underlying rate of sales. It isn't.
The April new home sales headline number will be distorted too, but the key is the actual underlying sales rate is much lower.
Note: remember the tax credit shows up in the new home sales numbers when the contract is signed (March and April), and in the existing home sales numbers when the transactions are closed (April through June).
The following graph shows existing home sales (left axis) and new home sales (right axis) through March. Click on graph for larger image in new window.
The initial gap was caused by the flood of distressed sales. This kept existing home sales elevated, and depressed new home sales since builders couldn't compete with the low prices of all the foreclosed properties.
The spike in existing home sales last year was due primarily to the first time homebuyer tax credit. Notice that there was also a bump last year in new home sales from the tax credit.
We are seeing another bump this year with the expiration of the extension of the tax credit.
The second graph shows the same information as a ratio - new home sales divided by existing home sales - through March 2010. The ratio increased because the tax credit impacts new home sales first. I suspect this ratio will be at or near the all time low later this year.
Eventually this ratio will return to the historical range of new home sales being around 15% to 20% of existing home sales. However it will probably take a number of years to return to a more normal market.
New Home Sales at 411K in March
by Calculated Risk on 4/23/2010 10:00:00 AM
The Census Bureau reports New Home Sales in March were at a seasonally adjusted annual rate (SAAR) of 411 thousand. This is an increase from the revised rate of 324 thousand in February (revised from 308 thousand). Click on graph for larger image in new window.
The first graph shows monthly new home sales (NSA - Not Seasonally Adjusted).
Note the Red columns for 2010. In March 2010, 38 thousand new homes were sold (NSA).
The record low for March was 31 thousand in 2009.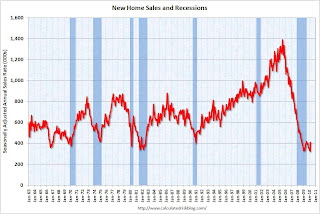 The second graph shows New Home Sales vs. recessions for the last 45 years.
Sales of new single-family houses in March 2010 were at a seasonally adjusted annual rate of 411,000 ... This is 26.9 percent (±21.1%) above the revised February rate of 324,000 and is 23.8 percent (±18.7%) above the March 2009 estimate of 332,000.And another long term graph - this one for New Home Months of Supply.
 Months of supply declined to 6.7 in March from 8.6 in February. This is significantly below the all time record of 12.4 months of supply set in January 2009, but still higher than normal.
The seasonally adjusted estimate of new houses for sale at the end of March was 228,000. This represents a supply of 6.7 months at the current sales rate.
 The final graph shows new home inventory.
 New home sales are counted when the contract is signed, so this pickup in activity is probably related to the tax credit. Note that that a few thousand extra sales NSA in March can make a huge difference in the SAAR.
Any further pickup in sales because of the tax credit will happen in April and then sales will probably decline again.
Greece Asks for Bailout
by Calculated Risk on 4/23/2010 08:32:00 AM
From Niki Kitsantonis and Matthew Saltmarsh at the NY Times: Greece Calls for Activation of Financial Rescue Package
Describing his country’s economy as “a sinking ship,” the Greek prime minister formally requested an international bailout on Friday ... The plan foresees up to €30 billion, or $40 billion, in loans from Greece’s euro-zone partners, as well as up to €15 billion from the International Monetary Fund.Not exactly a surprise ...
Late Night Greece Update
by Calculated Risk on 4/23/2010 01:36:00 AM
From the WSJ: Bonds Fall as Investors View Bailout and Default as Givens
The European Union's statistical authority said Thursday that Greece's 2009 budget deficit—already yawning—was wider than Athens had estimated. Also Thursday, Moody's Investors Service downgraded Greece's debt rating.And from The Times: Euro suffers as Greek credit rating takes another dive
Those twin developments sent Greek bond prices into a tailspin, a selloff that spread to bond markets in Portugal and Spain.
The euro skidded to its lowest level against the dollar in almost a year last night after Greece suffered another downgrade in its credit rating.The never ending saga ...
...
Sarah Carlson, Moody’s senior analyst for Greece, said: “It is unlikely that the rating will remain at A3, unless the Government’s actions can restore confidence in the markets and counteract the prevailing headwinds of high interest rates and low growth.
Thursday, April 22, 2010
Senate Panel: Rating Agencies Traded Fees for Ratings
by Calculated Risk on 4/22/2010 07:05:00 PM
From Kevin G. Hall and Chris Adams at McClatchy Newspapers:
Senate panel: Ratings agencies rolled over for Wall Street
A Senate panel investigating the causes of the nation's financial crisis on Thursday unveiled evidence that credit-ratings agencies knowingly gave inflated ratings to complex deals backed by shaky U.S. mortgages because of the fees they earned for giving such investment-grade ratings.I'm stunned but not surprised ...


